J. Range Manage.
471338-343, September 1994
Regional differences among Texas operators
R. C. ROWAN AND LARRY D. WHITE
rangeland
Authors are research associate, Department of Rangeland Ecology and Managemeni, Texas A&M University, College Station 77843-2126: professor and Extension Range Specialist, Texas Agricultural Extension Service, College Station 77843- 2126. At the time of the research, Rowan was Extension Graduate Assistant, Department of Rangeland Ecology and Management, Texas i&M University.
Abstract
Based on a 1990 mail survey of Texas beef cattle producers own- ing and/or operating rangeland, 54 % are older than 56 years, but nearly 95% bad completed a high school education. Seventy-five percent of total family income came from livestock production, off-ranch employment, and off-ranch investments. Percent of total income from off-ranch investments, off-ranch employment, live- stock production, and wildlife production varied with location (vegetation/resource management region). As ranch location pro- gressed from east (humid) to west (arid) ranches became larger, the proportion of livestock income increased, and rancher’s reliance on off-ranch employment decreased. Leasing additional rangeland increased the percentage of livestock income and prob- ably increased labor responsibilities which precluded the oppor- tunity (or need) to work off of the ranch. Number of years of ranching experience, rancher age, and the type of animal enter- prises also influenced percentages of family income from various sources. More brush control using mechanical, herbicide, and fire techniques was planned when ranchers perceived that more than 49% of their rangeland needed treatment. Less mechanical con- trol and more herbicide use was planned for weed control when ranchers perceived that more than SO% of the area needed treat- ment.
Key words: rangeland, decision-making, grazing rights, regional differences, income sources
Fully two-thirds of the land area in Texas is pasture and rangeland.
Land owners control over 35 million hectares suitable for livestock production, wildlife habitat, and recreational opportunities (U.S. Dept.
of Commerce 1987). As social, political, and economic constraints become more prevalent, the decisions made by ranchers will have far reaching effects on their economic survivability. Because many of these constraints are self-imposed by ranchers (i.e., deficient or spumed knowledge), range managers must recognize and integrate ecological relationships in order to achieve short- and long-term goals.
Basically, ranchers want to do the right thing, but the problem is one of determining how to define the “right thing” to do and how to assess
Research was funded by the USDA Soil Conservation Service and the Texas Agricultural Extension Service. Authors wish to thank Mr. Paul Pope. Extension Computer Specialist, for his contributions to data analysis and to Extension Range Specialists. C.W. Hanselka, A. McGinty. and B.S. Rector. for their contributions to ques- tionnaire design.
338
benefits and costs (White 1987).
Management decisions having deleterious effects on ecological con- dition of rangelands will ultimately affect the ability of rangelands to produce the goods and services necessary to meet basic needs (i.e., survival and security). But what determines when or if ranchers make informed management decisions about rangelands? In many cases abundant knowledge is available to the rancher, but technology adop- tion is minimal.
In 1988, the range program unit of the Texas Agricultural Extension Service adopted a long-range plan to determine the factors affecting ranchers’ range management decisions and choices, and to use this information to improve programs for clientele. The initial proposal included a statewide survey of Texas ranchers to create a database of operator and ranch characteristics influencing three program areas:
stocking rate management, grazing management and weed/brush man- agement.
Important questions addressed by this research were: (1) whether differences exist in personal or ranch characteristics across regional areas of Texas, (2) whether differences exist within personal or ranch characteristics across all Texas beef cattle producers, and (3) whether regional differences exist in rancher’s knowledge and use of rangeland technologies.
Methods
A database of names of livestock ranchers, considered the primary users of rangeland in Texas, was obtained through the Texas Beef Industry Council. The database included approximately 80,000 names of beef cattle producers as of August 1989. Many of these producers raise several kinds of livestock, however, the survey database may have excluded ranchers raising only sheep and/or goats. Wildlife ranchers were probably included in the database since livestock (usu- ally cattle) are required to maintain an agricultural land tax base.
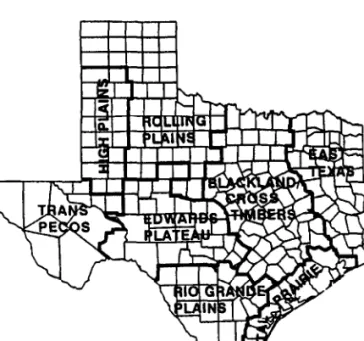
Ranchers were surveyed statewide with the exception of several east Texas counties composed primarily of forest land. The rangeland areas of the state were divided along county boundaries into regions exhibit- ing similarities in vegetation/resource management (after Gould 1975) for evaluation of potential effects of sociological/environmental/his- torical influences on management decisions (Fig. 1).
A stratified systematic random sample (Snedecor 1956) of 1,000 names’ from each of 7 regions was drawn to receive a mail question-
%mple size was set at 1,000 for each region in an effort to maintain a suflicient num- ber of responses for analysis within region.
JOURNAL OF RANGE MANAGEMENT 47 (5) September 1994
Results and Discussion
Nonresponse Validation
Completed telephone questionnaires from 421 ranchers (160 ques- tionnaires/region) were analyzed. Results from t-tests and categorical analysis demonstrated that the two subsample populations, mail sur- vey respondents and nonrespondents, were from the same overall pop- ulation. There was no evidence to conclude that the nonrespondents refused to respond because of some nonrandom pattern. Respondents to the mail survey were accepted as representative of the population of Texas “beef cattle” ranchers.
Fig. 1. Vegetation/management regions of Texas for stratified systematic sampling of ranchers. Adapted from Gould (1975).
naire. Although each of several drafts of the questionnaire was reviewed by 7 Extension Range Specialists, no other pretest was administered. Questionnaires were mailed in the spring of 1990 with follow-up questionnaires and postcards sent approximately 3 and 6 weeks thereafter, respectively. After data entry, 10% of respondent records were checked for systematic or repeating errors and for ran- dom keystroke errors.
Models with 2 independent variables and an interval-scale depen- dent variable were analyzed by one-way analysis of variance (ANOVA). Interaction between the 2 independent variables in each model was tested and multiple mean comparisons were performed when the interaction term was nonsignificant. On- and off-ranch sources of income were chosen, individually, as the dependent vari- able in several models, while age and percent of ranch needing treat- ment for weeds/brush were chosen in others. Important for future analyses is that income sources were measured as percent of total fam- ily income.
Independent variables for age of the rancher and years of ranching experience were measured as interval variables, but were categorized when used as an independent variable in ANOVA. Level of formal education*, grazing rights (owned vs. leased), animal enterprise diver- sity, and grazing programs were measured as nominal responses. Size of the ranch (hectares) was categorized from experience of the authors (Rowan and Workman 1992). An independent nominal variable com- mon to all ANOVA models was region of the ranch.
Surveying any population can be problematic when response is less than lOO%, leaving room for response and nonresponse bias (Assael and Keon 1982). Nonrespondent subsampling is a widely used tech- nique to correct nonresponse bias (Ognibene 1971). Analysis of non- respondents was necessary to validate mail survey responses, enabling inference of results to all Texas beef cattle ranchers. A stratified ran- dom sample of 400 completed telephone questionnaires was targeted to minimize margin of error. T-tests and chi-square tests were used to determine if differences existed between survey responses of the respondent and nonrespondent populations.
‘Lcvcls of education were: no formal education, grade school education, high school education, some college, Cyear college degree, and advanced degree.
Response frequencies
Respondents returned 1,862 usable questionnaires, constraining the margin of error to well within &5%. Raw return rate, including ques- tionnaires marked “non-owner or operator of rangeland” and non- deliverables, was 49.3%. The statewide usable response rate was 35.2%, calculated as the fraction of usable and refusal returns divided by the actual number of ranchers eligible to answer the survey (total minus nonusable surveys).
The average Texas ranch included 2,292 hectares of deeded and leased rangeland, and the median was 263 hectares. Only 54% of ranchers owned and operated all of their range acreage. The average rancher was 56.2 years of age. This mean compared favorably with the mean age of south Texas ranchers (58 years) reported by Hanselka et al. (1991). Respondent’s total years of ranching experience averaged 26.8 years, with a median of 25 years. As an average, ranchers had operated their current ranch 19.8 years, slightly higher than the 16.8 years reported by census figures for all farm operators (U.S.
Department of Commerce 1987).
Nearly 95% of ranchers had completed high school, 70% had attended some college, and 28% had completed college. The distribu- tion is similar to other studies (Albrecht and Ladewig 1983, Ladewig et al. 1986, Thomas et al. 1990). For ranchers who had completed col- lege, only 40% of those degrees were in agriculture.
Livestock production contributed the most to overall income (30%), followed by off-ranch employment (26%), off-ranch investments (19%), farming (8%), mineral/gas leases (6%), wildlife (2%). hay/seed (2%), and “other” (7%).
Regional Analysis
Percent of Total Family Income from Off-Ranch Investments Location of the ranch had a significant effect on a rancher’s percent of total income from off-ranch investments. Ranchers near the larger population centers tended to have higher investment income percent- ages (Table 1). Mean investment income percentages in the Edwards Plateau, Blacklands/Cross Timbers and Rio Grande Plains were sig- nificantly higher than in the High Plains and Rolling Plains.
Ownership/management levels also impacted the proportion of total family income from off-ranch investments. Ranchers who owned rangeland but leased it to others obtained significantly higher percent- ages of total income from off-ranch investments (27%) than ranchers who owned and operated their ranches (20%) or who owned land and leased land from others (20%), which were in turn higher than those ranchers who leased all of their land from someone else (11%).
Generally, leased land is owned by absentee landowners who have inherited or purchased the land and have other forms of family income.
Neither the diversity of animal enterprises utilized on the ranch nor the presence of weed/brush control significantly influenced the per- cent of total family income from off-ranch investments. Age of the rancher did, however, have a significant effect on off-ranch investment incomes. Ranchers who were over 65 years of age derived higher per-
JOURNAL OF RANGE MANAGEMENT 47 (5) September 1994 339
Sm0FRANcHW-W
l rwbm *mQdb8r88mpar88ntofwln8om8.
Fig. 2. Results of Duncan’s Multiple Range Test of ranch size on percent of total income from off-ranch employment. Different letters at the top of the bars denote significantly diierent means.
centages of total family income from off-ranch investments (30%) than did ranchers in the 36-45 age category (9%), the < 25 year cate- gory (8%). or the 26-35 age category (7%).
Percent of Total Family Income from Of-Ranch Employment When the dependent variable was specified as percent of total fam- ily income from off-ranch employment, size of the ranch had a sig- nificant impact. As ranch size increased, percent of total family income from off-ranch employment declined as a curvilinear relation- ship (Fig. 2). Very-small-acreage ranchers operating less than 16 hectares had significantly higher percentages than did small-acreage ranchers operating 17 to 129 hectares. Ranchers operating between 130 to 2,024 hectares derived significantly higher percentages of fam- ily income from off-ranch employment than ranchers operating larger ranches above 10,121 hectares.
Closer examination of the very-small-acreage and small-acreage ranchers revealed little difference between the ages of respondents (55.0 and 55.8 years, respectively). In addition, there was little observable difference in education levels. However, the very-small- acreage ranchers had acquired 8 fewer years ranching experience (16 vs. 24), derived 7% less family income from farming (1% vs. SS), and derived 8% less family income from livestock production (7% vs.
15%).
Ownership rights and region of the ranch significantly impacted
family income from off-ranch employment. Ranchers who had deed- ed and leased land in their operations had lower proportions of total income from off-ranch employment (20%) than any other ownership type (range 28-30%). BlacklandsKross Timbers ranchers earned the highest proportion of total family income from off-ranch employment, which was equal to Coastal Prairie ranchers but significantly higher than Rio Grande Plains ranchers (Table 1). High Plains ranchers earned the smallest percentage of total family income from off-ranch employment income.
Rancher age significantly influenced off-ranch e’mployment.
Ranchers above 65 years earned significantly smaller proportions of total family income from off-ranch employment (10%). They tend to be “retired,” have less opportunity or need for off-ranch employment, and have higher levels of off-ranch investments. The average propor- tion of family income from off-ranch employment for all ages below 65 years revealed no significant differences (range = 26%-38%), but the 46-55 age category, perhaps at the peak of career earnings, earned the highest percentage (38%).
Percent of Total Family Income from Livestock Production As might be expected, percent of total family income from livestock production was significantly affected by ranch location (Table 1) as well as ownership rights (Table 2). Ranchers with a leased component in their operation (lease & deeded or lease all from others) derived significantly higher percentages of family income from livestock pro- duction than those who simply owned and operated their own land.
Trans Pecos ranchers obtained the highest average proportion of total family income from livestock production which was significant- ly higher than in the Edwards Plateau, Rolling Plains, and High Plains (Table 1). Rio Grande Plains, Coastal Plains, and BlacklandsKross Timbers ranchers’ percentages were equal but significantly lower than all other regions.
Animal enterprise diversity significantly influenced the percent of total family income from livestock production. Livestock production comprised a larger portion of total family income when animal enter- prises included commercial cow/calf, deer/antelope, and quail (39%) than when enterprises included either commercial cow/calf (22%) or
This was not unexpected. The state of Texas includes many ecolog- ically diverse vegetation regions and a very diverse population. While certain results from the statewide survey may seem obvious to some observers, they have not been embraced so boldly by rangeland con- sultants, classroom instructors, or extension educators/administrators.
While the conclusions drawn herein specifically relate to Texas ranch- ers/rangeland operators, it is reasonable to assume that rancher and ranch characteristics in other states exhibit considerable variation and efforts should be made to quantify those differences. Disclosure of those management characteristics has direct application in Extension efforts should be made to quantify those differences. Disclosure of
lbhle 1. Significant regional differences among income sources, os percent of total family income, detected by Duncan’s Multiple Range Test.
Region of Ranch’
Income Sources n 1 2 3 4 5 6 I
_________________________perceot ___-________-_______---
Off-Ranch Investments 1462 7”) 13b” 17* 23’ 22’ 17-b 21’
Off-Ranch Employment 1462 16’2 21” 1P 1P 39 34’ 27”
Livestock Production 1462 34b 2 34b 43’ 35b 21’ 21c 27’
Wildlife Production 1462 0.26’ l.o”d 3.7” 6.3’ 0.Y we 2.3b”
‘Regions correspond to: I=High Plains, 2=Rolling Plains, 3=Trans Pecos, 4&dwards Plateau. S=Blacklands/Cmss Timbers. B=Coastal Prairie. and 7=Rio Grande Plains.
‘Row values are percent of total family income.
‘Means within rows differ (IW.05) when followed by different letters.
‘lhble 2. Significant differences in livestock production income, as a percent of total family income, among grazing rights and grazing programs.
(a)
‘I+. of Grazing Tenure’
Lease &
Deeded
Lease All
Own &
Operate
Own, but lease to Others
__----______________________________- ______________percent___________________________________ _____________-
36* 34’ 29b 1T
OJ)
m of Grazing Program’
Decisional Rotation
Short Duration
Year-long Continuous
Seasonal Continuous
Deferred
Rotation Rotational Switchback
___________________________________ ______________perceut___________________________________ ______________
42* 29b 2lb 21b 23b 23b 21b
‘Row values arc Descent of total familv income from livestock moduction.
‘Means within rows differ (P4.05) &en followed by differ& letters.
purebred/registered cattle (21%). All other income means for animal enterprise combinations overlapped and could not be distinguished.
Apparently, the greater the animal enterprise diversity on the ranch, the greater the contribution of livestock production as a percentage of total family income. The 2 lowest percentages of livestock income obtained by ranchers were from single animal enterprise ranches.
Educational level significantly influenced percent of total family income from livestock production. Highest proportion of total income from livestock production was for ranchers with only a grade school education (39%), while ranchers with advanced degrees derived the lowest proportion (21%). Ranchers with advanced degrees in the regions which contained the larger population centers (Blacklands, Coastal Prairie and Rio Grande Plains) obtained smaller proportions of family income from livestock than their counterparts in other regions. This is probably a direct influence of urban professionals pur- chasing or inheriting ranches.
The type of grazing program currently in use significantly influ- enced percent of total family income from livestock production.
Ranchers utilizing unplanned rotation of multiple herds and pastures (decisional rotation) derived a greater percentage of their total family income from livestock production (Table 2). There were no mean dif- ferences in the proportion of total income from livestock production for all the other grazing programs (range = 21% - 29%). All grazing programs listed on the survey were compared except the Merrill sys- tem and two short-duration grazing systems. This was because they were not checked frequently on the survey form as the only program currently used. Only 19 ranchers out of 1,372 were currently using the Merrill program exclusively, while only 31 and 26 were exclusively using the high-intensity low-frequency and Savory short duration grazing programs, respectively.
(PC 0.0001 and PC 0.0024, respectively). Ranchers planning to use a combination of more herbicide, more mechanical methods, and more prescribed fire reported a higher percentage (49%) of their rangeland needing treatment for brush at the present time than did ranchers with planned combinations of no herbicide use, no mechanical methods, no prescribed fire, and no sheep and goat grazing (12%). Other treatment combination means could not be distinguished from one another. The top 7 combinations of future brush treatment practices included some form of increased herbicide or mechanical control. Ranchers perceiv- ing little need for weed/brush control consistently declared their inten- tions to use less herbicide or no herbicide.
When ranchers perceived that 5 1% of their rangeland needed treat- ment for weed problems, instead of brush control, they planned more herbicide use with less mechanical methods. However, when the per- centage of rangeland needing treatment dropped to 34%, the choice of future treatment method was reversed to include less herbicide with more mechanical. If no more than 9% of the rangeland needed treat- ment for weeds, then ranchers were planning no weed control of any kind.
Reasons given by ranchers for planning specific weed/brush control programs are shown in Table 3. A majority of ranchers considering herbicide or mechanical treatments for weeds/brush control were planning to use more of each (67% and 79%, respectively). Ranchers who were considering the use of prescribed fire were split between using more (48%) or none (48%).
Percent of Total Family Income from Wildlife Production Income from wildlife enterprises contributed only 2% to the statewide average respondent’s income. However, there were differ- ences across the regions of the state (Table 1). Ranchers in the Edwards Plateau derived a significantly greater percentage (6.3%) of their family income from wildlife than any other region. High Plains and the BlacklandsKross Timbers ranchers derived the smallest por- tion (0.2%-0.5%) of their total family income from wildlife.
Increased economic returns was the primary reasons given by ranchers for using more herbicide or more mechanical control of weeds/brush. However, some ranchers considered the costs of mechanical control to be prohibitive and they planned fewer or no mechanical treatments1 Safety was the primary reason for not using prescribed fire or for using less of it. Those planning to use more pre- scribed fire considered economic returns as the primary reason.
Economic returns from using sheep and goats to control weeds/brush were either a positive incentive to use them more (75%), a negative incentive to use them less (65%), or not at all (40%).
Conclusions
Percent of Rangeland Needing Treatment for Brush
Rancher’s plans to control weed/brush and region of ranch were sig- nificantly related to the percent of rangeland needing brush treatment
The statewide survey of ranchers found a great deal of variation in responses between regions, and considerable variation within regions.
This was not unexpected. The state of Texas includes many ecologi- cally diverse vegetation regions and a very diverse population. While certain results from the statewide survey may seem obvious to some observers they have not been embraced so boldy by rangeland con-
JOURNAL OF RANGE MANAGEMENT 47 (5) September 1994 341
‘able 3. Ranchers future plans to use more, less or none of each type of weed/brush control practice and reasons for selecting that control prac- tice.
5pe of control
Chemicals
Reasons for use/nonuse Envtron-
Use Safety costs Returns mental
--_----_---Percent---__
more-67% 2 12 81 5
less-17% 7 28 15 50
none-16% 17 31 20 32
Mechanical more-79%
less-11%
none-lo% 4 58 30 8
Prescribed fm more.-48% 4 32 54 10
lessA% 52 0 20 28
none-48% 66 3 15 16
Sheep and goats more-31% 2 12 75 11
less-6% 0 19 65 16
none-63% 5 35 40 20
sultants, classroom instructors, or extension educators/administrators.
While the conclusions drawn herein specifically relate to Texas ranch- ers/rangeland operators, it is reasonable to assume that rancher and ranch characteristics in other states exhibit considerable variation and efforts should be made to quantify differences. Disclosures of man- agement characteristics has direct application in Extension program- ming and other rangeland “classrooms.”
For example, when 54% of Texas livestock producers are older than 56 years, transfer of ranch ownership will occur in the near future.
Some extension programs have been developed (i.e., Ranching Heritage workshops) to facilitate ranch transfer in the best possible resource condition and at the lowest estate cost.
People enter ranching for many different reasons. The trend seems to be that individuals with nonranching vocations and little or no agri- cultural background become financially secure from offlranch sources and buy or inherit rural land for lifestyle, recreational, or aes- thetic considerations. Profit, per se, is not always the primary motive for ownership. These “ranchers” may own only a few hectares, or may invest in sizable acreages, but the majority of “ranches” in Texas are small (median of 263 hectares). The characteristics of small-acreage ranchers should be considered when designing programs to meet their management needs. (Rowan 1994).
Ranch size may dictate to a certain extent the portion of total fami- ly income derived from various sources, but size is also a function of the region of the state. As ranch location progresses from east (humid) to west (arid) ranches become larger, the proportion of livestock income increases, and rancher’s reliance on off-ranch employment income decreases with increased distances to metropolitan areas. On the other hand, investment income as a percent of total family income increased with age, which implied a movement toward financial secu- rity and greater reliance on other sources of income. It might seem obvious that ranchers in arid areas, and especially older ranchers, would rely less on off-ranch employment and more on off-ranch investment opportunities. However, it is important to note that ranch- ers have traditionally relied on ranch equity as a buffer in “retirement”
years. For many ranchers, retirement means continued reliance on ranch income while everyday management responsibilities are trans- ferred to children or employees. Thus, retirement benefits from self- employment taxes may only supplement ranch income/equity.
The number of years of ranching experience and the type of animal
enterprises may also have impacts on sources of family income.
Ranchers who diversify spread the risk of fluctuating price cycles common in livestock markets and more “effectively” utilize a diverse range resource. For example, Texas ranchers derived 2% of their incomes from wildlife enterprises. Even though this number appears to be low, Pope et al. (1983) reported between 1 to 3.5% of total cash receipts from agricultural production in Texas in 1981 were from wildlife. Rancher’s management decisions concerning animal diversi- ty may also be linked in their predisposition towards full time ranch- ing. With fewer options to diversify off-ranch enterprises (e.g., employment and investments), ranchers tended to diversify on-ranch animal enterprises. Leasing additional rangeland probably adds more ranch income and increases labor responsibility which precludes the opportunity (or need) to work off of the ranch. Actively leasing land to expand operations probably indicates a desire to ranch rather than rely on other sources of income. Furthermore, diversification seems to be a function of rancher age. Coastal Prairie ranchers, operating a combination commercial cow/calf and stocker cattle operation, were younger (45 years) than Edwards Plateau ranchers (73 years) operat- ing stocker cattle enterprises. Perhaps stocker operations have fewer problems and require fewer decisions which is why they are preferred by older ranchers.
Treatment of weeds/brush is an important management considera- tion. Initial investment and periodic costs are slowly recovered. There is risk involved in investment of ranch capital in relatively long-term improvements. The alternative is to invest off-ranch income, if avail- able. Ranchers treating weeds/brush not only desired increased live- stock income, but also appeared to be cognizant of ranch income in the decisions to treat weeds/brush. Ranchers who treated for weeds/brush had lower proportions of total family income from off- ranch employment and higher proportions of total family income from livestock production. Treatment of weeds/brush may be a func- tion of lower reliance on off-ranch income and the need to maintain or increase production to provide for family finances. Absence of treatment with increased percentage of off-ranch employment may result from either time constraints of off-ranch employment or it may be lack of weed/brush experience or knowledge associated with being a part-time rancher. Or a simple explanation might be that these ranchers were short of money to invest in treatment, had off-ranch jobs, and were less dependent on the ranch for support.
Apparent “thresholds” for various treatment methods were dis- closed from weed/brush ANOVA models. Ranchers planned to use more herbicide and more mechanical methods on a ranch needing approximately 50% of the area treated for brush. Ranchers were not planning any treatment if the ranch contained no more than 12%
brush. As a statewide average, it appeared that 12% of total land area in brush was either a tolerable or a desirable amount, depending upon ranch goals. Ranchers have derived through experience this lower threshold or they do not recognize the need for treatment at that level.
Apparently, the recommendation for maintenance control to prevent brush infestation is not widely accepted. When approximately 50% of the ranch area needed treatment for weeds, ranchers were planning to use more herbicide and less mechanical methods. However, if the area needing treatment was only 35%, ranchers reversed the order of treat- ment type and used more mechanical methods with less herbicide. If the ranch was covered by no more than 9% weeds, ranchers were planning no treatment controls.
Generally, education level did not positively impact ranch practices.
It did show a negative impact on the percent of total family income from livestock production. It would not be a correct interpretation to say that additional education “causes” lower levels of livestock income. However, in the light of income derivatives as a percent of total family income, increased education reduced reliance on percent of education are probably used to obtain non-ranch employment that
increases the proportion of off-ranch employment income relative to Ognibene, P. 1971. Correcting nonresponse bias in mail questionnaires. J. Of the proportion of livestock production income. This means that as the Marketing Res. 8:233-23X
percent of total family income from off-ranch employment increases, Pope, C.A., C.E. Adams, and J.K. Thomas. 1983. The economic value of Percent of total family income from livestock production decreases, wildlife resources in Texas. Texas Agric. Exp. Sta. SP-2, Dir. 83-l. Texas typical of central/eastern Texas ranches near large cities. A&M Univ., College Station.
Rowan, R.C. 1994. Are small-acreage livestock producers real ranchers?
Literature Cited Rangelands 16:161-166.
Rowan. R.C. and J.P. Workman. 1992. Factors affecting Utah ranch prices.
Albrecht, D.E. and FL Ladewig. 1983. The adoption of irrigation technology:
the effects of ecological and traditional variables. Paper presented at the Annual Meeting of the Rural Sociological Society, Lexington, Ky.
Assnel, H. and J. Keon. 1982. Nonsampling vs. sampling ermrs in survey research; J. of Marketing 46:114-123.
Gould, P.W. 1975. The grasses of Texas. Texas A&M University Press, College Station.
Hanselks, C.W., J.C. Paschal, and C.L. Richardson. 1991. South Texas ranching-a profile. Texas Agric. Ext. Serv. B-5010. Texas A&M Univ., College Station.
Ladewig, H., J.K. Thomas, and G.M. McWhorter. 1986. The impact of the cotton integrated pest management program of the Texas Agricultural Extension Service: a statewide assessment. Technical Report (Dec.). Texas Agric. Ext. Serv. Texas A&M Univ., College Station.
J. Range Manage. 45263-266.
Snedwor, G.W. 1956. Statistical methods. The Iowa State College Press, Ames.
Thomas, J.K., H. Ladewig, and W.A. McIntosh. 1990. The adoption of inte- grated pest management practices among Texas cotton growers. Rural Sociology 55(3):395-410.
U.S. Department of Commerce. 1987. Census of agriculture. Bureau of the Census. 977 pp.
White, L.D. 1987. Successful ranching: selecting the right things to do, p. 30- 42. In: L.D. White and T.R. Troxel (eds.). Proc. 1987 International Ranchers Roundup. Texas Agric. Ext. Serv., Uvalde. Tex.p
JOURNAL OF RANGE MANAGEMENT 47 (5) September 1994 343