J. Range Manage.
47:107-111, March 1994
A Viewpoint: Using multiple variables as indica- tors in grazing research and management
DAVID L. SCARNECCHIA
Author is associate professor, Department of Natural Resource Sciences, Washington State University, Pullman 99164-6410.
Abstract
Multi-variable analysis of grazing research has seen little con- ceptual development and even less application. To advance reseruThonthemultiplerelatiorshipsoflivestock~,computer-based analyses using multiple variables are needed. Dynamic variables describing livestock-herbage relationships must be developed to describe dynamic processes such as herbage growth and disap- pearance. Such variables could be used either alone or in combina- tion with other variables as indicators to analyze and manage grazing. This paper presents 4 arrays of derived variables and discusses their individual and combinational value in analyzing and managing grazing. Greater power in analyzing grazing will come from use of combinations of variables rather than relying on single variables, e.g., stocking level. The variables described are useful in comprehensive analyses of research or in ad hoc roles aiding decisions in management. The paper also discusses possible future uses of variables as indicators in computerized analyses of other ecological systems.
Key Words: stocking rate, stocking level, grazing systems Multi-variable analysis of grazing research has seen little con- ceptual development and even less application. Both its develop- ment and application are long overdue. A recent paper by Hart (1993) analyzing the citation histories of different schools of stock- ing rate research is in itself clear evidence that single variable grazing research based principally on stocking rate has in theory and practice gone as far as it can go. To advance research on the multiple relationships of livestock grazing, computer-based ana- lyses using multiple variables are needed. Such multi-variable ana- lyses are needed tools in describing the complexities and synergies of grazed systems. The multiple variables used in research can also be used as indicator variables in simplified models for analysis and decision making.
Scientific analysis of grazing research has been limited by the use of static variables to describe dynamic processes. Concepts and associated variables describing livestock-herbage interactions often have been developed and defined to fit existing field sampling techniques. Dynamic variables must be developed to fit dynamic processes, and then appropriate techniques developed to either measure or model data to calculate values for the variables. Vari- ables describing instantaneous conditions (rate variables) (Forres- ter 1961) and variables describing cumulative effects over a period of time (level variables) are both needed.
Earlier papers (Scarnecchia and Kothmann 1982, Scarnecchia 1985a) presented an array of dynamic stocking variables describing relationships among the basic variables of animal demand in animal-units (AU), pasture area (ha), total herbage in a pasture (kg
Approved by the director, College of Agriculture and Home Economics Research Center as Scientific Paper 7871, Project 0617.
Manuscript accepted 2 Aug. 1993.
or tons), and time. The total herbage in a pasture (kg or tons) used in calculating some stocking variables (e.g., grazing pressure, (AU/ kg)) is easily sampled by clipping, but clipping is inadequate to determine growth and disappearance which occur in pastures. In a later paper, Scarnecchia and Kothmann (1986) presented another array of variables describing growth, disappearance, and accumulation of herbage under livestock grazing. By relating vari- ables describing animal demand, herbage intake, and animal pro- duction to variables describing growth, disappearance, and accumu- lation of herbage, other arrays of dynamic variables can be derived which describe livestock-herbage relationships. This paper pres- ents 4 arrays of derived variables and discusses their individual and combinational value in the analysis of grazing.
Demand, Intake and Production Relationships With an appropriately abstracted definition of an animal-unit as a unit of animal demand rather than a unit of intake (Scarnecchia
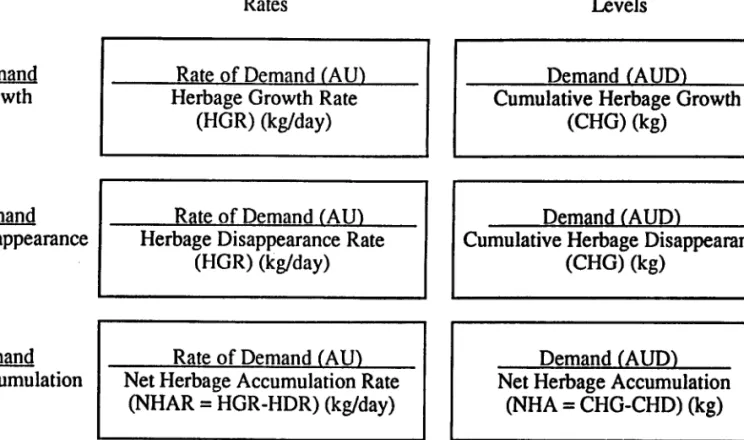
1985b, Scarnecchia and Gaskins 1987), an array of variables relat- ing animal demands to growth, disappearance, and accumulation of herbage can be derived (Table 1). The 3 rate variables describe instantaneous relationships, while the 3 accumulation variables are calculated over a period of time. Each of 3 rate variables describes a different relationship and each numerator and denominator of the level or accumulation variables is the mathematical integral of each corresponding numerator and denominator of the rate variables.
Because the number of animal-units stocked is a management decision and may be set arbitrarily, and because growth and disap- pearance of herbage may approach or be 0, all 6 variables may be mathematically undefined (i.e., division by 0) or take on extreme values. The 2 demand/accumlation variables may be positive or negative, depending on whether growth exceeds disappearance. In most real systems, they can be used either alone or in combinations in making management decisions such as when to move animals from a pasture. The animal-unit-day/cumulative herbage growth (AUD/ CHG) and AUD/cumulative herbage disappearance (CHD) variables (Table 1) are used in deriving 2 interchangeable defini- tions of stocking efficiency (Scarnecchia 1988).
Table 2 shows analogous variables describing intake/ herbage relationships. In the 2 variables in Row 2 of Table 2, intake is part of disappearance so that the variables in Row 2 cannot have values
>l. The rate of intake/herbage disappearance rate (HDR) and amount of intake/ CHD variables will be LO but 5 1 in all systems.
The denominators of the variables in row 2 of Table 2 may be replaced with (herbage disappearance rate excluding intake), and (cumulative herbage disappearance excluding intake), respectively, yielding 2 other variables whose values are mathematically unde- fined if the above denominators are 0, or may be very large if the denominators are small. Like their analogues in Table 1, the 2 intake/ accumulation variables may be positive or negative in sign.
The amount of intake/ CHG and amount of intake/ CHD variables
accumulation. Abbreviations: AU-anim&nit; AUfLanimal-unit-day.
Table 1. Rate and level variables describing relationsbios between animal demand expressed in animal-units and herbage growth, disappearance and
Rates Levels
Demand Rate of Demand (AU) Growth Herbage Growth Rate
(HGR) (kg/day)
Demand Disappearance
Demand Accumulation
Rate of Demand (AU) Net Herbage Accumulation Rate
(NHAR = HGR-HDR) (kg/day)
Demand (AUD) Net Herbage Accumulation
(NHA = CHG-CHD) (kg)
Table 2. Rate and level variables describing relationships between animal intake and berbage growth, disappearance and accumulation.
Rates Levels
=h ~1~1
Intake
Disappearance
Intake
Accumulation
Rate of Intake (kg/dav) Net Herbage Accumulation Rate
(NHAR = HGR-HDR) (kg/day)
Amount of Intake (kg) Net Herbage Accumulation
(NHA = CHG-CHD) (kg)
108 JOURNAL OF RANGE MANAGEMENT 47(2), March 1994
are used in deriving either of 2 interchangeable definitions of harvest efficiency (Scarnecchia 1988).
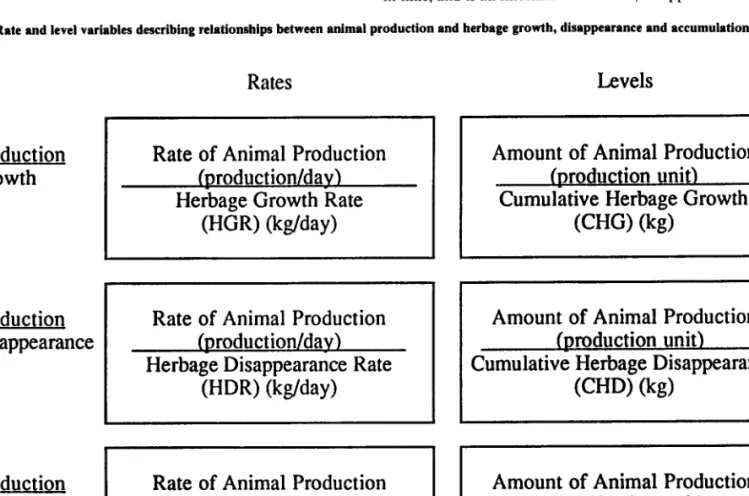
Animal production/herbage variables are shown in Table 3.
Because animal production (either the rate or amount over some period of time) is not a direct managerial decision, mathematically it is more restricted than the number of animal-units that can be stocked. Notwithstanding this slight difference, the variables in Table 3 have mathematical behaviors similar to their analogues in Table 2. The amount of production/ CHG and amount of produc- tion/ CHD variables in Table 3 are used in deriving 2 interchange- able definitions of a particularproduction efficiency (Scarnecchia
1988).
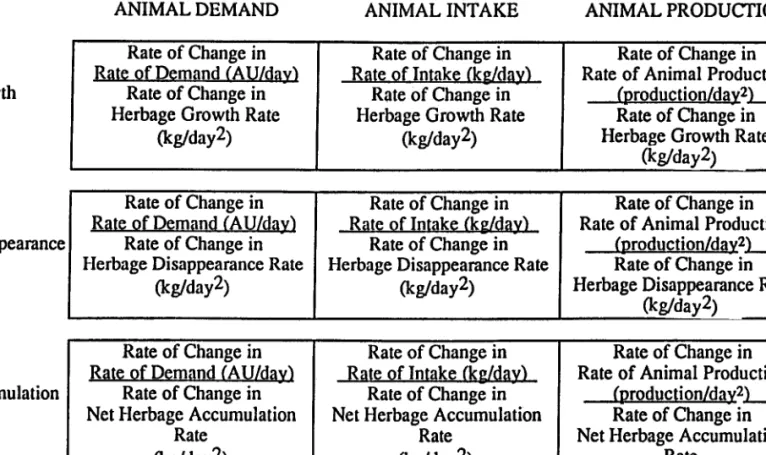
Each numerator and denominator in the 9 rate variables in Table 2 and 3 may be separately differentiated with respect to time, yielding 9 additional variables (Table 4). These additional vari- ables describe instantaneous relationships between the instantane- ous rates of change in each respective numerator and denominator.
These variables would be useful primarily in modeling research in identifying and predicting trends. Although these variables are potentially useful in the future, the discussion that follows focuses mainly on the more immediately applicable rate and level variables in Tables l-3.
Identification of the Important Variables and Description of their Uses
The variables in Tables 1 through 3 are generated by grazing and are subject to limited control by a manager. Comparatively, the variables in Table 1 are subject to greater control because the number of animal-units stocked (and thus the numerators) are directly controllable, although limited by indivisibility of individ-
ual animals. The intake variables (Table 2) are subject to less direct control because intake is a more complex function than animal demand, i.e., total intake is a function of other variables in addition to the number of animal-units stocked. The production variables (Table 3) are subject to even less direct control because production is a function of other variables in addition to intake.
Among the variables in the Tables l-3, which ones are most useful? All variables will be useful in modeling and in model-based planning. Each of the 18 variables contains different information;
potentially each is useful either alone or in combinations as indica- tors for planning. Just as a technical analyst of financial markets may use a number of indicators (ratios, indices, or other variables) to predict market movements or make buy and sell decisions, a pasture manager may use any of these variables, either for specific pastures or more generally for making decisions about grazing. A variable which may be a useful indicator in one situation may be less useful in another. For example, the herbage growth variables (Row 1, Tables l-3) may be useful indicators during the growing season, but not during the dormant season. When disappearance is more rapid, the herbage disappearance variables (Row 2, Tables
l-3) may be more important. Single variables alone may be useful indicators for ad hoc planning tactics, but will usually be more useful when combined with stocking variables (grazing pressure, stocking rate, etc.) or with other variables in Tables l-3. Many uses in management and modeling are possible for the variables in Tables l-3, limited only by the insights of the researcher or manager.
Some variables in Table 2 express interesting individual rela- tionships. The rate of intake/ HDR variable (Table 2) expresses the fraction of disappearance which is disappearing as intake at a point in time, and is an instantaneous intake/disappearance efficiency.
Table 3. Rate and level variables describing relationships between animal production and herbage growth, disappearance and accumulation.
Production Growth
Production Disappearance
Production Accumulation
Rates
Rate of Animal Production (nroduction/dav) Herbage Growth Rate
(HGR) (kg/day)
Rate of Animal Production (nroduction/dav) Herbage Disappearance Rate
(HDR) (kg/day)
Rate of Animal Production (nroduction/dav)
Net Herbage Accumulation Rate (NHAR = HGR-HDR) (kg/day)
Levels
Amount of Animal Production (nroduction unit)
Cumulative Herbage Growth (CHG) (kg)
Amount of Animal Production (txoduction unit)
Cumulative Herbage Disappearance (CHD) (kg)
Amount of Animal Production (production unit) Net Herbage Accumulation
(NHA = CHG-CHD) (kg)
Table 4. Variables describing instantaneous relationships among rates of change in rates of animal demand, animal intake, and animal production and rates of change in rates of herbage growth, disappearance and accumulation.
ANIMAL DEMAND ANIMAL INTAKE
Growth
Rate of Change in Rate of Demand (AU/&y)
Rate of Change in Herbage Growth Rate
&g/day*>
Rate of Change in Rate of Intake (kg/day)
Rate of Change in Herbage Growth Rate
(kg/day*)
Disappearance m
Accumulation
Rate of Change in Rate of Change in
IRate of Intake (ke/dav) Rate of Animal Production
Rate of Change in fnroduction/day*L Herbage Disappearance Rate Rate of Change in
fig/day*)
I I I
Herbage Es,pe;,-ance Rate 0 (1.)
\“&y UUJ , I
Rate of Change in Rate of Change in Rate of Change in Rate of Demand (AU/day) Rate of Intake (k&l&_ Rate of Animal Production
Rate of Change in Rate of Change in fnroduction/day*l_
Net Herbage Accumulation Net Herbage Accumulation Rate of Change in
Rate Rate Net Herbage Accumulation
&s/day*) (kg/day*> Rate
(kg/day*)
ANIMAL PRODUCTION
Rate of Change in Rate of Animal Production
fnroduction/da$L Rate of Change in Herbage Growth Rate
(kg/clay*) 1 =
The amount of intake/CHD (Table 2) expresses a similar fraction over a period of time, and represents an intake/disappearance efficiency over that time. Both variables are individually useful in describing results of grazing research, partly because both are mathematically well behaved and vary in value from 0 to 1. The amount of intake/ CHD variable can be modified by adding a final amount of herbage per pasture (TH) at the end of time interval t-to for which it is calculated to define a harvest efficiency of all herbage to which animals have had access during at least some portion of t-to (Scarnechia 1988).
are compatible with the key species and key area concepts range and pasture science.
Identification of variables such as those in Tables l-3 is impor- tant because once identified, they demand an heuristic reorienta- tion of methods of measurement or simulation in order to use them. When such variables are functionally important, they encourage increased efforts to measure or model basic variables (e.g., growth or disappearance) previously considered difficult to measure, but nonetheless critical to thorough understanding.
In Table 3 the rate of production/ HDR and amount of produc- tion/CHD variables relate animal production to herbage disap- pearance and describe the efficiency of use of disappearance for animal production. The animal production/ herbage growth vari- ables (Row 1, Table 3) describe how new herbage growth is related to animal production. All 4 variables should also be useful in modeling animal production on different kinds of herbage.
All variables in Table 3 are appropriate for use in time-lag analyses where the production rates and amounts at or during a time may be related to herbage variables at or during a previous or later time. In fact, all of the variables in Tables l-3 can be used in such analyses. The interpretation of the intake/disappearance var- iables (Row 2, Table 2) will be slightly changed, as the values of both variables will no longer necessarily be Il. Otherwise, inter- pretations of these and the other variables will be little changed.
All variables in Tables l-3 may be calculated either on a wet or dry matter basis. Although often ignored and eliminated by dry matter calculations, herbage water content is often important in analyzing livestock nutrition and behavior. This importance makes the variables useful on both wet and dry matter bases.
Each of the variables in Tables l-3 might be useful either alone, in combination with other variables shown and/ or in combination with stocking variables. In ecologically based livestock systems in which indicator species and indicator areas are often used in managerial decisions, dynamic variables may analogously serve as indicators in research and management. Effort must be directed at developing more accurate methods of measuring or modeling her- bage growth and disappearance used in many of the variables by using modeling techniques and by building on such basic work as that of Gammon and Roberts (1978). Also, less dependence on single variables (e.g., stocking level) in describing relationships will improve interpretations of research. Future work should focus on developing algorithms and software to conduct multi-variable ana- lyses. Researchers and managers must also become more comfor- table and imaginative in working with the arrays of dynamic variables which will be needed to research and manage the systems involved.
Literature Cited
The variables in Tables l-3 may also be calculated using data for individual or key plant species or groups of species in the denomi- nators. Herbage growth, disappearance and accumulation on key areas may also be used in the denominators. All of these variables
Forrester, J.W. 1961. Industrial dynamics. MIT Press, Cambridge.
Hart, R.H. 1993. “Invisible colleges”and citation clusters in stocking rate research. J. Range Manage. 46:378-382.,
Gammon, D.M., and B.R. Roberts. 1978. Patterns of defoliation during continuous and rotational grazing of Matopos Sandveld of Rhodesia.
Rhod. J. Agr. Res. l&117-164.
110 JOURNAL OF RANGE MANAGEMENT 47(2), March 1994
Scarnecchin, D.L., and M.M. Kothmann. 1982. A dynamic approach to Scarnecchin, D.L., and C.T. Gaskins. 1987. Modeling animal-unitequivalents grazing management terminology. J. Range Manage. 35262-264. for beef cattle. Agr. Systems 23: 19-26.
Scarnecchia, D.L. 1985a. The relationship of stocking intensity and stock- Scarnecchia, D.L. 1988. Grazing, stocking and production efficiencies in ing pressure to other stocking variable. J. Range Manage. 38558-559. grazing research. J. Range Manage. 41:279-281.
Scarnecchia, D.L. 1985b. The animal-unit and animal-unit-equivalent Senft, R.H., and L.M. Tharel. 1989. Interactive effects of grazing systems concepts in range science. J. Range Manage. 38:346-349. variables on simulated cattle production and stocking rate of bermuda Scarnechia, D.L., and M.M. Kothmann. 1986. Observations on herbage grass (Cynodon dactylon). Agr. Systems 31:205-220.