Proceedings of the Workshop on Evaluation Metrics and System Comparison for Automatic Summarization, pages 1–9,
An Assessment of the Accuracy of Automatic Evaluation in Summarization
Karolina Owczarzak
Information Access Division
National Institute of Standards and Technology
John M. Conroy
IDA Center for Computing Sciences
Hoa Trang Dang
Information Access Division
National Institute of Standards and Technology
Ani Nenkova
University of Pennsylvania
Abstract
Automatic evaluation has greatly facilitated system development in summarization. At the same time, the use of automatic evaluation has been viewed with mistrust by many, as its accuracy and correct application are not well understood. In this paper we provide an as-sessment of the automatic evaluations used for multi-document summarization of news. We outline our recommendations about how any evaluation, manual or automatic, should be used to find statistically significant differences between summarization systems. We identify the reference automatic evaluation metrics— ROUGE 1 and 2—that appear to best emu-late human pyramid and responsiveness scores on four years of NIST evaluations. We then demonstrate the accuracy of these metrics in reproducing human judgements about the rel-ative content quality of pairs of systems and present an empirical assessment of the rela-tionship between statistically significant dif-ferences between systems according to man-ual evaluations, and the difference according to automatic evaluations. Finally, we present a case study of how new metrics should be com-pared to the reference evaluation, as we search for even more accurate automatic measures.
1 Introduction
Automatic evaluation of content selection in sum-marization, particularly the ROUGE evaluation toolkit (Lin and Hovy, 2003), has been enthusias-tically adopted by researchers since its introduction in 2003. It is now standardly used to report results in publications; however we have a poor understanding of the accuracy of automatic evaluation. How often
do we publish papers where we report an improve-ment according to automatic evaluation, but never-theless, a standard manual evaluation would have led us to different conclusions? In our work we directly address this question, and hope that our encouraging findings contribute to a better understanding of the strengths and shortcomings of automatic evaluation. The aim of this paper is to give a better assessment of the automatic evaluation metrics for content se-lection standardly used in summarization research. We perform our analyses on data from the 2008-2011 Text Analysis Conference (TAC)1 organized by the National Institute of Standards and Technol-ogy (NIST). We choose these datasets because in early evaluation initiatives, the protocol for manual evaluation changed from year to year in search of stable manual evaluation approaches (Over et al., 2007). Since 2008, however, the same evaluation protocol has been applied by NIST assessors and we consider it to be the model that automatic metrics need to emulate.
We start our discussion by briefly presenting the manual procedure for comparing systems (Section 2) and how these scores should be best used to iden-tify significant differences between systems over a given test set (Section 3). Then, we embark on our discussion of the accuracy of automatic evaluation and its ability to reproduce manual scoring.
To begin our analysis, we assess the accuracy of common variants of ROUGE on the TAC 2008-2011 datasets (Section 4.1). There are two aspects of eval-uation that we pay special attention to:
Significant difference Ideally, all system compar-isons should be performed using a test for
sta-1
tistical significance. As both manual metrics and automatic metrics are noisy, a statistical hypothesis test is needed to estimate the prob-ability that the differences observed are what would be expected if the systems are compa-rable in their performance. When this proba-bility is small (by convention 0.05 or less) we reject the null hypothesis that the systems’ per-formance is comparable.
It is important to know if scoring a system via an automatic metric will lead to conclusions about the relative merits of two systems differ-ent from what one would have concluded on the basis of manual evaluation. We report very en-couraging results, showing that automatic met-rics rarely contradict manual metmet-rics, and some metrics never lead to contradictions. For com-pleteness, given that most papers do not report significance, we also compare the agreement between manual and automatic metrics without taking significance into account.
Type of comparison Established manual evalua-tions have two highly desirable properties: (1) they can tell apart good automatic systems from bad automatic systems and (2) they can differ-entiate automatic summaries from those pro-duced by humans with high accuracy. Both properties are essential. Obviously, choosing the better system in development cycles is key in eventually improving overall performance. Being able to distinguish automatic from man-ual summaries is a general sanity test2that any evaluation adopted for wide use is expected to pass—it is useless to report system improve-ments when it appears that automatic methods are as good as human performance3. As we will see, there is no single ROUGE variant that has both of these desirable properties.
Finally, in Section 5, we discuss ways to compare other automatic evaluation protocols with the
refer-2
For now, automatic systems do not have the performance of humans, thus, the ability to distinguish between human and automatically generated summaries is an exemplar of the wider problem of distinguishing high quality summaries from others.
3
Such anomalous findings, when using automatic evalua-tion, have been reported for some summarization genres such as summarization of meetings (Galley, 2006).
ence ROUGE metrics we have established. We de-fine standard tests for significance that would iden-tify evaluations that are significantly more accurate than the current reference measures, thus warrant-ing wider adoption for future system development and reporting of results. As a case study we apply these to the TAC AESOP (Automatically Evaluating Summaries of Peers) task which called for the devel-opment of novel evaluation techniques that are more accurate than ROUGE evaluations.
2 Manual evaluation
Before automatic evaluation methods are developed, it is necessary to establish a desirable manual eval-uation which the automatic methods will need to re-produce. The type of summarization task must also be precisely specified—single- or multi-document summarization, summarization of news, meetings, academic articles, etc. Saying that an automatic evaluation correlates highly with human judgement in general, is disturbingly incomplete, as the same automatic metric can predict some manual evalu-ation scores for some summarizevalu-ation tasks well, while giving poor correlation with other manual scores for certain tasks (Lin, 2004; Liu and Liu, 2010).
In our work, we compare automatic metrics with the manual methods used at TAC: Pyramid and Re-sponsiveness. These manual metrics primarily aim to assess if the content of the summary is appro-priately chosen to include only important informa-tion. They do not deal directly with the linguistic quality of the summary—how grammatical are the sentences or how well the information in the sum-mary is organized. Subsequently, in the experiments that we present in later sections, we do not address the assessment of automatic evaluations of linguistic quality (Pitleret al., 2010), but instead analyze the performance of ROUGE and other related metrics that aim to score summary content.
across several human gold-standards is given higher weight when a summary is evaluated relative to the gold-standard. Each evaluated summary is assigned a score which indicates what fraction of the most important information for a given summary size is expressed in the summary, where importance is de-termined by the overlap in content across the human gold-standards.
The Responsiveness metric is defined for query-focused summarization, where the user’s informa-tion need is clearly stated in a short paragraph. In this situation, the human assessors are presented with the user query and a summary, and are asked to assign a score that reflects to what extent the sum-mary satisfies the user’s information need. There are no human gold-standards, and the linguistic quality of the summary is to some extent incorporated in the score, because information that is presented in a con-fusing manner may not be seen as relevant, while it could be interpreted by the assessor more easily in the presence of a human gold-standard. Given that all standard automatic evaluation procedures com-pare a summary with a set of human gold-standards, it is reasonable to expect that they will be more accu-rate in reproducing results from Pyramid evaluation than results from Responsiveness judgements.
3 Comparing systems
Evaluation metrics are used to determine the rela-tive quality of a summarization systemin compari-sonto one or more systems, which is either another automatic summarizer, or a human reference sum-marizer. Any evaluation procedure assigns a score to each summary. To identify which of the two sys-tems is better, we could simply average the scores of summaries produced by each system in the test set, and compare these averages. This approach is straightforward; however, it gives no indication of the statistical significance of the difference between the systems. In system development, engineers may be willing to adopt new changes only if they lead to significantly better performance that cannot be at-tributed to chance.
Therefore, in order to define more precisely what it means for a summarization system to be “bet-ter” than another for a given evaluation, we employ statistical hypothesis testing comparisons of
sum-marization systems on the same set of documents. Given an evaluation of two summarization systems
AandBwe have the following:
Definition 1. We say a summarizer A “signifi-cantly outperforms” summarizer B for a given evaluation score if the null hypothesis of the fol-lowing paired test is rejected with 95% confidence.
Given two vectors of evaluation scoresxandy, sampled from the corresponding random vari-ablesX andY,measuring the quality of sum-marizerAandB,respectively, on the same col-lection of document sets, with the median ofx greater than the median ofy,
H0 : The median ofX−Y is 0.
Ha : The median ofX−Y is not 0.
We apply this test using human evaluation met-rics, such as pyramid and responsiveness, as well as automatic metrics. Thus, when comparing two sum-marization systems we can, for example, say system
Asignificantly outperforms systemBin responsive-ness if the null hypothesis can be rejected. If the null hypothesis cannot be rejected, we say systemAdoes not significantly perform differently thansystemB.
A complicating factor when the differences be-tween systems are tested for significance, is that some inputs are simply much harder to summarize than others, and there is much variation in scores that is not due to properties of the summarizers that produced the summaries but rather properties of the input text that are summarized (Nenkova, 2005; Nenkova and Louis, 2008).
per-formance (Rankelet al., 2011). For this paper, we perform all testing using the Wilcoxon sign rank test.
4 How do we identify a good metric?
If we treat manual evaluation metrics as our gold standard, then we require that a good automatic met-ric mirrors the distinctions made by such a man-ual metric. An automatic metric for summarization evaluation should reliably predict how well a sum-marization system would perform relative to other summarizers if a human evaluation were performed on the summaries. An automatic metric would hope to answer the question:
Would summarizerAsignificantly outper-formsummarizer B when evaluated by a human?
We address this question by evaluating how well an automatic metric agrees with a human metric in its judgements in the following cases:
• all comparisons between different summariza-tion systems
• all comparisons between systems and human summarizers.
Depending on the application, we may record the counts of agreements and disagreements or we may normalize these counts to estimate the probability that an automatic evaluation metric will agree with a human evaluation metric.
4.1 Which is the best ROUGE variant
In this section, we set out to identify which of the most widely-used versions of ROUGE have highest accuracy in reproducing human judgements about the relative merits of pairs of systems. We exam-ine ROUGE-1, ROUGE-2 and ROUGE-SU4. For all experiments we use stemming and for each ver-sion we test scores produced both with and without removing stopwords. This corresponds to six differ-ent versions of ROUGE that we examine in detail.
ROUGE outputs several scores including preci-sion, recall, and an F-measure. However, the most informative score appears to be recall as reported when ROUGE was first introduced (Lin and Hovy, 2003). Given that in the data we work with, sum-maries are produced for a specified length in word
s (and all summaries are truncated to the predefined length), recall on the task does not allow for artifi-cially high scores which would result by producing a summary of excessive length.
The goal of our analysis is to identify which of the ROUGE variants is most accurate in correctly pre-dicting which of two participating systems is the bet-ter one according to the manual pyramid and respon-siveness scores. We use the data for topic-focused summarization from the TAC summarization track in 2008-20114.
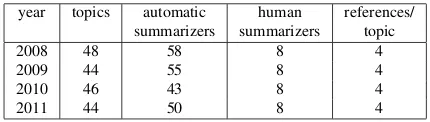
Table 1 gives the overview of the 2008-2011 TAC Summarization data, including the number of top-ics and participants. For each topic there were four reference (model) summaries, written by one of the eight assessors; as a result, there were eight human “summarizers,” but each produced summaries only for half of the topics.
year topics automatic human references/ summarizers summarizers topic
2008 48 58 8 4
2009 44 55 8 4
2010 46 43 8 4
[image:4.612.319.534.329.390.2]2011 44 50 8 4
Table 1: Data in TAC 2008-2011 Summarization track.
We compare each pair of participating systems based on the manual evaluation score. For each pair, we are interested in identifying the system that is better. We consider both the case when an appropri-ate test for statistical significance has been applied to pick out the better system as well as the case where simply the average scores of systems over the test set are compared. The latter use of evaluations is most common in research papers on summarization; how-ever, in summarization system development, testing for significance is important because a difference in summarizer scores that is statistically significant is much more likely to reflect a true difference in qual-ity between the two systems.
Therefore, we look at agreement between ROUGE and manual metrics in two ways:
• agreement about significant differences be-tween summarizers, according to a paired
4
Auto only Human-Automatic
Pyr Resp Pyr Resp
diff no diff contr diff no diff contr diff no diff contr diff no diff contr r1m 91 59 0.85 87 51 1.34 91 75 0.06 91 100 0.45 r1ms 90 59 0.83 84 50 3.01 91 75 0.06 90 100 0.45 r2m 91 68 0.19 88 60 0.47 75 75 0.62 75 100 1.02
r2ms 88 72 0 84 62 0.65 73 75 1.56 72 100 1.95
[image:5.612.123.491.69.159.2]r4m 91 64 0.62 87 56 0.91 82 75 0.43 82 100 0.83 r4ms 90 64 0.04 85 55 1.15 83 75 0.81 83 100 1.20
Table 2: Average percentage agreement between ROUGE and manual metrics about significant differences on TAC 2008-2011 data. r1= ROUGE-1,r2= ROUGE-2,r4= ROUGE-SU4,m= stemmed,s= stopwords removed;diff = agreement on significant differences,no diff = agreement on lack of significant differences,contr= contradictions.
Auto only Human-Automatic
Pyr Resp Pyr Resp
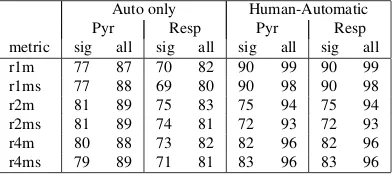
[image:5.612.209.405.214.301.2]metric sig all sig all sig all sig all r1m 77 87 70 82 90 99 90 99 r1ms 77 88 69 80 90 98 90 98 r2m 81 89 75 83 75 94 75 94 r2ms 81 89 74 81 72 93 72 93 r4m 80 88 73 82 82 96 82 96 r4ms 79 89 71 81 83 96 83 96
Table 3: Average agreement between ROUGE and manual metrics on TAC 2008-2011 data. r1= ROUGE-1,r2 = ROUGE-2,r4= ROUGE-SU4,m= stemmed,s= stopwords removed;sig= agreement on significant differences,all = agreement on all differences.
Wilcoxon test. No adjustments for multiple comparisons are made.
• agreement about any differences between sum-marizers (whether significant on not).
Agreements occur when the two evaluation met-rics make the same distinction between System A
and SystemB:Ais significantly better thanB, Ais significantly worse thanB,orAandB are not sig-nificantly different from each other. Contradictions occur when both metrics find a significant difference betweenAandB,but in opposite directions; this is a much more serious case than a mere lack of agree-ment (i.e., when one metric says A andB are not significantly different, and the other metric finds a significant difference).
Table 2 shows the average percentage agreement between ROUGE and Pyramid/Responsiveness when it comes to identifying significant differences or lack thereof. Column diff shows the recall of significant differences between pairs of systems (i.e., how many significant differences determined by Pyramid/Responsiveness are found by ROUGE); column no diff gives the recall of the cases where there are no significant differences between two sys-tems according to Pyramid/Responsiveness.
There are a few instances of contradictions, as well, but their numbers are fairly small. “Auto only” refers to comparisons between automatic summariz-ers only; “Human-Automatic” refsummariz-ers to cases when a human summarizer is compared to an automatic summarizer. There are fewer human summarizers, so there are fewer “Human-Automatic” comparisons than “Auto only” ones.
There are a few exceptional cases where the hu-man summarizer is not significantly better than the automatic summarizers, even according to the man-ual evaluation, which accounts for the uniform val-ues in the “no difference” column (this is proba-bly because the comparison is performed for much fewer test inputs).
tables we see that removing stopwords often de-creases performance of ROUGE, although not al-ways. Also, there is no clear winner in the ROUGE comparison: while ROUGE-2 with stemming is the best at distinguishing among automatic summariz-ers, ROUGE-1 is the most accurate when it comes to human–automatic comparisons. To reflect this, we adopt both ROUGE-1 and ROUGE-2 (with stem-ming, without removing stopwords) as our reference automatic metrics for further comparisons.
Reporting pairwise accuracy of automatic evalua-tion measures has several advantages over reporting correlations between manual and automatic metrics. In correlation analysis, we cannot obtain any sense of how accurate the measure is in identifying statis-tically significant differences. In addition, pairwise accuracy is more interpretable than correlations and gives some provisional indication about how likely it is that we are drawing a wrong conclusion when relying on automatic metric to report results.
Table 3 tells us that when statistical significance is not taken into account, in 89% of cases ROUGE-2 scores will lead to the same conclusion about the relative merits of systems as the expensive Pyramid evaluation. In 83% of cases the conclusions will agree with the Responsiveness evaluation. The accu-racy of identifying significant differences is worse, dropping by about 10% for both Pyramid and Re-sponsiveness.
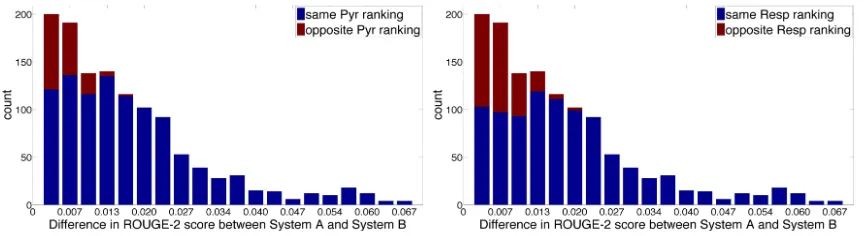
Finally, we would like to get empirical estimates of the relationship between the size of the difference in ROUGE-2 scores between two systems and the agreement between manual and ROUGE-2 evalua-tion. The goal is to check if it is the case that if one system scores higher than another byxROUGE points, then it would be safe to assume that a manual evaluation would have led to the same conclusion.
Figure 1 shows a histogram of differences in ROUGE-2 scores. The pairs for which this differ-ence was significant are given in red and for those where the difference is not significant are given in blue. The histogram clearly shows that in general, the size of improvement cannot be used to replace a test for significance. Even for small differences in ROUGE score (up to 0.007) there are about 15 pairs out of 200 for which the difference is in fact signif-icant according to Pyramid or Responsiveness. As the difference in ROUGE-2 scores between the two
systems increases, there are more significant ences. For differences greater than 0.05, all differ-ences are significant.
Figure 2 shows the histograms of differences in ROUGE-2 scores, split into cases where the pairwise ranking of systems according to ROUGE agrees with manual evaluation (blue) and disagrees (red). For score differences smaller than 0.013, about half of the times ROUGE-2 would be wrong in identify-ing which system in the pair is the better one accord-ing to manual evaluations. For larger differences the number of disagreements drops sharply. For this dataset, a difference in ROUGE-2 scores of more than 0.04 always corresponds to an improvement in the same direction according to the manual metrics.
5 Looking for better metrics
ROUGE-Figure 1: Histogram of the differences in ROUGE-2 score versus significant differences as determined by Pyramid (left) or Responsiveness (right).
Figure 2: Histogram of the differences in ROUGE-2 score versus differences as determined by Pyramid (left) or Responsiveness (right).
BE (the MINIPAR variant of ROUGE-BE), one of NIST’s baselines for AESOP, significantly outper-formed ROUGE-2 for predicting pyramid compar-isons; and 4 metrics: ROUGE-BE, DemokritosGR2, catholicasc1, and CLASSY1, all significantly out-perform ROUGE-2 for predictiong responsiveness comparisons. Descriptions of these metrics as well as the other proposed metrics can be found in the TAC 2011 proceedings (NIST, 2011).
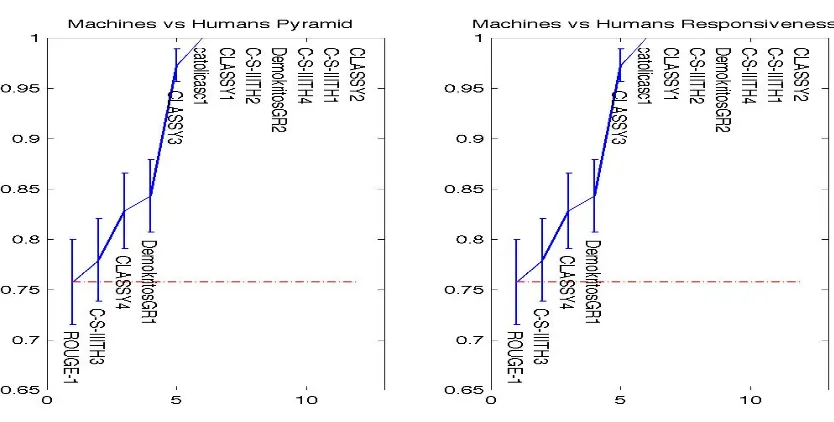
Similarly, Figure 4 gives the estimated probabil-ity when the comparison is made between human and machine summarizers. Here, 10 metrics are sig-nificantly better than ROUGE-1 in predicting com-parisons between automatic summarization systems and human summarizers in both pyramid and re-sponsiveness. The ROUGE-SU4 and ROUGE-BE baselines are not shown here but their performance was approximately 57% and 46% respectively.
If we limit the comparisons to only those where a significant difference was measured by Pyramid and also Overall Responsiveness, we get the plots given in Figure 5 for comparing automatic summa-rization systems. (The corresponding plot for
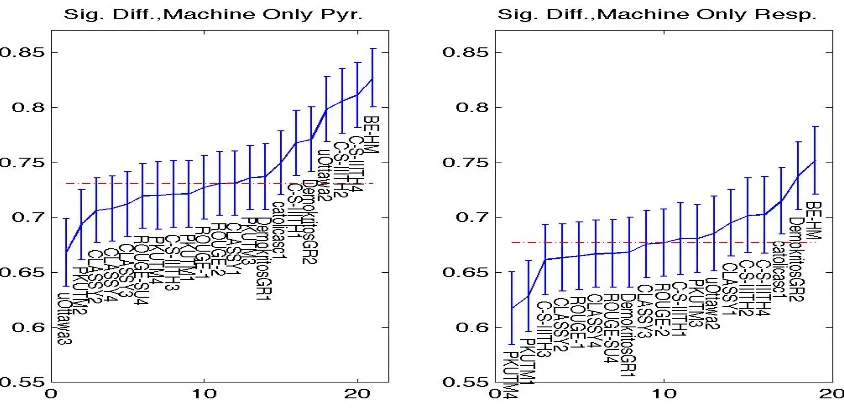
com-parisons between machines and humans is omitted as all differences are significant.) The results show that there are 6 metrics that are significantly better than ROUGE-2 for correctly predicting when a sig-nificant difference in pyramid scores occurs, and 3 metrics that are significantly better than ROUGE-2 for correctly predicting when a significant difference in responsiveness occurs.
6 Discussion
[image:7.612.93.525.231.349.2]Figure 3: Pyramid and Responsiveness Agreement of AESOP 2011 Metrics for automatic summarizers.
[image:8.612.114.531.438.649.2]Figure 5: Pyramid and Responsiveness Significant Difference Agreement of AESOP 2011 Metrics for automatic summarizers.
very good, others bad. We examine the size of dif-ference in ROUGE score and identify that for differ-ences less than 0.013 a large fraction of the conclu-sions drawn by automatic evaluation will contradict the conclusion drawn by a manual evaluation. Fu-ture studies should be more mindful of these find-ings when reporting results.
Finally, we compare several alternative automatic evaluation measures with the reference ROUGE variants. We discover that many new proposals are better than ROUGE in distinguishing human sum-maries from machine sumsum-maries, but most are the same or worse in evaluating systems. The Basic El-ements evaluation (ROUGE-BE) appears to be the strongest contender for an automatic evaluation to augment or replace the current reference.
References
Paul Over and Hoa Dang and Donna Harman. 2007. DUC in context. Inf. Process. Manage. 43(6), 1506– 1520.
Chin-Yew Lin and Eduard H. Hovy. 2003. Auto-matic Evaluation of Summaries Using N-gram Co-occurrence Statistics. Proceeding of HLT-NAACL.
Michel Galley. 2006. A Skip-Chain Conditional Ran-dom Field for Ranking Meeting Utterances by Impor-tance. Proceeding of EMNLP, 364–372.
Feifan Liu and Yang Liu. 2010. Exploring correlation between ROUGE and human evaluation on meeting summaries. Trans. Audio, Speech and Lang. Proc., 187–196.
C.Y. Lin. 2004. Looking for a Few Good Metrics: Au-tomatic Summarization Evaluation - How Many Sam-ples are Enough? Proceedings of the NTCIR Work-shop 4.
Ani Nenkova and Rebecca J. Passonneau and Kathleen McKeown. 2007. The Pyramid Method: Incorporat-ing human content selection variation in summariza-tion evaluasummariza-tion. TSLP 4(2).
Emily Pitler and Annie Louis and Ani Nenkova. 2010. Automatic Evaluation of Linguistic Quality in Multi-Document Summarization. Proceedings of ACL, 544– 554.
Ani Nenkova. 2005. Automatic Text Summarization of Newswire: Lessons Learned from the Document Un-derstanding Conference. AAAI, 1436–1441.
Ani Nenkova and Annie Louis. 2008. Can You Summa-rize This? Identifying Correlates of Input Difficulty for Multi-Document Summarization. ACL, 825–833. Peter Rankel and John M. Conroy and Eric Slud and
Di-anne P. O’Leary. 2011. Ranking Human and Machine Summarization Systems. Proceedings of EMNLP, 467–473.