Quantitative evaluation of competing syllable parses
Jason A. Shaw New York University/
Haskins Laboratories
New York, NY/New Haven, CT, USA
jason.shaw@nyu.edu
Adamantios I. Gafos New York University/ Haskins Laboratories
New York, NY/New Haven, CT, USA
adamantios.gafos@nyu.edu
Abstract
This paper develops computational tools for evaluating competing syllabic parses of a pho-nological string on the basis of temporal pat-terns in speech production data. This is done by constructing models linking syllable parses to patterns of coordination between articulato-ry events. Data simulated from different syl-labic parses are evaluated against experimental data from American English and Moroccan Arabic, two languages claimed to parse similar strings of segments into different syllabic structures. Results implicate a tautosyllabic parse of initial consonant clusters in English and a heterosyllabic parse of initial clusters in Arabic, in accordance with theoretical work on the syllable structure of these languages. It is further demonstrated that the model can cor-rectly diagnose syllable structure even when previously proposed phonetic heuristics for such structure do not clearly point to the cor-rect diagnosis.
1 Introduction
Languages are claimed to differ in how word-initial consonant clusters are parsed into higher level phonological structures. For example, Eng-lish (Kahn, 1976) and Georgian (Vogt, 1971) are claimed to parse initial clusters into complex syl-lable onsets. In contrast, Berber and Moroccan Arabic are claimed to parse initial clusters hete-rosyllabically, [#C.CV-], because the syllable structure of these languages allows at most one consonant (simplex onset) per syllable onset (Dell & Elmedlaoui, 2002).
Of direct relevance to these claims are patterns of temporal stability in the production of initial clusters. In those cases where speech production
data are available, languages that allow complex onsets exhibit patterns of temporal stability that differ from languages that allow only syllables with simplex syllable onsets.
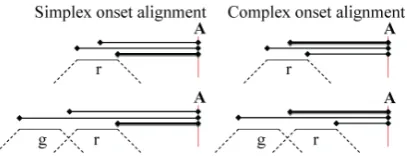
[image:1.595.307.511.468.548.2]These observed temporal differences have been quantified in terms of the relative stability of intervals as calculated across words beginning with one, two and three initial consonants (Browman & Goldstein, 1988; Byrd, 1995; Honorof & Browman, 1995; Shaw, Gafos, Hoole, & Zeroual, 2009). Figure 1 schematizes temporal differences between simplex and com-plex onsets. The figure shows three temporal in-tervals left-delimited by landmarks in the conso-nant cluster, the left edge of the cluster, the cen-ter of the cluscen-ter and the right edge of the cluscen-ter, and right-delimited by a common anchor point.
Figure 1. Schematic representation of three in-tervals, left edge to anchor, center to anchor and
right edge to anchor, delineated by points in an initial single consonant or consonant cluster and a common anchor (A). The alignment schema on the left/right represents experimentally observed temporal manifestations of the simplex/complex onset parse. Such patterns have been used as phonetic heuristics in diagnosing syllable
struc-ture in experimental data.
#CCVX words. In contrast, when clusters are parsed into a complex onset (Figure 1: right), the duration of the right edge to anchor interval shrinks to make room for the addition of a con-sonant to the syllable. Under this temporal alignment schema, the center to anchor interval remains more stable across #CVX and #CCVX words than both the right edge to anchor interval and the left edge to anchor interval.
Experimental results showing temporal pat-terns consistent with the schema on the right side of Figure 1 include Browman and Goldstein (1988), Honorof and Browman (1995), and Ma-rin and Pouplier (2008) on American English, Goldstein, Chitoran, & Selkirk (2007) on Geor-gian and Hermes, Grice, Muecke and Niemann (2008) on Italian. Results showing the temporal pattern on the left side of Figure 1 include Goldstein et al. (2007) on Berber, Shaw et al.
(2009) on Moroccan Arabic and Hermes et al.
(2008) on Italian.
We briefly review representative quantitative results illustrating the different temporal organi-zations in Figure 1. For a language with complex onsets, Browman and Goldstein (1988) show that the standard deviation calculated across English word sets such as pot~sot~spot~lot~plot~splot is smaller for the center to anchor interval, 15.8 ms, than for the left edge to anchor interval, 37.7 ms, and the right edge to anchor interval, 33.6 ms. In contrast, for a simplex onset language, Shaw et al. (2009) show that across similar Moroccan Arabic word sets, e.g., bati~sbati, the right edge to anchor interval has a lower standard deviation, 14 ms, than the center to anchor interval, 27 ms, and the left edge to anchor interval, 77 ms.
Although the experimental work reviewed above shows that stability comparisons among the right edge to anchor, center to anchor and left edge to anchor intervals can provide good heuris-tics for testing syllabification hypotheses in ex-perimental data, such heuristics stated in terms of inequalities are known to break down under some conditions. For example, simulations with a model reported in Shaw et al. (2009) demon-strated that when the overall variability in the intervals is high, the simplex onset parse can generate intervals exhibiting stability reversals
whereby the center to anchor interval is more stable than the right/left edge to anchor interval (contra the heuristic which states that the right edge to anchor interval should be the most stable; again, see Figure 1: left). This result indicates the frailty of phonetic heuristics in the form of in-equalities, e.g. a simplex onset parse implies that
the right edge to anchor interval is more stable than the center to anchor interval and the left edge to anchor interval. Such heuristics may be too coarse or even in some cases misleading in distinguishing competing syllabic parses using experimental data.
This paper advances a quantitative method for evaluating competing syllable parses that aims to improve on previously proposed phonetic heuris-tics and, by doing so, sharpen the interpretation of temporal stability patterns in terms of syllabic structure. In mediating between phonological theory and experimental data, the computational model makes it possible to discover syllabifica-tion rules from phonetic patterns. The model provides a new understanding of languages with known syllable structure and the analytical tools to deduce syllabification rules in less-studied languages.
2 Model
The general plan is to simulate data from models encoding competing syllabic parses, to quantify in the simulated data the pattern of stability in the intervals shown in Figure 1, and to evaluate the goodness of fit between the pattern of ty in the simulated data and the pattern of stabili-ty in experimental data. Our modeling paradigm capitalizes on structurally revealing temporal patterns in experimental data but improves on past work by modeling competing syllabic struc-tures (both simplex and complex onset parses of initial clusters) and replacing hypotheses stated in the form of inequalities with quantitative in-dices of goodness of fit between syllable parses and experimental data.
Given a string of consonants and vowels, e.g. CCV, the models map the simplex and complex onset parse of that string to distinct coordination topologies. The coordination topologies reflect the temporal relations underlying the segmental sequence (Gafos, 2002: p. 316). Differences in temporal structure at this level yield the distinct temporal alignment patterns schematized in Fig-ure 1.
number of preceding consonants. On a complex onset parse (Figure 2b) the vowel is aligned to the midpoint of the entire cluster of prevocalic consonants. These temporal alignment schemas have been proposed to underlie the experimental results we reviewed in Section 1.
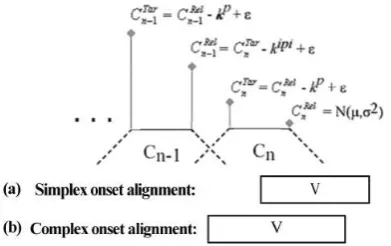
The model simulates the temporal organiza-tion of words with one, two, and sometimes three initial consonant clusters on the basis of a proba-bilistic interpretation of the temporal structure encoded in the syllable parse (simplex or com-plex). In addition, the model has three phonetic parameters, kp, kipi, and V, which determine, re-spectively, consonant plateau duration, the dura-tion between consonant plateaus, and vowel du-ration. These latter parameters can be set using estimates from the phonetic record.
As summarized in Figure 2, word simulation proceeds from the immediately prevocalic
con-sonant,
C
n . The timestamp of the release ofthis consonant,
C
nRel , is drawn from a Gaussiandistribution. The timestamp of the achievement of target of this consonant, CTarn , is determined by subtracting consonant plateau duration, kp,
from
C
nRel and adding an error term. Additionalprevocalic consonants, e.g. C1 in #C1C2V, are determined with reference to the immediately preceding consonant. For example, the
time-stamp of the release of
C
n-1 , el R nC
-1 , isdeter-mined by subtracting the inter-plateau interval,
kipi, from
C
nTar and adding a noise term. As notedabove, the alignment of the vowel relative to the prevocalic consonant(s) is dictated by the sylla-ble parse.
Once the temporal structure of the input seg-mental strings was generated, the stability of each target interval, the left edge to anchor, cen-ter to anchor and right edge to anchor incen-terval was calculated across words in the simulated da-ta. For these intervals, the offset of the vowel was used as the anchor point.
In light of past work indicating that phonetic heuristics for syllable structure may change as the level of variability in the data increases (Shaw et al., 2009), we also manipulated the va-riability of the simulated intervals. We did this by varying the standard deviation of the vowel offset (from 0 to 70 ms in 15 discrete 5 ms in-crements such that anchors 1, 2, 3…15 have a
standard deviation of 0 ms, 5 ms, 10 ms…70 ms,
[image:3.595.305.501.198.321.2]respectively). Since the vowel offset serves as an anchor in right-delimiting all of the measured intervals, increasing the standard deviation of this point is one way to increase the level of va-riability in all of the simulated intervals uniform-ly. This effectively allows the level of variability in simulated data to match the level of variability in experimental data.
Figure 2: Summary of word simulation in the model. Consonant landmarks are generated from the release of the immediately prevocalic
conso-nant. The alignment of the vowel is determined by the syllable parse (simplex or complex).
To sum up the central idea, the task of evaluat-ing syllable parses with experimental data has been formulated here as the task of fitting ab-stract coordination topologies to the experimen-tal data. This fitting can be expressed using two types of variables, coordination topologies and anchor variability. In the study of biological coordination and complex systems more general-ly, these two variables correspond respectively to the so-called essential and non-essential va-riables describing the behavior of complex sys-tems (Kugler, Kelso, & Turvey, 1980: p. 13).
Essential variables specify the qualitative form of the system under study. For us, this corres-ponds to the syllabic parse of the phonological string. The fundamental hypothesis entailed in positing an abstract phonological organization isomorphic to syllable structure is that a syllable parse is a macroscopic organization uniform across a variegated set of segmental identities,
lexical statistics and rate conditions, e.g. ‘plea’, ‘tree’, ‘glee’ are single syllables independent of
speech rate, frequency or phonotactic probability (see Catford 1977: p. 13 on ‘phonological
form’).
of factors has affected the intervals quantified. Taken together, then, these and other yet un-known factors have introduced noise in the inter-vals that will be measured. Therefore, in formu-lating the modeling problem of diagnosing sylla-ble structure in experimental data, we let varia-bility be one of the non-essential variables mani-pulated in the fitting process. The anchor offers a convenient location for introducing this variabili-ty into the intervals. In the discussion that fol-lows, the non-essential variable of anchor index will be used to refer to the amount of variability introduced into the intervals through the anchor.
3 Syllable parse evaluation
Our models allow syllabic parses of the same string to be compared directly and evaluated quantitatively by determining which parse results in a better fit to the data.
As an index of interval stability, we employ the relative standard deviation of the three inter-vals shown in Figure 1, calculated across sets of words with one, two, and sometimes three initial consonants. Relative standard deviation, hence-forth RSD, is calculated by dividing the standard deviation of an interval by its mean duration. Substantive reasons for using RSD as a depen-dent variable and not the standard deviation or mean duration of the intervals are described, re-spectively, in Shaw et al. (2009: p. 203) and Shaw (2010: p. 111-112).
Model performance was evaluated on the basis of two test statistics: the R2 statistic and the F
statistic. The R2 statistic provides a measure of
goodness of fit capable of detecting gradient im-provement (or degradation) in model perfor-mance as a function of parameter values. The F
statistic, on the other hand, is used to evaluate model performance in the following way. Hits or
misses for each pairing of simulated RSDs and data RSDs will be determined based upon p val-ues generated from the F statistic. The criterion of p < .01 will be interpreted as successful rejec-tion of the null hypothesis (that the RSD of all intervals is equal) and constitute a hit while fail-ure to reject the null hypothesis constitutes a
miss. This method of interpreting the F statistic provides a direct way to evaluate model perfor-mance for each run of the simulation. Across multiple runs of the simulation, the ratio of hits to total runs (hits + misses) provides a hit rate
which summarizes the performance of a syllable parse in matching the experimental data.
This method of model evaluation has a con-ceptual antecedent in other work in probabilistic grammar. The hit rate as described above plays a similar role in model evaluation as the confi-dence scores employed in Albright and Hayes (2003). The probabilistic rules of English past tense formation developed in that paper are asso-ciated with a reliability index. Albright and Hayes (2003) refer to this as a raw confidence
score. The raw confidence score of a rule is the likelihood that the rule applies when its envi-ronment is met. The score is the ratio of the number of times that a particular rule applies,
hits, by the number of times in which the envi-ronment for the rule is present in the data, the
rule’s scope. For example, the rule for the Eng-lish past tense [ɪ] à [ʌ]/ {l,r}___ŋ correctly de-rives forms such as sprung from spring and flung
from fling, but makes the wrong prediction,
brung and not brought, for bring. Of the 4253 verbs employed in the Albright and Hayes (2003) learning set, the environment of the
spring-sprung rule occurs 9 times and the rule applies correctly in 6 of those cases yielding a raw confidence score of .667. In contrast, the most general rule for the English past tense Æà d / X ____ has a scope identical to the size of the data set, 4253, and applies in 4034 cases yielding a raw confidence score of .949. In the case at hand, that of syllable structure, the hit rate pro-posed above plays a similar role to that of the confidence score. It provides a simple statistic summarizing the fit of a syllable parse to data.
The value of the non-essential variable (anc-hor index) that maximizes the R2 statistic is also informative in evaluating syllable structure. When the syllable parse is correct, then large amounts of noise added to the intervals may be harmful, pushing the model output away from patterns dictated by the essential variable. On the other hand, when the syllable parse is wrong, then increases in noise may improve model per-formance by pushing the intervals in the direc-tion of the correct syllable parse on some trials. Since noise is inserted into the intervals through the anchor, comparing the anchor indices that maximize R2 may be informative in evaluating syllable parses. A lower anchor index indicates a better-fitting syllable parse.
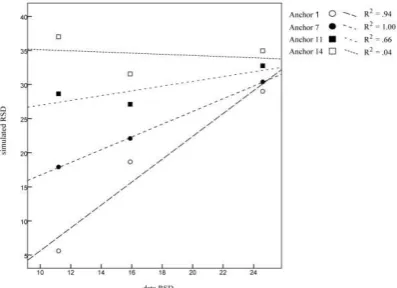
fitting a regression line to these coordinates us-ing the least squares method. A representative plot is shown in Figure 3. The x-axis shows the RSD of the three intervals of interest for the bul-ha~sbulha~ksbulha triad as reported in Shaw et al. (2009). These are plotted against RSDs simu-lated by the model given a simplex onset parse and different levels of anchor variability. For simplicity in presentation, just four of the fifteen anchors simulated are shown in the figure. The standard deviation of these representative anc-hors is as follows: anchor 1 = 0 ms, anchor 7 = 30 ms, anchor 11 = 50 ms, and anchor 14 = 65 ms.
Figure 3 shows that R2 is highest when the simplex onset parse is paired with anchor 7. At this level of anchor variability, the simplex onset parse provides a perfect fit to the data. At both lower (anchor 1) and higher (anchor 11) levels of anchor variability, the fit to the data is degraded.
Figure 3. Fit between model and data. The RSD of three intervals in the data (x-axis) are plotted against the RSD of simulated intervals (y-axis) at
different levels of anchor variability (anchor 1, anchor 7, anchor 11, anchor 14).
As illustrated in Figure 3, model performance is assessed by calculating the regression line on the basis of all three measured intervals at once. In doing so, the regression line captures the rela-tionship between different measured intervals, or the pattern of interval stability. Since it is not the absolute value of the RSD of an interval but ra-ther the relations between the RSDs of different intervals that is of theoretical interest, this is an important aspect of the fitting procedure.
For simulations reported below, the phonetic parameters discussed around Figure 2 are based on typical values for the languages under consid-eration. For American English, the values of these parameters used in the simulations were: kp
= 45 ms; kipi = 0 ms, and V = 230 ms. The error term, e, associated with each consonantal land-mark has a standard deviation of 14 ms. For Mo-roccan Arabic, the parameter values were: kp = 42 ms; kipi = 66 ms, V = 196 ms. The error term was set to 20 ms. The results below are based on 1000 runs of the simulation for each word set.
4 Results
The simpex and complex onset parses were eva-luated against three corpora using the procedure described above. The first two corpora are re-ported in Browman and Goldstein (1988) and Shaw et al. (2009) and provide relevant data on American English and Moroccan Arabic, respec-tively. Each of these studies reports articulatory data on just one speaker. The third corpus is a subset of the Wisconsin X-ray Microbeam Speech Production Database (Westbury, 1994). The sample analyzed here contains data from thirty-three speakers of American English.
4.1 American English (single speaker)
Our first American English data set draws from work of Browman and Goldstein (1988) which provides measurements of the stability of three relevant temporal intervals, left edge to anchor, right edge to anchor, and center to anchor, calcu-lated over the following word set: [pɔt], [sɔt], [lɔt], [spɔt], [splɔt], [plɔt]. Interval stability was reported in terms of the standard deviation of each interval calculated across the word set.
In order to make these results directly compa-rable to those for Moroccan Arabic to be dis-cussed in the next section, the relative standard deviation (RSD) of the English productions was calculated by dividing the standard deviation of each interval by the mean of that interval. Al-though Browman and Goldstein (1988) do not report the mean duration of the intervals, they provide a figure for each word and a scale (1 cm = 135 ms) for the figures allowing the relevant intervals to be measured. For each word, the du-ration of the three intervals of interest was meas-ured from the figure and the standard deviation of the intervals was calculated across words. The resulting RSD values are shown in Table 1.
[image:5.595.88.287.342.486.2]each of three word types, i.e., words beginning with one, two and three initial consonants. These words are generated based on a value for the es-sential variable (syllable structure) and a range of values of the non-essential variable (anchor in-dex).
pot~sot~spot lot~plot~splot
Interval statistics
LE-A CC-A RE-A
mean 267 197 146
SD 37.7 15.8 33.6
[image:6.595.93.293.175.237.2]RSD 14.0% 8.0% 23.0%
Table 1: The mean, standard deviation, and rela-tive standard deviation of three intervals, left edge to anchor (LE-A), center to anchor (CC-A),
right edge to anchor (RE-A), calculated across productions of pot, sot, spot, lot, plot, and splot
by one speaker of American English.
The hit rate for the complex onset parse was 95.5% compared to just 57.7% for the simplex onset parse. This indicates that the complex onset parse provides a better fit to this data than the simplex onset parse. Moreover, the anchor index that maximizes R2 for the complex onset parse is lower (anchor 3) than for the simplex parse (anc-hor 12). This further indicates that the complex onset parse outperforms the simplex onset parse on this data.
4.2 Moroccan Arabic (single speaker)
The results above indicate that the complex onset parse provides a better fit to the English data than the simplex onset parse. This section eva-luates Moroccan Arabic data against these same syllabic parses. The data come from Shaw et al.
(2009) which reports the RSD of the intervals of interest for seven word sets containing dyads or triads differing only in the number of initial con-sonants, e.g. bulha~sbulha~ksbulha. The word sets and the reported RSD of the intervals are summarized in Table 2.
For each word set, the model simulated cor-responding word types. That is, for triads, e.g.,
bulha~sbulha~ksbulha, the model simulated 10 repetitions of words beginning with one, two, and three initial consonants, and, for dyads, e.g.
tab~ktab, 10 repetitions of words beginning with one and two consonants. The model simulated word sets under each of the competing syllabic parses and evaluated the fit of each syllabic parse to the experimental data.
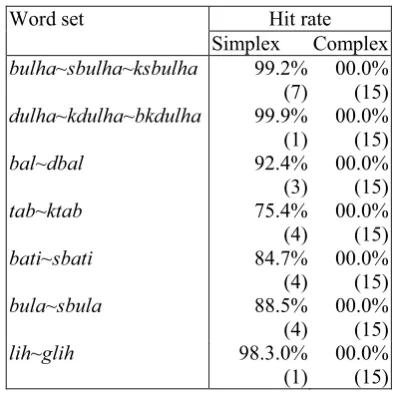
The resulting hit rates are summarized in Ta-ble 3. For each of the target word sets, the
simp-lex onset parse shows a clear advantage in fitting the data. Hit rates for the simplex parse are above 75.4% in all cases and the hit rate for the com-plex onset parse never rises above 00.0%. More-over, the anchor indices that maximize R2for the simplex onset parse are low, ranging from anchor 1 to anchor 7. For the complex onset parse, the highest variability anchor (anchor 15) provides the best fit to the data in all cases.
Word set Interval RSD
LE-A CC-A RE-A
bulha~sbulha~ksbulha 24.6% 15.9% 11.2%
dulha~kdulha~bkdulha 22.2% 17.7% 10.7%
bal~dbal 20.5 9.7% 5.1%
tab~ktab 6.8% 5.7% 5.5%
bati~sbati 20.9% 9.1% 5.8%
bula~sbula 22.0% 11.1% 7.3%
[image:6.595.312.513.209.324.2]lih~glih 18.5% 10.7% 2.7%
Table 2. Relative standard deviation of three in-tervals, left edge to anchor (LE-A), center to anchor (CC-A), right edge to anchor (RE-A)
cal-culated across productions of word sets by one native speaker of Moroccan Arabic.
Word set Hit rate
Simplex Complex
bulha~sbulha~ksbulha 99.2% 00.0%
dulha~kdulha~bkdulha
bal~dbal
tab~ktab
bati~sbati
bula~sbula
(7) 99.9% (1) 92.4% (3) 75.4% (4) 84.7% (4) 88.5% (4)
(15) 00.0% (15) 00.0% (15) 00.0% (15) 00.0% (15) 00.0% (15)
lih~glih 98.3.0%
(1)
00.0% (15)
Table 3. Hit rate for each syllable parse when evaluated against various Moroccan Arabic word
sets. The anchor index that maximized R2 for each syllable parse is given in parenthesis.
[image:6.595.311.508.400.599.2]Each of the data sets evaluated thus far were contributed by a single speaker. In these data the patterns of interval stability clearly reveal tem-poral organization in terms of syllables. To eva-luate whether the model continues to distinguish syllabic parses when phonetic heuristics break down, we now turn to a corpus of less controlled stimuli from multiple speakers with a high de-gree of inter-speaker variability.
4.3 American English (multi-speaker data)
Under some conditions, stability-based phonetic heuristics break down as reliable indicators of syllable structure. This is known to occur, for example, when the level of overall variability in the intervals is high (Shaw et al., 2009).
In controlled experimental studies, as can be seen in Figure 1, neither of the two syllabic parses, simplex or complex, has been observed to show the left edge to anchor interval as more stable than the center to anchor and right edge to anchor intervals. At high levels of variability, however, the probabilistic model developed in our work can produce patterns whereby the left edge to anchor interval is more stable than the other two intervals. This occurs regardless of the syllable parse when the anchor index is high (e.g. 15), which represents a high degree of variability in the intervals (the reason why high interval va-riability results in this pattern is explained in Shaw et al. 2009). Under these conditions of high variability, both values of the essential vari-able (simplex and complex onset parses) gener-ate a pattern whereby the left edge to anchor in-terval has a lower RSD than the center to anchor interval and the right edge to anchor interval. Thus, at this level of variability, stability-based phonetic heuristics, i.e., center to anchor stability implies a complex onset parse, are rendered inef-fective in distinguishing syllabic parses.
When variability leads competing syllable parses to the same predictions in terms of inequa-lities (both models show left edge to anchor sta-bility), is our modeling paradigm still capable of distinguishing syllabic parses? To address this question, we need a corpus with the requisite level of variability.
The Wisconsin X-ray Microbeam Speech Pro-duction Database provides recordings of a varie-ty of tasks including production of sentences, passages and word lists from fifty-seven speakers of American English (Westbury, 1994). Al-though not all speakers completed all tasks and some tokens have missing data which make them unusable for this analysis, it remains an archive
of articulatory data that is extremely impressive in size. Within this archive there are various near-minimal pairs that can be used to evaluate syllable structure using the methods employed above. Here we report on thirty-three speakers’
productions of the dyad row~grows. Calculating interval stability across multiple speaker samples of this word dyad is one way to introduce varia-bility into the intervals and, by doing so, provide an interesting test case for our proposed methods.
The target word row was produced in the sen-tence Things in a row provide a sense of order.
This sentence is one of several unrelated sen-tences included in Task #60 within the X-ray microbeam corpus. The word grows was pro-duced in the sentence That noise problem grows
more annoying each day, which is included in Task #56. Although these target words were pro-duced in different syntactic frames and occur in different phrasal positions, we assume, following standard phonological assumptions, that all in-stances of /gr/ and /r/ were syllabified identically, namely, that they are parsed into complex sylla-ble onsets. To test this assumption, we ask whether the models converge on the same result.
In all respects except for the determination of the anchor point, the quantification of the X-ray microbeam data followed the same procedure described for Electromagnetic Articulometry da-ta in Shaw et al. (2009). To determine the anchor point, we followed past work on English (Brow-man and Goldstein 1988, Honorof and Brow(Brow-man 1995) by using an acoustic landmark, the offset of voicing in the vowel, as the anchor point right-delimiting the intervals of interest. This was done for the following reason. The target words in this case are not matched at the right edge of the syl-lable (grows ends in s while row ends in a vowel) and this makes it difficult to determine a com-mon articulatory anchor across words. The arti-culatory landmarks that left-delimit the intervals of interest were the same as for the English and Arabic data discussed above.
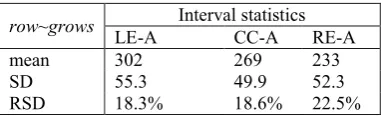
In this data the RSD of the left edge to anchor interval is lower than the RSD of both the center to anchor and right edge to anchor intervals. From the perspective of phonetic heuristics of syllable structure, this fact by itself is not par-ticularly revealing. Both syllabic parses predict-this should be the case at very high levels of va-riability. This data set therefore provides a chal-lenge to phonetic heuristics stated in the form of directional inequalities and an appropriate test of the quantitative methods developed here.
row~grows Interval statistics
LE-A CC-A RE-A
mean 302 269 233
SD 55.3 49.9 52.3
[image:8.595.92.283.233.291.2]RSD 18.3% 18.6% 22.5%
Table 4. Mean, standard deviation, and relative standard deviation of three intervals, left edge to
anchor (LE-A), center to anchor (CC-A), right edge to anchor (RE-A), calculated across
produc-tions of row and grows by thirty-three speakers of American English
Simulations with the simplex and complex on-set models generated RSD values that were fitted to the RSD values of the three intervals of inter-est in the English row~grows data. On each run, the model simulated 10 repetitions of words be-ginning with one and two consonants. The same values of the constants used for the other English simulations were employed here as well, and the same range of anchor variability was produced for each parse. Anchor 1 has a standard deviation of zero and the standard deviation of each subse-quent anchor increases by 5 ms so that anchor 15 has a standard deviation of 70 ms. Table 5 re-ports the results of 1000 runs of the simulation.
Word set Hit rate
Simplex Complex
row~grows 91.8% 99.0%
(11) (6)
Table 5: Hit rate for each syllable parse when evaluated against the English dyad row~grows.
The anchor index that maximized R2 for each syllable parse is given in parenthesis.
The results of the model fitting reveal that the complex onset parse provides a superior fit to the data. The complex onset parse achieves a higher hit rate (99.0% vs. 91.8%) with a less variable anchor (anchor 6 vs. anchor 11) than the simplex
onset parse. This result demonstrates that the model can distinguish syllabic parses even in noisy data contributed by multiple speakers.
Since the target words, row and grows, were produced in different environments, there are potentially a number of interacting factors in-fluencing the pattern of temporal stability in the data. A model incorporating, for example, pro-sodic structure above the level of the syllable may identify interactions between syllable and higher levels of prosodic structure. We plan to explore models of this sort in future work. It re-mains an important result of the current model that competing parses of a given string can be distinguished in the data even at levels of varia-bility that obscure phonetic heuristics for syllable structure.
5 Conclusion
There is a growing body of evidence indicating that the temporal dimension provides a rich source of information revealing phonological structure. In the domain syllables, the relation between temporal patterns in experimental data and qualitative aspects of phonological structure has often taken the form of statements expressing inequalities, e.g., a complex onset parse implies that the center to anchor interval is more stable than the right/left edge to anchor intervals. Pho-netic heuristics of this sort are valid only under certain conditions. The models developed in this paper generate finer-grained quantitative predic-tions of syllabic structure based on a probabilis-tic interpretation of temporal organization. Our models make predictions not just about stability inequalities but also about the permissible degree
to which interval stabilities may differ from one another under a given syllable parse. Crucially, these predictions allow for evaluation of compet-ing syllable parses even when statements in the form of inequalities do not.
As the phonological literature is replete with debates regarding the syllabification of conso-nant clusters, the tools developed here have im-mediate application. They allow rigorous evalua-tion of syllable structure on the basis of experi-mental data.
Acknowledgments
[image:8.595.92.287.564.614.2]References
Albright, A., & Hayes, B. (2003). Rules vs. analogy in English past tenses: a computational/experimental study. Cognition, 90, 119-161.
Browman, C. P., & Goldstein, L. (1988). Some Notes on Syllable Structure in Articulatory Phonology. Phonetica, 45, 140-155.
Byrd, D. (1995). C-centers revisited. Phonetica, 52, 285-306.
Catford, J. C. (1977). Fundamental Problems in Phonetics. Bloomington: Indiana University Press.
Dell, F., & Elmedlaoui, M. (2002). Syllables in Tashlhiyt Berber and in Moroccan Arabic. Dordrecht, Netherlands, and Boston, MA: Kluwer Academic Publishers.
Gafos, A. (2002). A grammar of gestural coordination. Natural Language and Linguistic Theory, 20, 269-337.
Goldstein, L. M., Chitoran, I., & Selkirk, E. (2007). Syllable structure as coupled oscillator modes: evidence from Georgian vs. Tashlhiyt Berber. Proceedings of the XVIth International Congress of Phonetic Sciences, 241-244, Saabrucken, Germany.
Hermes, A., Grice, M., Muecke, D., & Niemann, H. (2008). Articulatory indicators of syllable affiliation in word initial consonant clusters in Italian. In R. Stock, S. Fuchs & Y. Laprie (Eds.), Proceedings of the 8th International Seminar on Speech Production, 433-436, Strasbourg, France.
Honorof, D., & Browman, C. (1995). The center or the edge: how are consonant clusters organised with respect to the vowel? In K. Elenius & P. Branderud (Eds.), Proceedings of the XIIIth International Congress of Phonetic Sciences Vol. 3, 552-555, Stockholm, Sweden.
Kahn, D. (1976). Syllable-based generalizations in English phonology. Unpublished Ph.D. Dissertation, MIT, Cambridge, MA.
Kugler, P. N., Kelso, J. A. S., & Turvey, M. T. (1980). On the concept of coordinative structures as dissipative structures: I. Theoretical lines of convergence. In G. E. Stelmach & J. Requin (Eds.), Tutorials in Motor Behavior (p. 3-47): North-Holland Publishing Company.
Marin, S., & Pouplier, M. (2008). Organization of complex onsets and codas in American English: Evidence for a competitive coupling model. In R. Sock, S. Fuchs & Y. Laprie
(Eds.), Proceedings of the 8th International Seminar of Speech Production, 437-440, Strasbourg, France.
Shaw, J. A. (2010). The temporal organization of syllabic structure. Unpublished Ph.D. Dissertation, NYU, New York, NY.
Shaw, J. A., Gafos, A., Hoole, P., & Zeroual, C. (2009). Syllabification in Moroccan Arabic: evidence from patterns of temporal stability in articulation. Phonology, 26, 187-215.
Vogt, H. (Ed.). (1971). Grammaire de la langue Géorgienne. Oslo: Universitetsforlaget.