z
RESEARCH ARTICLE
ANALYSIS OF GENETIC VARIABILITY AND AGROINDUSTRIAL CHARACTERISTICS IN SUGARCANE
1,*Luiz Sérgio Costa Duarte Filho,
1Edson Ferreira da Silva,
2
Geraldo Veríssimo de Souza Barbosa,
2Carlos Assis Diniz,
2JosealdoTonholo,
2Cícero Carlos de Souza Almeida and
3José Antônio Bressiani
1
PopulationGeneticsLaboratory, Department of Agronomy, Genetic improvement of plants, University Federal
Rural of Pernambuco, Rua Manoel de Medeiros, s/n – Dois Irmãos 52171-900 Recife, Pernambuco, Brazil
2
University Federal of Alagoas, Av. Lourival Melo Mota, s/n - Tabuleiro dos Martins 57072-900 Maceió,
Alagoas, Brazil
3
GranBio – Bio Vertis Experimental Station, Farm Andorinha, Rod-AL 220 s/n, KM 6, 5,
57180-000 São Miguel dos Campos, Alagoas, Brazil
ARTICLE INFO ABSTRACT
Brazil is the world's largest producer of sugar and ethanol in sugarcane, and genetic improvement was essential for raising agroindustrial yields, providing gains of 1% to 2% per year. The objective of this work was to evaluate the main genotypes grown in Alagoas-Brazil from 1975 to 2010 in a competition experiment conducted between February 2012 and February 2013 at the Sinimbu-Alagoas Plant, adopting the following statistical-genetic procedures: estimates of averages and grouping of cultivars for agroindustrial characteristics; estimates of genetic parameters of agroindustrial characteristics; evaluation of the levels of genetic diversity of the cultivars through microsatellite molecular markers and recommendation of genetic crosses among the studied cultivars. The experimental design was in randomized blocks, with four replications. The plot was composed of three double lines of seven meters, spaced at 1,50 m x 0,80 m. The cultivars that showed the highest sugar yields were RB92579, RB867515, RB99395 and RB951541; the highest estimates of heritability and ratio between the genetic/environmental variance coefficients were for the BRIX, POL, TPH and TCH characteristics, indicating that it is very probable to obtain gains in the selection of superior individuals in these characteristics, performing genetic crosses with the genotypes evaluated in this study; The microsatellite primers SSR05, SSR06 and SSR93 were efficient in determining unique genetic profiles and in discriminating degree of kinship and genetic diversity; the crosses that can predict higher gains in sugar yield are from cultivar RB92579 with cultivars RB867515, RB931003, RB931011, RB951541, RB98710 and RB99395.
Copyright©2017, Luiz Sérgio Costa Duarte Filho et al., This is an open access article distributed under the Creative Commons Attribution License, which permits
unrestricted use, distribution, and reproduction in any medium, provided the original work is properly cited.
INTRODUCTION
The main product derived from sugarcane is sugar, essential human food and basic consumption, being a commodity produced worldwide. In addition to traditional sugar, sugarcane is a raw material for ethanol production - used as an automotive fuel, in the production of beverages and for pharmaceutical purposes - and in the production of electricity through the burning of bagasse.
*Corresponding author: Luiz Sérgio Costa Duarte Filho,
PopulationGeneticsLaboratory, Department of Agronomy, Genetic improvement of plants, University Federal Rural of Pernambuco, Rua Manoel de Medeiros, s/n–Dois Irmãos 52171-900 Recife,
Pernambuco, Brazil.
Brazil is the world's largest producer and exporter of sugar from sugarcane, and has significant economic importance from the colonial period to the present day. This sector occupied in the 2015/2016 harvest, a harvested area of 9.1 million hectares, equivalent to 3.1% of the country's cultivated soils, and generated income of US $ 7 billion, with US $ 3.2 billion Obtained in sales abroad, in Alagoas the harvested area was 322.2 thousand hectares with production of 16.1 million tons of sugarcane, which represented 2.4% of the total Brazilian production (CONAB, 2017; UDOP, 2017). In this context, the genetic improvement of sugarcane was fundamental, mainly due to the increase in agroindustrial yields, with gains of 1 to 2% per year (Barbosa et al., 2012). In Alagoas, in the 1975/1976 harvest, the average agricultural yield was 36.5 tons
ISSN: 0975-833X
International Journal of Current Research
Vol. 9, Issue, 10, pp.58483-58491, October, 2017
INTERNATIONAL JOURNAL OF CURRENT RESEARCH
Article History: Received 07thJuly, 2017 Received in revised form 23rdAugust, 2017
Accepted 27thSeptember, 2017
Published online 17thOctober, 2017
Citation: Luiz Sérgio Costa Duarte Filho, Edson Ferreira da Silva, Geraldo Veríssimo de Souza Barbosa, Carlos Assis Diniz, JosealdoTonholo, Cícero Carlos de Souza Almeida and José Antônio Bressiani, 2017.“Analysis of genetic variability and agroindustrial characteristics in sugarcane”, International Journal of Current Research, 9, (10), 58483-58491.
Available online at http://www.journalcra.com
Key words: Sugarcane, Genetic parameters, Genetic diversity, Microsatellites. z
RESEARCH ARTICLE
ANALYSIS OF GENETIC VARIABILITY AND AGROINDUSTRIAL CHARACTERISTICS IN SUGARCANE
1,*Luiz Sérgio Costa Duarte Filho,
1Edson Ferreira da Silva,
2
Geraldo Veríssimo de Souza Barbosa,
2Carlos Assis Diniz,
2JosealdoTonholo,
2Cícero Carlos de Souza Almeida and
3José Antônio Bressiani
1
PopulationGeneticsLaboratory, Department of Agronomy, Genetic improvement of plants, University Federal
Rural of Pernambuco, Rua Manoel de Medeiros, s/n – Dois Irmãos 52171-900 Recife, Pernambuco, Brazil
2
University Federal of Alagoas, Av. Lourival Melo Mota, s/n - Tabuleiro dos Martins 57072-900 Maceió,
Alagoas, Brazil
3
GranBio – Bio Vertis Experimental Station, Farm Andorinha, Rod-AL 220 s/n, KM 6, 5,
57180-000 São Miguel dos Campos, Alagoas, Brazil
ARTICLE INFO ABSTRACT
Brazil is the world's largest producer of sugar and ethanol in sugarcane, and genetic improvement was essential for raising agroindustrial yields, providing gains of 1% to 2% per year. The objective of this work was to evaluate the main genotypes grown in Alagoas-Brazil from 1975 to 2010 in a competition experiment conducted between February 2012 and February 2013 at the Sinimbu-Alagoas Plant, adopting the following statistical-genetic procedures: estimates of averages and grouping of cultivars for agroindustrial characteristics; estimates of genetic parameters of agroindustrial characteristics; evaluation of the levels of genetic diversity of the cultivars through microsatellite molecular markers and recommendation of genetic crosses among the studied cultivars. The experimental design was in randomized blocks, with four replications. The plot was composed of three double lines of seven meters, spaced at 1,50 m x 0,80 m. The cultivars that showed the highest sugar yields were RB92579, RB867515, RB99395 and RB951541; the highest estimates of heritability and ratio between the genetic/environmental variance coefficients were for the BRIX, POL, TPH and TCH characteristics, indicating that it is very probable to obtain gains in the selection of superior individuals in these characteristics, performing genetic crosses with the genotypes evaluated in this study; The microsatellite primers SSR05, SSR06 and SSR93 were efficient in determining unique genetic profiles and in discriminating degree of kinship and genetic diversity; the crosses that can predict higher gains in sugar yield are from cultivar RB92579 with cultivars RB867515, RB931003, RB931011, RB951541, RB98710 and RB99395.
Copyright©2017, Luiz Sérgio Costa Duarte Filho et al., This is an open access article distributed under the Creative Commons Attribution License, which permits
unrestricted use, distribution, and reproduction in any medium, provided the original work is properly cited.
INTRODUCTION
The main product derived from sugarcane is sugar, essential human food and basic consumption, being a commodity produced worldwide. In addition to traditional sugar, sugarcane is a raw material for ethanol production - used as an automotive fuel, in the production of beverages and for pharmaceutical purposes - and in the production of electricity through the burning of bagasse.
*Corresponding author: Luiz Sérgio Costa Duarte Filho,
PopulationGeneticsLaboratory, Department of Agronomy, Genetic improvement of plants, University Federal Rural of Pernambuco, Rua Manoel de Medeiros, s/n–Dois Irmãos 52171-900 Recife,
Pernambuco, Brazil.
Brazil is the world's largest producer and exporter of sugar from sugarcane, and has significant economic importance from the colonial period to the present day. This sector occupied in the 2015/2016 harvest, a harvested area of 9.1 million hectares, equivalent to 3.1% of the country's cultivated soils, and generated income of US $ 7 billion, with US $ 3.2 billion Obtained in sales abroad, in Alagoas the harvested area was 322.2 thousand hectares with production of 16.1 million tons of sugarcane, which represented 2.4% of the total Brazilian production (CONAB, 2017; UDOP, 2017). In this context, the genetic improvement of sugarcane was fundamental, mainly due to the increase in agroindustrial yields, with gains of 1 to 2% per year (Barbosa et al., 2012). In Alagoas, in the 1975/1976 harvest, the average agricultural yield was 36.5 tons
ISSN: 0975-833X
International Journal of Current Research
Vol. 9, Issue, 10, pp.58483-58491, October, 2017
INTERNATIONAL JOURNAL OF CURRENT RESEARCH
Article History: Received 07thJuly, 2017 Received in revised form 23rdAugust, 2017
Accepted 27thSeptember, 2017
Published online 17thOctober, 2017
Citation: Luiz Sérgio Costa Duarte Filho, Edson Ferreira da Silva, Geraldo Veríssimo de Souza Barbosa, Carlos Assis Diniz, JosealdoTonholo, Cícero Carlos de Souza Almeida and José Antônio Bressiani, 2017.“Analysis of genetic variability and agroindustrial characteristics in sugarcane”, International Journal of Current Research, 9, (10), 58483-58491.
Available online at http://www.journalcra.com
Key words: Sugarcane, Genetic parameters, Genetic diversity, Microsatellites. z
RESEARCH ARTICLE
ANALYSIS OF GENETIC VARIABILITY AND AGROINDUSTRIAL CHARACTERISTICS IN SUGARCANE
1,*Luiz Sérgio Costa Duarte Filho,
1Edson Ferreira da Silva,
2
Geraldo Veríssimo de Souza Barbosa,
2Carlos Assis Diniz,
2JosealdoTonholo,
2Cícero Carlos de Souza Almeida and
3José Antônio Bressiani
1
PopulationGeneticsLaboratory, Department of Agronomy, Genetic improvement of plants, University Federal
Rural of Pernambuco, Rua Manoel de Medeiros, s/n – Dois Irmãos 52171-900 Recife, Pernambuco, Brazil
2
University Federal of Alagoas, Av. Lourival Melo Mota, s/n - Tabuleiro dos Martins 57072-900 Maceió,
Alagoas, Brazil
3
GranBio – Bio Vertis Experimental Station, Farm Andorinha, Rod-AL 220 s/n, KM 6, 5,
57180-000 São Miguel dos Campos, Alagoas, Brazil
ARTICLE INFO ABSTRACT
Brazil is the world's largest producer of sugar and ethanol in sugarcane, and genetic improvement was essential for raising agroindustrial yields, providing gains of 1% to 2% per year. The objective of this work was to evaluate the main genotypes grown in Alagoas-Brazil from 1975 to 2010 in a competition experiment conducted between February 2012 and February 2013 at the Sinimbu-Alagoas Plant, adopting the following statistical-genetic procedures: estimates of averages and grouping of cultivars for agroindustrial characteristics; estimates of genetic parameters of agroindustrial characteristics; evaluation of the levels of genetic diversity of the cultivars through microsatellite molecular markers and recommendation of genetic crosses among the studied cultivars. The experimental design was in randomized blocks, with four replications. The plot was composed of three double lines of seven meters, spaced at 1,50 m x 0,80 m. The cultivars that showed the highest sugar yields were RB92579, RB867515, RB99395 and RB951541; the highest estimates of heritability and ratio between the genetic/environmental variance coefficients were for the BRIX, POL, TPH and TCH characteristics, indicating that it is very probable to obtain gains in the selection of superior individuals in these characteristics, performing genetic crosses with the genotypes evaluated in this study; The microsatellite primers SSR05, SSR06 and SSR93 were efficient in determining unique genetic profiles and in discriminating degree of kinship and genetic diversity; the crosses that can predict higher gains in sugar yield are from cultivar RB92579 with cultivars RB867515, RB931003, RB931011, RB951541, RB98710 and RB99395.
Copyright©2017, Luiz Sérgio Costa Duarte Filho et al., This is an open access article distributed under the Creative Commons Attribution License, which permits
unrestricted use, distribution, and reproduction in any medium, provided the original work is properly cited.
INTRODUCTION
The main product derived from sugarcane is sugar, essential human food and basic consumption, being a commodity produced worldwide. In addition to traditional sugar, sugarcane is a raw material for ethanol production - used as an automotive fuel, in the production of beverages and for pharmaceutical purposes - and in the production of electricity through the burning of bagasse.
*Corresponding author: Luiz Sérgio Costa Duarte Filho,
PopulationGeneticsLaboratory, Department of Agronomy, Genetic improvement of plants, University Federal Rural of Pernambuco, Rua Manoel de Medeiros, s/n–Dois Irmãos 52171-900 Recife,
Pernambuco, Brazil.
Brazil is the world's largest producer and exporter of sugar from sugarcane, and has significant economic importance from the colonial period to the present day. This sector occupied in the 2015/2016 harvest, a harvested area of 9.1 million hectares, equivalent to 3.1% of the country's cultivated soils, and generated income of US $ 7 billion, with US $ 3.2 billion Obtained in sales abroad, in Alagoas the harvested area was 322.2 thousand hectares with production of 16.1 million tons of sugarcane, which represented 2.4% of the total Brazilian production (CONAB, 2017; UDOP, 2017). In this context, the genetic improvement of sugarcane was fundamental, mainly due to the increase in agroindustrial yields, with gains of 1 to 2% per year (Barbosa et al., 2012). In Alagoas, in the 1975/1976 harvest, the average agricultural yield was 36.5 tons
ISSN: 0975-833X
International Journal of Current Research
Vol. 9, Issue, 10, pp.58483-58491, October, 2017
INTERNATIONAL JOURNAL OF CURRENT RESEARCH
Article History: Received 07thJuly, 2017 Received in revised form 23rdAugust, 2017
Accepted 27thSeptember, 2017
Published online 17thOctober, 2017
Citation: Luiz Sérgio Costa Duarte Filho, Edson Ferreira da Silva, Geraldo Veríssimo de Souza Barbosa, Carlos Assis Diniz, JosealdoTonholo, Cícero Carlos de Souza Almeida and José Antônio Bressiani, 2017.“Analysis of genetic variability and agroindustrial characteristics in sugarcane”, International Journal of Current Research, 9, (10), 58483-58491.
Available online at http://www.journalcra.com
Key words:
Sugarcane, Genetic parameters, Genetic diversity,
of cane per hectare (TCH) and for each ton of sugarcane was recovered 103.8 kg of total reducing sugars (ART), making up 3.8 TARTH; In this period 93% of the area was occupied by cultivars Co331 and CB45-3. The average yields of the 2010/2011 harvest were 66.0 TCH and in each ton of sugarcane 135.2 kg of ART were recovered, resulting in 8.9 TARTH (gain of 3.5% per year). During this period, there was a great change in the adoption of technologies in the different areas, especially the cultivation of modern cultivars of the abbreviations RB and SP, improvement in crop management and greater efficiency in the industrial recovery of sugarcane (Barbosa2014). However, there is still a need for improvements in increasing the genetic variability of individuals, with the purpose of obtaining gains in specific characters, as well as reducing the time spent to obtain new varieties. For this, it is vitally important to study genetic parameters and molecular markers, which can be valuable tools in favor of the genetic improvement of sugarcane. Through the genetic parameters it is possible to identify the magnitude of the genetic variability and the environmental effects of the studied characters. These parameters allow to verify the effects involved in obtaining future improved populations (Vencovsky and Barriga 1992; Ramalho et al., 2004). The use of molecular techniques allows the analysis of variability at the DNA level, resulting in a grouping of individuals with similar characteristics, allowing to plan the crosses, obtaining better results in a shorter time (Santos et al., 2012). The objective of this study was to evaluate the results of a competition experiment with the main genotypes grown in Alagoas between 1975 and 2010, conducted between February 2012 and February 2013, adopting the following statistical-genetic procedures: estimates of averages and grouping of the cultivars for the main agroindustrial characteristics; estimates of genetic parameters of the main agroindustrial characteristics, aiming the prediction of gains; evaluation of the levels of genetic diversity of the cultivars by molecular markers of the SSR type; recommendation of genetic crosses among cultivars with the purpose of obtaining genetic gains in agroindustrial yields.
MATERIALS AND METHODS
Experiment evaluation of cultivars
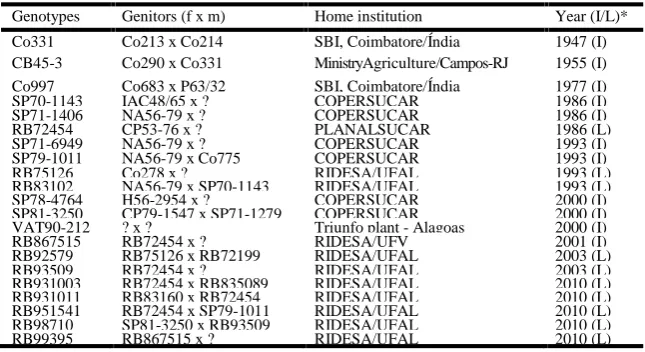
In February 2012 an experiment was installed with 21 sugarcane cultivars at the Sinimbu Plant (09 ° 46'S, 36 ° 06'W and 112 m), municipality of São Miguel dos Campos, Alagoas, Brazil. The soil of the trial was classified as an Eutrophic Yellow Red Latosol. The rainfall of the cultivation period was 1190 mm. The experimental design was in randomized blocks, with four replications. The plot was composed of three double lines of seven meters, at a spacing of 1.50 m x 0.80 m, with a floor area of 48.3 m². Sprinkler irrigation was applied by applying four 30 mm slides, one in the experiment installation and the other at nine, ten and eleven months of age. The evaluated cultivars - those that presented above 3% of the cultivated area in at least one Alagoan crop between 1975 and 2010, are presented in Table 1.
Agroindustrial variables evaluated
At the age of twelve months, the experiment was weighed and all the shoots were weighed with a digital scale. With these results, it was estimated the agricultural productivity of the plot, in Ton of cane per hectare (TCH).
At the time of harvesting, a bundle of cane was removed from each plot, composed of ten stems chosen at random. The collected samples were sent to the laboratory of quality of the raw material of the Santo Antonio Plant for analysis and determination of the following technological characteristics: Cane industrial fiber in% (FIB), total soluble solids of the broth in% (BRIX), in (%) (AR), reducing sugars of the broth, in% (AR) and apparent purity of the broth, in% (PZA), according to the procedures described by Fernandes (2003). In addition to these industrial quality characteristics of sugarcane, the true sucrose (SAC), glucose (GLI) and fructose (FRU) contents were determined by means of high performance liquid chromatography (HPLC), according to the procedure described by (Masuda et al., 1996). The determination of the color index in ICUMSA units (COR) of the samples was performed according to the International Commission for the Unification of Methods of Sugar Analysis (ICUMSA 1994), adjusted for liquid samples. Finally, it was estimated the result of agroindustrial yield, expressed in Tonnes of pol. Per hectare (TPH), by means of the expression:
Statistical analyzes and estimates of genetic parameters
The data obtained from the agroindustrial variables were submitted to analysis of variance (Test F), using the statistical program Sisvar v. 5.3 (Ferreira 2010). For each trait, averages of cultivars were used, using the Skott-Knott procedure (1974) at 5% error probability. Using the Genes program (Cruz 2006), and based on the mean squares of the analysis of variance, were obtained according to Vencovsky and Barriga (1992) the components of variances, which provided estimates of the genetic parameters.
Genetic divergence through SSR
Young leaves (Leaf +1) were collected from each cultivar in this study for DNA extraction, following the protocol Saghai-Marrof et al., (1984). After extraction, the quality of the genomic DNA was evaluated by agarose gel electrophoresis (1%) and then used to generate polymerase chain reaction (PCR). In the amplification of the loci via PCR, three pairs of SSR primers developed by Duarte Filho et al., (2010) were used, whose forward sequence was marked with specific fluorochrome. Afterwards, the PCR product of the 21 cultivars was submitted to the ABI PRISM 3100 automatic analyzer for the analysis of the fluorescent microsatellite fragments, using the GenneMapper software. For the evaluation of these molecular data, the clustering analysis was carried out among the cultivars, adopting, as a measure of dissimilarity the Jaccard index and, as grouping technique, the Ward method. The clustering analysis consists in the use of techniques that allow us to gather, by some criterion of classification, sample units in groups so that the units are similar within the group and with heterogeneity between the groups (Cruz et al.2004). For the analysis of the results, the computational resources of the program "R" (Ferreira 2005).
RESULTS AND DISCUSSION
Analysis of Variance and Grouping of Averages
For all variables evaluated, there was a significant difference at 1% of error probability (p <0.01) by Test F (Table 2). The of cane per hectare (TCH) and for each ton of sugarcane was
recovered 103.8 kg of total reducing sugars (ART), making up 3.8 TARTH; In this period 93% of the area was occupied by cultivars Co331 and CB45-3. The average yields of the 2010/2011 harvest were 66.0 TCH and in each ton of sugarcane 135.2 kg of ART were recovered, resulting in 8.9 TARTH (gain of 3.5% per year). During this period, there was a great change in the adoption of technologies in the different areas, especially the cultivation of modern cultivars of the abbreviations RB and SP, improvement in crop management and greater efficiency in the industrial recovery of sugarcane (Barbosa2014). However, there is still a need for improvements in increasing the genetic variability of individuals, with the purpose of obtaining gains in specific characters, as well as reducing the time spent to obtain new varieties. For this, it is vitally important to study genetic parameters and molecular markers, which can be valuable tools in favor of the genetic improvement of sugarcane. Through the genetic parameters it is possible to identify the magnitude of the genetic variability and the environmental effects of the studied characters. These parameters allow to verify the effects involved in obtaining future improved populations (Vencovsky and Barriga 1992; Ramalho et al., 2004). The use of molecular techniques allows the analysis of variability at the DNA level, resulting in a grouping of individuals with similar characteristics, allowing to plan the crosses, obtaining better results in a shorter time (Santos et al., 2012). The objective of this study was to evaluate the results of a competition experiment with the main genotypes grown in Alagoas between 1975 and 2010, conducted between February 2012 and February 2013, adopting the following statistical-genetic procedures: estimates of averages and grouping of the cultivars for the main agroindustrial characteristics; estimates of genetic parameters of the main agroindustrial characteristics, aiming the prediction of gains; evaluation of the levels of genetic diversity of the cultivars by molecular markers of the SSR type; recommendation of genetic crosses among cultivars with the purpose of obtaining genetic gains in agroindustrial yields.
MATERIALS AND METHODS
Experiment evaluation of cultivars
In February 2012 an experiment was installed with 21 sugarcane cultivars at the Sinimbu Plant (09 ° 46'S, 36 ° 06'W and 112 m), municipality of São Miguel dos Campos, Alagoas, Brazil. The soil of the trial was classified as an Eutrophic Yellow Red Latosol. The rainfall of the cultivation period was 1190 mm. The experimental design was in randomized blocks, with four replications. The plot was composed of three double lines of seven meters, at a spacing of 1.50 m x 0.80 m, with a floor area of 48.3 m². Sprinkler irrigation was applied by applying four 30 mm slides, one in the experiment installation and the other at nine, ten and eleven months of age. The evaluated cultivars - those that presented above 3% of the cultivated area in at least one Alagoan crop between 1975 and 2010, are presented in Table 1.
Agroindustrial variables evaluated
At the age of twelve months, the experiment was weighed and all the shoots were weighed with a digital scale. With these results, it was estimated the agricultural productivity of the plot, in Ton of cane per hectare (TCH).
At the time of harvesting, a bundle of cane was removed from each plot, composed of ten stems chosen at random. The collected samples were sent to the laboratory of quality of the raw material of the Santo Antonio Plant for analysis and determination of the following technological characteristics: Cane industrial fiber in% (FIB), total soluble solids of the broth in% (BRIX), in (%) (AR), reducing sugars of the broth, in% (AR) and apparent purity of the broth, in% (PZA), according to the procedures described by Fernandes (2003). In addition to these industrial quality characteristics of sugarcane, the true sucrose (SAC), glucose (GLI) and fructose (FRU) contents were determined by means of high performance liquid chromatography (HPLC), according to the procedure described by (Masuda et al., 1996). The determination of the color index in ICUMSA units (COR) of the samples was performed according to the International Commission for the Unification of Methods of Sugar Analysis (ICUMSA 1994), adjusted for liquid samples. Finally, it was estimated the result of agroindustrial yield, expressed in Tonnes of pol. Per hectare (TPH), by means of the expression:
Statistical analyzes and estimates of genetic parameters
The data obtained from the agroindustrial variables were submitted to analysis of variance (Test F), using the statistical program Sisvar v. 5.3 (Ferreira 2010). For each trait, averages of cultivars were used, using the Skott-Knott procedure (1974) at 5% error probability. Using the Genes program (Cruz 2006), and based on the mean squares of the analysis of variance, were obtained according to Vencovsky and Barriga (1992) the components of variances, which provided estimates of the genetic parameters.
Genetic divergence through SSR
Young leaves (Leaf +1) were collected from each cultivar in this study for DNA extraction, following the protocol Saghai-Marrof et al., (1984). After extraction, the quality of the genomic DNA was evaluated by agarose gel electrophoresis (1%) and then used to generate polymerase chain reaction (PCR). In the amplification of the loci via PCR, three pairs of SSR primers developed by Duarte Filho et al., (2010) were used, whose forward sequence was marked with specific fluorochrome. Afterwards, the PCR product of the 21 cultivars was submitted to the ABI PRISM 3100 automatic analyzer for the analysis of the fluorescent microsatellite fragments, using the GenneMapper software. For the evaluation of these molecular data, the clustering analysis was carried out among the cultivars, adopting, as a measure of dissimilarity the Jaccard index and, as grouping technique, the Ward method. The clustering analysis consists in the use of techniques that allow us to gather, by some criterion of classification, sample units in groups so that the units are similar within the group and with heterogeneity between the groups (Cruz et al.2004). For the analysis of the results, the computational resources of the program "R" (Ferreira 2005).
RESULTS AND DISCUSSION
Analysis of Variance and Grouping of Averages
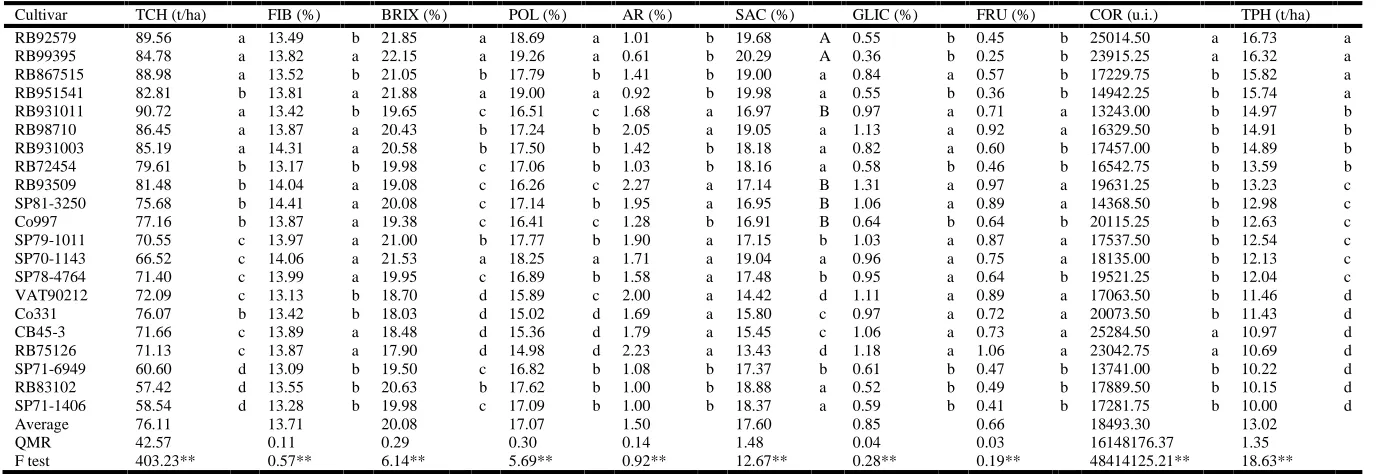
For all variables evaluated, there was a significant difference at 1% of error probability (p <0.01) by Test F (Table 2). The of cane per hectare (TCH) and for each ton of sugarcane was
recovered 103.8 kg of total reducing sugars (ART), making up 3.8 TARTH; In this period 93% of the area was occupied by cultivars Co331 and CB45-3. The average yields of the 2010/2011 harvest were 66.0 TCH and in each ton of sugarcane 135.2 kg of ART were recovered, resulting in 8.9 TARTH (gain of 3.5% per year). During this period, there was a great change in the adoption of technologies in the different areas, especially the cultivation of modern cultivars of the abbreviations RB and SP, improvement in crop management and greater efficiency in the industrial recovery of sugarcane (Barbosa2014). However, there is still a need for improvements in increasing the genetic variability of individuals, with the purpose of obtaining gains in specific characters, as well as reducing the time spent to obtain new varieties. For this, it is vitally important to study genetic parameters and molecular markers, which can be valuable tools in favor of the genetic improvement of sugarcane. Through the genetic parameters it is possible to identify the magnitude of the genetic variability and the environmental effects of the studied characters. These parameters allow to verify the effects involved in obtaining future improved populations (Vencovsky and Barriga 1992; Ramalho et al., 2004). The use of molecular techniques allows the analysis of variability at the DNA level, resulting in a grouping of individuals with similar characteristics, allowing to plan the crosses, obtaining better results in a shorter time (Santos et al., 2012). The objective of this study was to evaluate the results of a competition experiment with the main genotypes grown in Alagoas between 1975 and 2010, conducted between February 2012 and February 2013, adopting the following statistical-genetic procedures: estimates of averages and grouping of the cultivars for the main agroindustrial characteristics; estimates of genetic parameters of the main agroindustrial characteristics, aiming the prediction of gains; evaluation of the levels of genetic diversity of the cultivars by molecular markers of the SSR type; recommendation of genetic crosses among cultivars with the purpose of obtaining genetic gains in agroindustrial yields.
MATERIALS AND METHODS
Experiment evaluation of cultivars
In February 2012 an experiment was installed with 21 sugarcane cultivars at the Sinimbu Plant (09 ° 46'S, 36 ° 06'W and 112 m), municipality of São Miguel dos Campos, Alagoas, Brazil. The soil of the trial was classified as an Eutrophic Yellow Red Latosol. The rainfall of the cultivation period was 1190 mm. The experimental design was in randomized blocks, with four replications. The plot was composed of three double lines of seven meters, at a spacing of 1.50 m x 0.80 m, with a floor area of 48.3 m². Sprinkler irrigation was applied by applying four 30 mm slides, one in the experiment installation and the other at nine, ten and eleven months of age. The evaluated cultivars - those that presented above 3% of the cultivated area in at least one Alagoan crop between 1975 and 2010, are presented in Table 1.
Agroindustrial variables evaluated
At the age of twelve months, the experiment was weighed and all the shoots were weighed with a digital scale. With these results, it was estimated the agricultural productivity of the plot, in Ton of cane per hectare (TCH).
At the time of harvesting, a bundle of cane was removed from each plot, composed of ten stems chosen at random. The collected samples were sent to the laboratory of quality of the raw material of the Santo Antonio Plant for analysis and determination of the following technological characteristics: Cane industrial fiber in% (FIB), total soluble solids of the broth in% (BRIX), in (%) (AR), reducing sugars of the broth, in% (AR) and apparent purity of the broth, in% (PZA), according to the procedures described by Fernandes (2003). In addition to these industrial quality characteristics of sugarcane, the true sucrose (SAC), glucose (GLI) and fructose (FRU) contents were determined by means of high performance liquid chromatography (HPLC), according to the procedure described by (Masuda et al., 1996). The determination of the color index in ICUMSA units (COR) of the samples was performed according to the International Commission for the Unification of Methods of Sugar Analysis (ICUMSA 1994), adjusted for liquid samples. Finally, it was estimated the result of agroindustrial yield, expressed in Tonnes of pol. Per hectare (TPH), by means of the expression:
Statistical analyzes and estimates of genetic parameters
The data obtained from the agroindustrial variables were submitted to analysis of variance (Test F), using the statistical program Sisvar v. 5.3 (Ferreira 2010). For each trait, averages of cultivars were used, using the Skott-Knott procedure (1974) at 5% error probability. Using the Genes program (Cruz 2006), and based on the mean squares of the analysis of variance, were obtained according to Vencovsky and Barriga (1992) the components of variances, which provided estimates of the genetic parameters.
Genetic divergence through SSR
Young leaves (Leaf +1) were collected from each cultivar in this study for DNA extraction, following the protocol Saghai-Marrof et al., (1984). After extraction, the quality of the genomic DNA was evaluated by agarose gel electrophoresis (1%) and then used to generate polymerase chain reaction (PCR). In the amplification of the loci via PCR, three pairs of SSR primers developed by Duarte Filho et al., (2010) were used, whose forward sequence was marked with specific fluorochrome. Afterwards, the PCR product of the 21 cultivars was submitted to the ABI PRISM 3100 automatic analyzer for the analysis of the fluorescent microsatellite fragments, using the GenneMapper software. For the evaluation of these molecular data, the clustering analysis was carried out among the cultivars, adopting, as a measure of dissimilarity the Jaccard index and, as grouping technique, the Ward method. The clustering analysis consists in the use of techniques that allow us to gather, by some criterion of classification, sample units in groups so that the units are similar within the group and with heterogeneity between the groups (Cruz et al.2004). For the analysis of the results, the computational resources of the program "R" (Ferreira 2005).
RESULTS AND DISCUSSION
Analysis of Variance and Grouping of Averages
grouping of the means of each characteristic of the cultivars evaluated in this study was done by means of the Skott-Knott procedure with a 5% probability of error. The average agricultural productivity of the experiment was 76.11 TCH (Table 2). The low value of this characteristic in this experiment was due to the great reduction of the rainfall of the cultivation period (1190 mm, being 33% lower than the normal average of the region). It should be noted that in the PMGCA-UFAL trials, the historical average for HCT observed in 574 experiments was 101.97, with a minimum of 36.30 and a maximum of 180.83 tons of cane per hectare (PMGCA-UFAL2015). There were four groups (Table 2): one of the lowest average agricultural productivity (group d), consisting of three genotypes; two intermediate groups, (c) and (b) composed of 12 genotypes; and a group of higher average agricultural productivity (a), with six cultivars. It is worth mentioning that these six cultivars of the group (a) with the highest average agricultural productivity represented 47.30% of the cultivated area in Alagoas in 2012, according to Chapola et al., (2013). In this experiment, we observed the superiority of 48.87% of group (a) composed of genotypes currently cultivated for group (d) composed of genotypes grown two decades ago. Other studies evaluated the grouping of cultivars for HCT, with gains from the most productive group to the least productive of 64.46% in Pernambuco (Lima Neto et al., 2013), 91.38% in Pernambuco (Dutra Filho et al., 2011) and 23.55% in Alagoas (Santos et al., 2008).
For the quality characteristics of the raw material (Table 2), the following averages were observed: FIB (13.71%), BRIX (20.08), POL (17.07%) and AR (1.50%. It is interesting to note that studies carried out in Alagoas in 1985 to evaluate the quality of the raw material had the following mean values: FIB (14.50%), BRIX (19.51%) and POL (15.95%) (Oliveira 1985). In the present study, FIB was lower, with BRIX and POL being higher than the values observed in 1985 in Alagoas. It is also observed that for the FIB and POL characteristics, in the PMGCA-UFAL tests the historical averages are 13.76% and 14.41%, respectively, with a minimum of 10.32% for FIB and 10.64% for POL, and maximum of 17.10% for FIB and 17.23% for POL (PMGCA-UFAL 20015). The mean of the assay for the AR characteristic was high (1.50%). Reducing sugars when at high levels show an early stage of maturation of sugarcane, in addition to the presence of other substances undesirable for processing (Fernandes 2003). Two groups were formed for IBF (Table 2), one with a lower average content (group b), with nine cultivars and one group with a higher average IBF content (group a), consisting of 12 cultivars. Despite the formation of two different groups, most of the cultivars presented averages of fiber content in a desirable range, which is between 12 and 14% (Ripoli and Ripoli 2004). Work performed in Pernambuco between 2008 and 2010 showed a variation of FIB from 13.22 to 15.17% (Lima Neto et al., 2013), from 14.06 to 15.10% (Dutra Filho et al., 2011) and from 14.63 to 16.24% (Silva et al., 2011). For BRIX (Table 2) four groups were formed: one with lower mean values, represented by four genotypes; Two groups with intermediate mean values composed of 13 genotypes and one group with high average values of BRIX with fourth genotypes. With this, BRIX superiority of the cultivars of group "a" was verified in relation to group "d" of 19.53%. It was also observed a variation of BRIX of the cultivars, between 17.90% and 22.15%, a much larger amplitude than that reported by Oliveira (1985) for the 1984/1985 crop of the State of Alagoas (18.00% to 20,52%). Lima Neto et al., (2013) and Dutra Filho
et al., (2011), evaluating sugarcane genotypes in Pernambuco, did not observe the formation of distinct groups for this characteristic. The grouping of the cultivars denoted four categories for the variable POL and two categories for the AR variable (Table 2) by the Skott-Knott procedure with a 5% probability of error. By means of the HPLC equipment, the following averages were verified: SAC (17.60%), GLI (0.85%) and FRU (0.66%). It was noted that the values obtained for reducing sugars were similar by the two procedures (polarimetry and HPLC), but the sucrose content obtained by HPLC was 3.10% higher than that obtained by the polarimetric method. Tai and Miller (2002) observed superiority for the HPLC method of 6.50% sucrose relative to the polarimetric. The true reducing sugars (glucose and fructose) when at high levels show that the raw material is immature for the final processing of sugar production, but ethanol production is important (Fernandes 2003).
The TPH agroindustrial yield (Table 2) presented an average of 13.02. In the PMGCA-UFAL trials, the historical mean for TPH observed in 574 experiments was 14.72, with a minimum of 5.14 and a maximum of 24.44 (PMGCA-UFAL 20015). It was also verified in the present study that genotypes cultivated before 1980 presented average TPH of 10.70, while cultivated genotypes currently presented an average of 16.15 (gain of 50.95%). Barbosa (2008) reports that the cultivars RB92579 and RB93509, obtained by PMGCA-UFAL, and released in 2003, showed productivity gains in the order of 60% above the varieties Co331, CB45-3 and Co997. The formation of four groups was observed by the Skott-Knott procedure. Four cultivars belonging to group "a" corresponded to 46.67% of genotypes grown in Alagoas in 2012 (Chapola et al., 2013). Barbosa et al., (2000) report a gain of 30.09% for cultivar RB92579 in relation to SP79-1011 in 28 experimental crops in Alagoas. In this work, it was observed that the group "a" composed of the genotypes with significant area cultivated in Alagoas (Chapola et al., 2013) presented a gain of 50.95%, in relation to the genotypes present in group "d", compound by genotypes grown two decades ago in Alagoas. Pernambuco evaluated genotype grouping by the Skott-Knott test at 5% and indicated percentage gains from the most productive group to the least productive group of 47.96% (Dutra Filho et al., 2011), 26.29% (Lima Neto et al., 2013) and 21.16% (Silva et al., 2011).
The overall assay average for the COR characteristic of the crude or in natura broth (Table 2) was 18493 units ICUMSA (u.i.). Hamerski (2009) carried out a test conducted in the State of Santa Catarina, Brazil, in 2009, found a superior average for the COR in natura broth (31367 u.i.). Santos et al., (2008) observed an average of 8523 u.i. of clarified broth (chemically treated) in 43 varieties of sugarcane in Alagoas in the year 2008. It is important to know that Lima (2012) observed a reduction of 40% of COR from raw broth to decanter and 30% reduction of broth to clarified broth, or chemically treated broth. The grouping of the genotypes divided into two categories, namely: a "b" group with low broth color (<21000 u.i.), with 17 cultivars and another group "a" with four cultivars of high broth color (> 21000 u.i.). Among the genotypes of group "b", the most planted in Alagoas in 2012 (Chapola et al., 2013) should be highlighted: SP79-1011 (2nd place, with 15.00%); RB857515 (3rd place, with 12.77%); RB951541 RB98710 and RB931011 (extremely promising cultivars in agroindustrial yields, which are among the most planted). On the other hand, the high color broth group
consisted of four genotypes. Among these genotypes, RB92579 leads the cultivated area in Alagoas since the 2008/2009 crop and in 2013 was the second most planted in Brazil (Barbosa 2014), and RB99395, which despite the high COR, has a high sucrose content and was among the most planted in 2012 in Alagoas (Chapola et al., 2013).
Genetic parameters
The results of the genetic parameter estimates of the characteristics evaluated in this study are summarized in Table 3. For all the 21 cultivars that participated in the present study, it was verified that the variable BRIX was the one that presented the largest magnitudes for estimation of heritability in the broad sense in terms of average (h2m=0.9521) and for
the CVg/CVe ratio (2.2310). It can be inferred that 95.21% of the total BRIX variations were explained by factors of a genetic nature (cultivars present in this study) and only 4.79% of the total BRIX variations can be attributed to external (environmental) factors. Allied to this result, the CVg/CVe ratio was much larger than the unit. These results indicate that it is very probable to obtain future gains in the selection of superior individuals in total soluble solids contents by performing genetic crosses with the cultivars evaluated in this study. Research conducted in the last decades by several sugarcane breeding programs indicates that this feature has the highest magnitude of selection gain - Australia (0.7500) and Fiji (0.4800) (Skinner et al., 1987); Pernambuco-BRA (0.7042) (Moraes et al., 2010), São Paulo-BRA (0.8630 to 0.9050) (Bressiani et al., 2002). In addition to these results, they also indicate CVg/CVe ratio of 0.3500 to 1.2200 in Pernambuco-BRA (Dutra Filho et al., 2011, Silva et al., 2011), and 0.5700 Minas Gerais-BRA (Leite et al., 2006). In the present study, larger magnitudes of the estimates of these parameters are observed in Alagoas-BRA.
The characteristic POL (apparent sucrose) presented the second largest magnitudes for heritability in the broad sense in terms of mean (h2m = 0.9473) and for the CVg / CVe ratio
(2.1200). This means that, among the sugars present in BRIX, the apparent sucrose content had a greater participation in the evaluation of inheritance parameters, indicating that it is very probable to obtain gains in the selection of higher individuals in sucrose contents by performing genetic crosses with the evaluated cultivars study. In addition, according to Barbosa (2014), the strategies used in genetic improvement in relation to the sugar yield gain were very successful in the experimental research carried out in Alagoas, since there was an annual increase in sugar yield of 80 kg ha-1 in the period 1975 to 1992, using the strategy of increasing sucrose content. Inheritance studies for this characteristic in the Pernambuco-BRA conditions showed values of 0.5904 (Oliveira et al., 2011), 0.7427 (Moraes et al., 2010) and 0.8195 (Silva 2008). In this same region, results of CVg/CVe ratio of 0.3610 (Dutra Filho et al., 2011), 0.4300 (Lima Neto et al., 2013) and 1.0720 were also obtained (Silva et al., 2011). Considering that the genetic improvement of sugarcane cultivated in Alagoas over the last four decades was focused on the sugar cane elevation, in detriment to the increase in fiber content, it was evidenced that this characteristic participated very little in the selection of superior individuals, with lower value of heritability in the broad sense in terms of averages (h2m= 0.8058) and low
CVg/CVe ratio (1.0100). This means that it is not expected to select superior individuals in fiber content by crossing the genotypes of the present study.
Research carried out in Pernambuco-BRA obtained results for fiber heritability varying from 0.5238 to 0.6800 (Lima Neto et al., 2010; Silva et al., 2011). For the CVg/CVe ratio, the values of 0.5320 (Silva et al., 2011) and 0.6410 (Lima Neto et al., 2013) were observed. It should be noted that one of the first concerns of a breeder is the existence of genetic variability in germplasm (Borém and Miranda 2005), which can increase the chances of obtaining superior individuals in the segregating generations, thus gaining a certain characteristic (Cruz et al., 2004). In the present work, the results for the broth color indicated smaller magnitudes for heritability in the broad sense in terms of averages (h2m= 0.6665) and for the CVg/CVe ratio
(0.7100). This suggests that smaller success is expected to select divergent individuals in COR performing crosses between the genotypes of the present study. On the other hand, the genetic improvement of sugarcane practiced in Alagoas-BRA in the last four decades did not have any strategy for the selection of individuals with this characteristic (Santos et al., 2008). In addition, during the 2006/2007 season of Alagoas, Santos et al., (2008) analyzed the color of clarified broth of cane in 43 sugarcane genotypes and concluded that COR is a characteristic of high genetic heritability, which can provide gains with selection.
The characteristic agricultural productivity, estimated by TCH, also presented high magnitudes of heritability in the broad sense in terms of averages (h2m= 0.8944) and CVg/CVe ratio
(1.4600). Due to this result, it is possible to obtain future gains by selecting genotypes with higher yields from the genetic crosses with the cultivars evaluated in this study. In Pernambuco-BRA, Lima Neto et al., (2013), Silva et al., (2011) and Moraes et al., (2010) found estimates of 0.8700, 0.7980 and 0.7727, respectively. Castro (2012) observed a magnitude of 0.8214 in Minas Gerais-BRA; Bressiani et al., (2002) verified values of 0.5500 and 0.6920 in São Paulo-BRA. It is important to note that in relation to the sugar yield gain in the experimental researches carried out in Alagoas-BRA, a strategy of increasing agricultural yield was also achieved, since between 1993 and 2010 there was an annual increase in sugar yield of 140 kg ha-1, with greater participation of the increase of TCH. Considering that TPH= (TCH)(POL)/100, the estimated heritability and CVg/CVe ratio followed those found for TCH and POL. With this, there is a great possibility of future gains in the selection of superior individuals in sugar yield (TPH). The heritability was 0.9273. The CVg/CVe ratio was 1.7900, suggesting selection gain for the TPH character. Studies performed by Silva et al., (2011) in Pernambuco-BRA presented heritability of 0.8880 and CVg/CVe ratio of 1.4100; Coelho et al., (2007) in Paraná-BRA, evaluating RB clones of the 95 series obtained an average heritability of 0.7000.
Assessment of genetic divergence by means of SSR
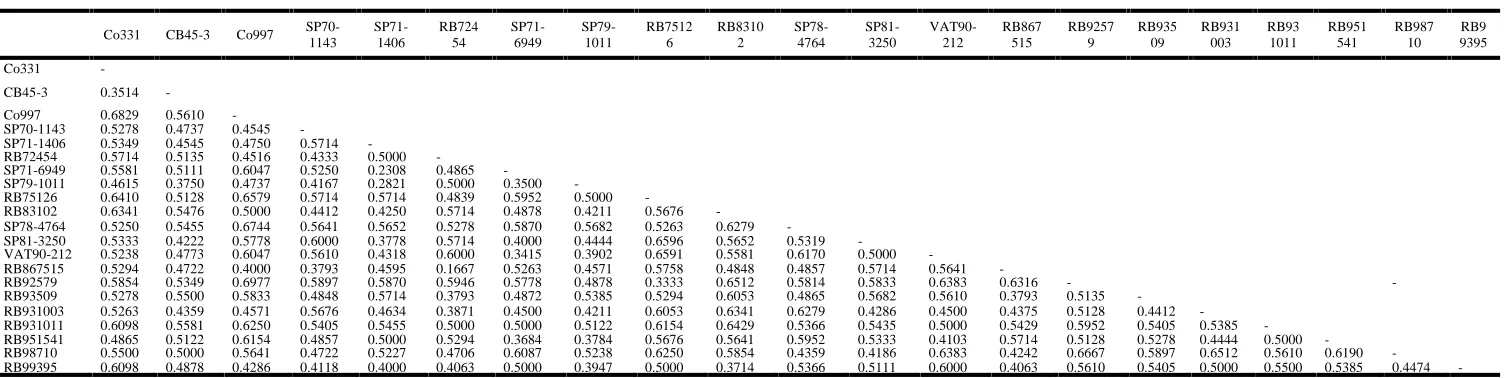
The size of the alleles varied from 111 to 191 bp for the first SSR05, from 172 to 215 bp (SSR06) and from 156 to 192 bp (SSR93). The mean polymorphism index (PIC) among SSR primers was 0.8550, with a minimum of 0.6620 (SSR93) and a maximum of 1.0 (SSR05). The high values of PIC reflect the ability of microsatellites to detect the polymorphism and to generate, when combined, discriminative (distinct) molecular profiles for the twenty one genotypes evaluated, and can be used to evaluate the efficiency of a microsatellite loci in the identification of cultivars (Tessier et al., 1999) (Table4). Based on the genetic divergence matrix, obtained through the Jaccard coefficient from binary information generated by the microsatellite molecular markers SSR05, SSR06 and SSR93, it was observed that the values of genetic dissimilarity (GD) between cane cultivars sugarcane from the present study ranged from 0.1667 to 0.6977 (Table 5) and GD average between cultivars was 0.5169. Among the lowest values of GD were the clashes between the parents and their offspring: RB92579 and its genitor RB75126 (Barbosa et al., 2000), with GD of 0.3333; RB867515 and its parent RB72454 (Barbosa et al., 2012), with GD of 0.1667; CB45-3 and its parent gene Co331 (Barbosa 2014), with GD of 0.3514; The differences between the cultivars descending from NA56-79 (Barbosa 2014): SP71-1406 and SP79-1011 (GD = 0.2821) were also
[image:5.595.83.505.57.279.2]highlighted with low GD value; SP71-1406 and SP71-6949 (GD= 0.2308); SP79-1011 and SP71-6949 (GD= 0.3500). On the other hand, among the highest values of genetic dissimilarity (GD), the following stand out: Co997 and RB92579 (0.6977), RB931003 and RB98710 (0.6512); RB98710 and RB92579 (0.6667); RB83102 and RB92579 (0.6512); RB75126 and SP81-3250 (0.6596); VAT90-212 and RB75126 (0.6591); Co997 and RB75126 (0.6579); Co997 and SP78-4764 (0.6744); and Co997 and Co331 (0.6829). It should be noted that in these clashes of genetic dissimilarity between cultivars, there is no degree of relationship between them, except between RB931003 and RB98710, since they are descendants of first and second grades of RB72454, respectively (Barbosa 2014). SSR markers distinguished the 21 cultivars in four groups by the Ward method, using the Jaccard index (Figure 1): group "a", composed of eight genotypes; group "b", formed by two genotypes; group "c", formed by five genotypes and group "d", formed by six genotypes. Considering the values of GD of Table 5 and the groups of cultivars of Figure 1, the following average values of GD were observed within the groups: "b" (0.3333), "c" (0.3682), "a" (0.4536) and "d" (0.5081). It was observed that in Group "a" the grouping of cultivar RB72454 with its first-generation descendants (RB867515, RB93509 and RB931003) and Figure 1. Grouping of representative dendrogram cultivars by Ward method using the Jaccard index
Table 1. Description of cultivars, parents, obtentora institution and year of introduction or release (I / L) in Alagoas in the last four decades
Genotypes Genitors (f x m) Home institution Year (I/L)*
Co331 Co213 x Co214 SBI, Coimbatore/Índia 1947 (I) CB45-3 Co290 x Co331 MinistryAgriculture/Campos-RJ 1955 (I) Co997 Co683 x P63/32 SBI, Coimbatore/Índia 1977 (I)
SP70-1143 IAC48/65 x ? COPERSUCAR 1986 (I)
SP71-1406 NA56-79 x ? COPERSUCAR 1986 (I)
RB72454 CP53-76 x ? PLANALSUCAR 1986 (L)
SP71-6949 NA56-79 x ? COPERSUCAR 1993 (I)
SP79-1011 NA56-79 x Co775 COPERSUCAR 1993 (I)
RB75126 Co278 x ? RIDESA/UFAL 1993 (L)
RB83102 NA56-79 x SP70-1143 RIDESA/UFAL 1993 (L)
SP78-4764 H56-2954 x ? COPERSUCAR 2000 (I)
SP81-3250 CP79-1547 x SP71-1279 COPERSUCAR 2000 (I) VAT90-212 ? x ? Triunfo plant - Alagoas 2000 (I)
RB867515 RB72454 x ? RIDESA/UFV 2001 (I)
RB92579 RB75126 x RB72199 RIDESA/UFAL 2003 (L)
RB93509 RB72454 x ? RIDESA/UFAL 2003 (L)
RB931003 RB72454 x RB835089 RIDESA/UFAL 2010 (L) RB931011 RB83160 x RB72454 RIDESA/UFAL 2010 (L) RB951541 RB72454 x SP79-1011 RIDESA/UFAL 2010 (L) RB98710 SP81-3250 x RB93509 RIDESA/UFAL 2010 (L)
RB99395 RB867515 x ? RIDESA/UFAL 2010 (L)
a
b
c
d
[image:5.595.137.460.340.516.2]Table 2. Grouping of average values by Scott-Knott's method to 5% of the cultivars error probability for characters: ton of cane per hectare (TCH), industrial cane fiber (%) (FIB), total soluble solids of the juice (%) (BRIX), Pol% broth (POL), reducing the broth Sugars (%) (RA), sucrose content (SAC), the glucose content (GLI), the fructose content (FRU) broth color in ICUMSA units
and Ton inch per hectare (TPH), evaluated in an experiment conducted in Sinimbu-AL plant in crop year 2012/2013
Cultivar TCH (t/ha) FIB (%) BRIX (%) POL (%) AR (%) SAC (%) GLIC (%) FRU (%) COR (u.i.) TPH (t/ha)
RB92579 89.56 a 13.49 b 21.85 a 18.69 a 1.01 b 19.68 A 0.55 b 0.45 b 25014.50 a 16.73 a
RB99395 84.78 a 13.82 a 22.15 a 19.26 a 0.61 b 20.29 A 0.36 b 0.25 b 23915.25 a 16.32 a
RB867515 88.98 a 13.52 b 21.05 b 17.79 b 1.41 b 19.00 a 0.84 a 0.57 b 17229.75 b 15.82 a
RB951541 82.81 b 13.81 a 21.88 a 19.00 a 0.92 b 19.98 a 0.55 b 0.36 b 14942.25 b 15.74 a
RB931011 90.72 a 13.42 b 19.65 c 16.51 c 1.68 a 16.97 B 0.97 a 0.71 a 13243.00 b 14.97 b
RB98710 86.45 a 13.87 a 20.43 b 17.24 b 2.05 a 19.05 a 1.13 a 0.92 a 16329.50 b 14.91 b
RB931003 85.19 a 14.31 a 20.58 b 17.50 b 1.42 b 18.18 a 0.82 a 0.60 b 17457.00 b 14.89 b
RB72454 79.61 b 13.17 b 19.98 c 17.06 b 1.03 b 18.16 a 0.58 b 0.46 b 16542.75 b 13.59 b
RB93509 81.48 b 14.04 a 19.08 c 16.26 c 2.27 a 17.14 B 1.31 a 0.97 a 19631.25 b 13.23 c
SP81-3250 75.68 b 14.41 a 20.08 c 17.14 b 1.95 a 16.95 B 1.06 a 0.89 a 14368.50 b 12.98 c
Co997 77.16 b 13.87 a 19.38 c 16.41 c 1.28 b 16.91 B 0.64 b 0.64 b 20115.25 b 12.63 c
SP79-1011 70.55 c 13.97 a 21.00 b 17.77 b 1.90 a 17.15 b 1.03 a 0.87 a 17537.50 b 12.54 c
SP70-1143 66.52 c 14.06 a 21.53 a 18.25 a 1.71 a 19.04 a 0.96 a 0.75 a 18135.00 b 12.13 c
SP78-4764 71.40 c 13.99 a 19.95 c 16.89 b 1.58 a 17.48 b 0.95 a 0.64 b 19521.25 b 12.04 c
VAT90212 72.09 c 13.13 b 18.70 d 15.89 c 2.00 a 14.42 d 1.11 a 0.89 a 17063.50 b 11.46 d
Co331 76.07 b 13.42 b 18.03 d 15.02 d 1.69 a 15.80 c 0.97 a 0.72 a 20073.50 b 11.43 d
CB45-3 71.66 c 13.89 a 18.48 d 15.36 d 1.79 a 15.45 c 1.06 a 0.73 a 25284.50 a 10.97 d
RB75126 71.13 c 13.87 a 17.90 d 14.98 d 2.23 a 13.43 d 1.18 a 1.06 a 23042.75 a 10.69 d
SP71-6949 60.60 d 13.09 b 19.50 c 16.82 b 1.08 b 17.37 b 0.61 b 0.47 b 13741.00 b 10.22 d
RB83102 57.42 d 13.55 b 20.63 b 17.62 b 1.00 b 18.88 a 0.52 b 0.49 b 17889.50 b 10.15 d
SP71-1406 58.54 d 13.28 b 19.98 c 17.09 b 1.00 b 18.37 a 0.59 b 0.41 b 17281.75 b 10.00 d
Average 76.11 13.71 20.08 17.07 1.50 17.60 0.85 0.66 18493.30 13.02
QMR 42.57 0.11 0.29 0.30 0.14 1.48 0.04 0.03 16148176.37 1.35
[image:6.842.80.770.101.338.2]F test 403.23** 0.57** 6.14** 5.69** 0.92** 12.67** 0.28** 0.19** 48414125.21** 18.63**
Table 3. Estimates of genetic parameters to Ton characters cane per hectare (TCH), industrial cane fiber (%) (FIB), total soluble solids of the juice (%) (BRIX), Pol% broth (POL), reducing the broth Sugars (%) (RA), sucrose content (SAC), the glucose content (GLI), the fructose content (FRU) in broth color ICUMSA units pol and Ton per hectare (TPH). Harvested test at twelve
months of age sugarcane, Sinimbu-AL Plant, February 2012 to February 2013
Genetic parameters
Variables (%) (%) (%)
TCH 90.164 10.643 100.806 0.894 12.476 8.572 13.191 1.455
FIB 0.114 0.028 0.142 0.806 2.465 2.420 2.746 1.019
BRIX 1.461 0.074 1.535 0.952 6.019 2.701 6.170 2.229
POL 1.348 0.075 1.423 0.947 6.801 3.209 6.989 2.119
AR 0.194 0.035 0.229 0.848 29.312 24.840 31.898 1.180
SAC 2.797 0.371 3.168 0.883 9.501 6.916 10.110 1.374
GLI 0.060 0.011 0.071 0.845 28.916 24.737 31.450 1.169
FRU 0.041 0.008 0.049 0.833 30.540 27.300 33.451 1.119
COR 8066487.218 4037044.092 12103531.310 0.666 15.358 21.729 18.812 0.707
TPH 4.318 0.338 4.656 0.927 15.960 8.93 16.573 1.786
Genotypic variance ; environmental variance in terms of averages: ; phenotypic variance in terms of averages: ; Heritability in the broad sense in terms of averages: ; genetic variation coefficient: ); Coefficient of
environmental variation: ; phenotypic variation coefficient: ; Ratio between the coefficients of genetic / environmental variation: .
Table 2. Grouping of average values by Scott-Knott's method to 5% of the cultivars error probability for characters: ton of cane per hectare (TCH), industrial cane fiber (%) (FIB), total soluble solids of the juice (%) (BRIX), Pol% broth (POL), reducing the broth Sugars (%) (RA), sucrose content (SAC), the glucose content (GLI), the fructose content (FRU) broth color in ICUMSA units
and Ton inch per hectare (TPH), evaluated in an experiment conducted in Sinimbu-AL plant in crop year 2012/2013
Cultivar TCH (t/ha) FIB (%) BRIX (%) POL (%) AR (%) SAC (%) GLIC (%) FRU (%) COR (u.i.) TPH (t/ha)
RB92579 89.56 a 13.49 b 21.85 a 18.69 a 1.01 b 19.68 A 0.55 b 0.45 b 25014.50 a 16.73 a
RB99395 84.78 a 13.82 a 22.15 a 19.26 a 0.61 b 20.29 A 0.36 b 0.25 b 23915.25 a 16.32 a
RB867515 88.98 a 13.52 b 21.05 b 17.79 b 1.41 b 19.00 a 0.84 a 0.57 b 17229.75 b 15.82 a
RB951541 82.81 b 13.81 a 21.88 a 19.00 a 0.92 b 19.98 a 0.55 b 0.36 b 14942.25 b 15.74 a
RB931011 90.72 a 13.42 b 19.65 c 16.51 c 1.68 a 16.97 B 0.97 a 0.71 a 13243.00 b 14.97 b
RB98710 86.45 a 13.87 a 20.43 b 17.24 b 2.05 a 19.05 a 1.13 a 0.92 a 16329.50 b 14.91 b
RB931003 85.19 a 14.31 a 20.58 b 17.50 b 1.42 b 18.18 a 0.82 a 0.60 b 17457.00 b 14.89 b
RB72454 79.61 b 13.17 b 19.98 c 17.06 b 1.03 b 18.16 a 0.58 b 0.46 b 16542.75 b 13.59 b
RB93509 81.48 b 14.04 a 19.08 c 16.26 c 2.27 a 17.14 B 1.31 a 0.97 a 19631.25 b 13.23 c
SP81-3250 75.68 b 14.41 a 20.08 c 17.14 b 1.95 a 16.95 B 1.06 a 0.89 a 14368.50 b 12.98 c
Co997 77.16 b 13.87 a 19.38 c 16.41 c 1.28 b 16.91 B 0.64 b 0.64 b 20115.25 b 12.63 c
SP79-1011 70.55 c 13.97 a 21.00 b 17.77 b 1.90 a 17.15 b 1.03 a 0.87 a 17537.50 b 12.54 c
SP70-1143 66.52 c 14.06 a 21.53 a 18.25 a 1.71 a 19.04 a 0.96 a 0.75 a 18135.00 b 12.13 c
SP78-4764 71.40 c 13.99 a 19.95 c 16.89 b 1.58 a 17.48 b 0.95 a 0.64 b 19521.25 b 12.04 c
VAT90212 72.09 c 13.13 b 18.70 d 15.89 c 2.00 a 14.42 d 1.11 a 0.89 a 17063.50 b 11.46 d
Co331 76.07 b 13.42 b 18.03 d 15.02 d 1.69 a 15.80 c 0.97 a 0.72 a 20073.50 b 11.43 d
CB45-3 71.66 c 13.89 a 18.48 d 15.36 d 1.79 a 15.45 c 1.06 a 0.73 a 25284.50 a 10.97 d
RB75126 71.13 c 13.87 a 17.90 d 14.98 d 2.23 a 13.43 d 1.18 a 1.06 a 23042.75 a 10.69 d
SP71-6949 60.60 d 13.09 b 19.50 c 16.82 b 1.08 b 17.37 b 0.61 b 0.47 b 13741.00 b 10.22 d
RB83102 57.42 d 13.55 b 20.63 b 17.62 b 1.00 b 18.88 a 0.52 b 0.49 b 17889.50 b 10.15 d
SP71-1406 58.54 d 13.28 b 19.98 c 17.09 b 1.00 b 18.37 a 0.59 b 0.41 b 17281.75 b 10.00 d
Average 76.11 13.71 20.08 17.07 1.50 17.60 0.85 0.66 18493.30 13.02
QMR 42.57 0.11 0.29 0.30 0.14 1.48 0.04 0.03 16148176.37 1.35
F test 403.23** 0.57** 6.14** 5.69** 0.92** 12.67** 0.28** 0.19** 48414125.21** 18.63**
Table 3. Estimates of genetic parameters to Ton characters cane per hectare (TCH), industrial cane fiber (%) (FIB), total soluble solids of the juice (%) (BRIX), Pol% broth (POL), reducing the broth Sugars (%) (RA), sucrose content (SAC), the glucose content (GLI), the fructose content (FRU) in broth color ICUMSA units pol and Ton per hectare (TPH). Harvested test at twelve
months of age sugarcane, Sinimbu-AL Plant, February 2012 to February 2013
Genetic parameters
Variables (%) (%) (%)
TCH 90.164 10.643 100.806 0.894 12.476 8.572 13.191 1.455
FIB 0.114 0.028 0.142 0.806 2.465 2.420 2.746 1.019
BRIX 1.461 0.074 1.535 0.952 6.019 2.701 6.170 2.229
POL 1.348 0.075 1.423 0.947 6.801 3.209 6.989 2.119
AR 0.194 0.035 0.229 0.848 29.312 24.840 31.898 1.180
SAC 2.797 0.371 3.168 0.883 9.501 6.916 10.110 1.374
GLI 0.060 0.011 0.071 0.845 28.916 24.737 31.450 1.169
FRU 0.041 0.008 0.049 0.833 30.540 27.300 33.451 1.119
COR 8066487.218 4037044.092 12103531.310 0.666 15.358 21.729 18.812 0.707
TPH 4.318 0.338 4.656 0.927 15.960 8.93 16.573 1.786
Genotypic variance ; environmental variance in terms of averages: ; phenotypic variance in terms of averages: ; Heritability in the broad sense in terms of averages: ; genetic variation coefficient: ); Coefficient of
environmental variation: ; phenotypic variation coefficient: ; Ratio between the coefficients of genetic / environmental variation: .
Table 2. Grouping of average values by Scott-Knott's method to 5% of the cultivars error probability for characters: ton of cane per hectare (TCH), industrial cane fiber (%) (FIB), total soluble solids of the juice (%) (BRIX), Pol% broth (POL), reducing the broth Sugars (%) (RA), sucrose content (SAC), the glucose content (GLI), the fructose content (FRU) broth color in ICUMSA units
and Ton inch per hectare (TPH), evaluated in an experiment conducted in Sinimbu-AL plant in crop year 2012/2013
Cultivar TCH (t/ha) FIB (%) BRIX (%) POL (%) AR (%) SAC (%) GLIC (%) FRU (%) COR (u.i.) TPH (t/ha)
RB92579 89.56 a 13.49 b 21.85 a 18.69 a 1.01 b 19.68 A 0.55 b 0.45 b 25014.50 a 16.73 a
RB99395 84.78 a 13.82 a 22.15 a 19.26 a 0.61 b 20.29 A 0.36 b 0.25 b 23915.25 a 16.32 a
RB867515 88.98 a 13.52 b 21.05 b 17.79 b 1.41 b 19.00 a 0.84 a 0.57 b 17229.75 b 15.82 a
RB951541 82.81 b 13.81 a 21.88 a 19.00 a 0.92 b 19.98 a 0.55 b 0.36 b 14942.25 b 15.74 a
RB931011 90.72 a 13.42 b 19.65 c 16.51 c 1.68 a 16.97 B 0.97 a 0.71 a 13243.00 b 14.97 b
RB98710 86.45 a 13.87 a 20.43 b 17.24 b 2.05 a 19.05 a 1.13 a 0.92 a 16329.50 b 14.91 b
RB931003 85.19 a 14.31 a 20.58 b 17.50 b 1.42 b 18.18 a 0.82 a 0.60 b 17457.00 b 14.89 b
RB72454 79.61 b 13.17 b 19.98 c 17.06 b 1.03 b 18.16 a 0.58 b 0.46 b 16542.75 b 13.59 b
RB93509 81.48 b 14.04 a 19.08 c 16.26 c 2.27 a 17.14 B 1.31 a 0.97 a 19631.25 b 13.23 c
SP81-3250 75.68 b 14.41 a 20.08 c 17.14 b 1.95 a 16.95 B 1.06 a 0.89 a 14368.50 b 12.98 c
Co997 77.16 b 13.87 a 19.38 c 16.41 c 1.28 b 16.91 B 0.64 b 0.64 b 20115.25 b 12.63 c
SP79-1011 70.55 c 13.97 a 21.00 b 17.77 b 1.90 a 17.15 b 1.03 a 0.87 a 17537.50 b 12.54 c
SP70-1143 66.52 c 14.06 a 21.53 a 18.25 a 1.71 a 19.04 a 0.96 a 0.75 a 18135.00 b 12.13 c
SP78-4764 71.40 c 13.99 a 19.95 c 16.89 b 1.58 a 17.48 b 0.95 a 0.64 b 19521.25 b 12.04 c
VAT90212 72.09 c 13.13 b 18.70 d 15.89 c 2.00 a 14.42 d 1.11 a 0.89 a 17063.50 b 11.46 d
Co331 76.07 b 13.42 b 18.03 d 15.02 d 1.69 a 15.80 c 0.97 a 0.72 a 20073.50 b 11.43 d
CB45-3 71.66 c 13.89 a 18.48 d 15.36 d 1.79 a 15.45 c 1.06 a 0.73 a 25284.50 a 10.97 d
RB75126 71.13 c 13.87 a 17.90 d 14.98 d 2.23 a 13.43 d 1.18 a 1.06 a 23042.75 a 10.69 d
SP71-6949 60.60 d 13.09 b 19.50 c 16.82 b 1.08 b 17.37 b 0.61 b 0.47 b 13741.00 b 10.22 d
RB83102 57.42 d 13.55 b 20.63 b 17.62 b 1.00 b 18.88 a 0.52 b 0.49 b 17889.50 b 10.15 d
SP71-1406 58.54 d 13.28 b 19.98 c 17.09 b 1.00 b 18.37 a 0.59 b 0.41 b 17281.75 b 10.00 d
Average 76.11 13.71 20.08 17.07 1.50 17.60 0.85 0.66 18493.30 13.02
QMR 42.57 0.11 0.29 0.30 0.14 1.48 0.04 0.03 16148176.37 1.35
F test 403.23** 0.57** 6.14** 5.69** 0.92** 12.67** 0.28** 0.19** 48414125.21** 18.63**
Table 3. Estimates of genetic parameters to Ton characters cane per hectare (TCH), industrial cane fiber (%) (FIB), total soluble solids of the juice (%) (BRIX), Pol% broth (POL), reducing the broth Sugars (%) (RA), sucrose content (SAC), the glucose content (GLI), the fructose content (FRU) in broth color ICUMSA units pol and Ton per hectare (TPH). Harvested test at twelve
months of age sugarcane, Sinimbu-AL Plant, February 2012 to February 2013
Genetic parameters
Variables (%) (%) (%)
TCH 90.164 10.643 100.806 0.894 12.476 8.572 13.191 1.455
FIB 0.114 0.028 0.142 0.806 2.465 2.420 2.746 1.019
BRIX 1.461 0.074 1.535 0.952 6.019 2.701 6.170 2.229
POL 1.348 0.075 1.423 0.947 6.801 3.209 6.989 2.119
AR 0.194 0.035 0.229 0.848 29.312 24.840 31.898 1.180
SAC 2.797 0.371 3.168 0.883 9.501 6.916 10.110 1.374
GLI 0.060 0.011 0.071 0.845 28.916 24.737 31.450 1.169
FRU 0.041 0.008 0.049 0.833 30.540 27.300 33.451 1.119
COR 8066487.218 4037044.092 12103531.310 0.666 15.358 21.729 18.812 0.707
TPH 4.318 0.338 4.656 0.927 15.960 8.93 16.573 1.786
Genotypic variance ; environmental variance in terms of averages: ; phenotypic variance in terms of averages: ; Heritability in the broad sense in terms of averages: ; genetic variation coefficient: ); Coefficient of