FREE PRIMARY EDUCATION FUNDING AS A PREDICTOR OF DROPOUT RATE IN PUBLIC PRIMARY
SCHOOLS IN KENYA: A CASE STUDY OF EMUHAYA SUB COUNTY
Joash Mark Olenja
Department of Educational Management and Foundations, Maseno University, Kenya
ARTICLE INFO ABSTRACT
Globally, countries have made major strides in education in increasing enrolment to achieve Universal Primary Education. In Kenya, the Government reintroduced Free Primary Education in 2003 to enhance access, retention, participation, progression and compl
Sabatia, Emuhaya and Hamisi Sub Counties were 1.8%, 1.6%, 2.5% and 1.4% respectively. In 2007, out of 7,967 pupils admitted in class I only 4,097 completed class 8 in 2014. This means that 48.83% of the pupils had dr
Primary Education funding and even after introduction of Free Primary Education funding the dropout rates experienced were still generally high. The objective of this study was to de
which Free Primary Education funding can predict dropout rate in public primary schools in Kenya. The study established that there was a strong negative relationship between Free Primary Education policy and dropout rates with coeffic
0.743, N=65, p <.05). It accounted for 54.4% of the variation in dropout rates. This means that increase in Free Primary Education funding reduced dropout rate by 54.4%. The study concluded th Free Primary Education policy had reduced dropout of pupils in public primary schools in Emuhaya Sub County. The study recommended that Free Primary Education fund be disbursed on time to schools.
Copyright © 2018, Joash Mark Olenja et al. This is unrestricted use, distribution, and reproduction in any medium,
INTRODUCTION
In 1948 The United Nations Declaration of Human rights proclaimed that education is a fundamental human right (World Bank, 1980). Every person has a claim to basic level of knowledge regardless of his /her social, economic or political status. This document set a stage for the rise of Free Universal Education Policies around the world in subsequent years. After decolonization, education moved to the top of nation’s post independence development agendas. Many governments in developing countries allocated much of their resources to education after independence as a means of eradicating poverty, for future development and catalyst for social economic and industrial development (Psacharopoulos Woodhall, 1985). Dropout is considered one of the key factors in wastage of human resources in terms of both students and teachers. Studies conducted in both developed and developing countries have confirmed that there are high dropout rates at primary level (World Bank, 2002). Primary school enrolment should be enhanced by improving on the indicators of school failures which include dropping out and poor quality of
*Corresponding author: Enose M.W. Simatwa,
Department of Educational Management and Foundations, Maseno University, Kenya.
ISSN: 0975-833X
Vol.
Article History:
Received 11th November, 2017
Received in revised form
07th December, 2017
Accepted 14th January, 2018
Published online 28th February, 2018
Citation: Joash Mark Olenja, Enose M.W. Simatwa primary schools in Kenya: A case study of emuhaya sub county Key words:
Free Primary Education Funding, Predictor,
Dropout Rate,
Public Primary Schools Emuhaya Sub County,
Kenya.
RESEARCH ARTICLE
FREE PRIMARY EDUCATION FUNDING AS A PREDICTOR OF DROPOUT RATE IN PUBLIC PRIMARY
SCHOOLS IN KENYA: A CASE STUDY OF EMUHAYA SUB COUNTY
Joash Mark Olenja, *Enose M.W. Simatwa and Maurice A. Ndolo
Department of Educational Management and Foundations, Maseno University, Kenya
ABSTRACT
Globally, countries have made major strides in education in increasing enrolment to achieve Universal Primary Education. In Kenya, the Government reintroduced Free Primary Education in 2003 to enhance access, retention, participation, progression and completion. In 2002 dropout rates in Vihiga, Sabatia, Emuhaya and Hamisi Sub Counties were 1.8%, 1.6%, 2.5% and 1.4% respectively. In 2007, out of 7,967 pupils admitted in class I only 4,097 completed class 8 in 2014. This means that 48.83% of the pupils had dropped out. In Emuhaya dropout rates were high before introduction of Free Primary Education funding and even after introduction of Free Primary Education funding the dropout rates experienced were still generally high. The objective of this study was to de
which Free Primary Education funding can predict dropout rate in public primary schools in Kenya. The study established that there was a strong negative relationship between Free Primary Education policy and dropout rates with coefficient of -0.743 which was significant at p value of 0.05 (r= 0.743, N=65, p <.05). It accounted for 54.4% of the variation in dropout rates. This means that increase in Free Primary Education funding reduced dropout rate by 54.4%. The study concluded th Free Primary Education policy had reduced dropout of pupils in public primary schools in Emuhaya Sub County. The study recommended that Free Primary Education fund be disbursed on time to schools.
is an open access article distributed under the Creative Commons medium, provided the original work is properly cited.
In 1948 The United Nations Declaration of Human rights proclaimed that education is a fundamental human right (World Bank, 1980). Every person has a claim to basic level of /her social, economic or political status. This document set a stage for the rise of Free Universal Education Policies around the world in subsequent years. After decolonization, education moved to the top of nation’s
post-Many governments in developing countries allocated much of their resources to education after independence as a means of eradicating poverty, for future development and catalyst for social economic and industrial development (Psacharopoulos and 1985). Dropout is considered one of the key factors in wastage of human resources in terms of both students and teachers. Studies conducted in both developed and developing countries have confirmed that there are high dropout rates at Bank, 2002). Primary school enrolment should be enhanced by improving on the indicators of school failures which include dropping out and poor quality of
dations, Maseno University,
education. For instance in 2002 Burkina Faso had a paltry 36% of pupils enrolled in grade one reaching grade five (ADB, 2006). While some regions, notably Latin America, the Caribbean and East Asia are on course to achi
access to Primary Education, other parts like sub
Africa have yet to realize the objectives of universal education for all. The progress has notably been sluggish on early childhood care and development. Governments are still for most part spending too little on primary education and ratio of pupils to teachers is over 50 in a large number of countries. Furthermore, there continues to be lack of data on such issues as efficiency suggesting an urgent need for more concerted efforts in this area (UNESCO, 2004b).
concerned with the relationship between inputs and output in education such as number of graduates. The internal efficiency of a school is a key determinant of the overall output in education. Lerotholi (2001) point out that internal efficiency of education system is revealed by grade promotion, the higher the grade promotion the better the system efficiency. Galabawa (2003) also describes internal efficiency as follows: the internal efficiency of the system concerns maximizing the relationship between inputs and outputs. Lerotholi (2001) concurs with the above citation and remarks that since internal efficiency is calculated on basis of repetition, dropout and
International Journal of Current Research
Vol. 10, Issue, 02, pp.66079-66091, February, 2018
Joash Mark Olenja, Enose M.W. Simatwa and Maurice A. Ndolo, 2018. “Free primary education funding as a predictor of
schools in Kenya: A case study of emuhaya sub county”, International Journal of Current Research, 10, (02), 660
FREE PRIMARY EDUCATION FUNDING AS A PREDICTOR OF DROPOUT RATE IN PUBLIC PRIMARY
SCHOOLS IN KENYA: A CASE STUDY OF EMUHAYA SUB COUNTY
Maurice A. Ndolo
Department of Educational Management and Foundations, Maseno University, Kenya
Globally, countries have made major strides in education in increasing enrolment to achieve Universal Primary Education. In Kenya, the Government reintroduced Free Primary Education in 2003 to etion. In 2002 dropout rates in Vihiga, Sabatia, Emuhaya and Hamisi Sub Counties were 1.8%, 1.6%, 2.5% and 1.4% respectively. In 2007, out of 7,967 pupils admitted in class I only 4,097 completed class 8 in 2014. This means that 48.83% opped out. In Emuhaya dropout rates were high before introduction of Free Primary Education funding and even after introduction of Free Primary Education funding the dropout rates experienced were still generally high. The objective of this study was to determine the extent to which Free Primary Education funding can predict dropout rate in public primary schools in Kenya. The study established that there was a strong negative relationship between Free Primary Education 0.743 which was significant at p value of 0.05 (r= -0.743, N=65, p <.05). It accounted for 54.4% of the variation in dropout rates. This means that increase in Free Primary Education funding reduced dropout rate by 54.4%. The study concluded that Free Primary Education policy had reduced dropout of pupils in public primary schools in Emuhaya Sub County. The study recommended that Free Primary Education fund be disbursed on time to
Commons Attribution License, which permits
education. For instance in 2002 Burkina Faso had a paltry 36% of pupils enrolled in grade one reaching grade five (ADB, 2006). While some regions, notably Latin America, the Caribbean and East Asia are on course to achieving Universal access to Primary Education, other parts like sub-Saharan Africa have yet to realize the objectives of universal education for all. The progress has notably been sluggish on early childhood care and development. Governments are still for st part spending too little on primary education and ratio of pupils to teachers is over 50 in a large number of countries. Furthermore, there continues to be lack of data on such issues as efficiency suggesting an urgent need for more concerted this area (UNESCO, 2004b). Internal efficiency is concerned with the relationship between inputs and output in education such as number of graduates. The internal efficiency of a school is a key determinant of the overall output in (2001) point out that internal efficiency of education system is revealed by grade promotion, the higher the grade promotion the better the system efficiency. Galabawa (2003) also describes internal efficiency as follows: the stem concerns maximizing the relationship between inputs and outputs. Lerotholi (2001) concurs with the above citation and remarks that since internal efficiency is calculated on basis of repetition, dropout and
INTERNATIONAL JOURNAL OF CURRENT RESEARCH
promotion rates, when dropout and repetition rates are high that portion of education system is said to have serious internal inefficiency. Internal efficiency is affected by various factors especially dropout, repetition, promotion, and cycle completion (Subedi, 2007). There are various factors which affect internal efficiency. This includes; availability of physical facilities, availability of instructional materials, family background, dropout and repetition, performance in national exterminations and utilization of teachers (Macharia, 2013). Attempts to introduce Free Primary Education in Kenya were first made in 1974 and later in 1979 with the aim of achieving free and universal primary education. In January 2003 Free Primary Education policy was ushered in by the National Rainbow Coalition as one of Campaign promises in its 2002 election Manifesto. All Public primary schools in Kenya received Ksh 1,020 per child per annum with the amount disbursed based on the number of pupils enrolled in a school (Ministry of Education Science and Technology, 2003). Its key concern was to improve internal efficiency by enhancing access, retention, quality and relevance, reversing declining enrolment rates at primary school, improving participation, progression and completion rates, reduction of burden of cost of education and implementing sector policy goals within education system (Republic of Kenya, 2005).
Dropout rate and repetition rates are key indicators of internal efficiency of education system. Free Primary Education is a government commitment to achieving universal primary education. This is in line with international commitments such as Education for All and also part of National Economic Strategy set out by Kenyan Government in the recent reforms (Republic of Kenya, 2005). The aim of providing Free Primary Education program was to provide more opportunities to disadvantaged school age children (Otach, 2008).The program created positive outcome because it resulted in significant increase in enrolment in majority of schools (Otach, 2008). The policy abolished school fees and other levies arguing that fees and levies posed a serious hindrance to children wanting to access education in schools (Otach, 2008). Free Primary Education fund comprised of an allocation equivalent to Ksh.1, 020 per child per annum with the amount disbursed based on the number of pupils enrolled in schools within that area (Republic of Kenya, 2003). The Ministry of Education Science and Technology gives guide lines on how the funds have to be used Republic of Kenya, 2003). The government sent money to schools per pupil which fall under two accounts: the school instructional material account grant and general purpose account grant. SIMBA account covers: textbooks, textbook maintenance, exercise books, supplementary readers, reference materials, pencil, duster, chalk, register’ chart and wall map. General purpose account covers: support staff wages, renovations, building of toilets, repair, maintenance and improvement of physical facilities, activity, local transport and travelling, electricity, water and conservancy and telephone box postage. Analysis of census report of 2009 show that the number of children out of school in formal education system was 6.7millions specifically they are about 2.1 million in pre-primary (3-5 years), 1.9 millions (6-13 years and 2.7 millions (14-17 years) (Republic of Kenya, 2010).
Study by Shahinsha (2010) found out that Pakistan was facing the challenge of universalization of primary Education. Government of Pakistan is trying to increase the net enrolment in Primary education but there are a lot of issues and problems. Poverty is the main problem of Pakistan and teachers confirm
that children drop out of school because parents believe that a child is more productive for them if she/he becomes an earning hand even when the government is providing free education. In Ghana the average rate of promotion, dropout and repetition were 90.85%, 6.0% and 3.2% respectively (UNICEF, 2006). Psacharopoulos and Woodhall (1985) conclude that dropout and repetition appear to be most common among students from families with low socioeconomic background and are more prevalent in rural than urban areas. This was mainly due to inadequate learning brought about by low quality of the factor inputs into the system (Hanushelk and WossMann, 2007). World Bank (2003) report that although Free Primary Education has enabled nearly all children to attend primary school in Lesotho there are high repetition rates especially in lower primary classes. In Zimbabwe, completion rates at primary school level have averaged 72% of a grade cohort since 1992, thus 28% of children initially enrolled in grade 1 did not complete all seven grades of primary school. Repetition rates are high at grade 5 and 6 (Ministry of Education, 2006). Nishimura et al. (2007) carried out a study to establish the status of dropout and repetition under Universal primary education policy in Uganda. They found that the probability of repetition was higher in public schools than in private schools. To them there was a possibility that capitation grant might make schools want to have as many pupils as possible to extent of increasing repeaters. Yang (2014) found that trend of primary education in relation to dropout rate of upper primary schools have indicated decreasing trend from 2009 to 2013.Long distance from home to school, family low standards of living, shortage of school facilities and involvement in family work were found to be major factors to student dropout that affects school internal efficiency.
Shahinsha (2010), the study investigated the causes of student’s dropout at primary level in Pakistan. He used descriptive research design while questionnaire and interviews were used to collect data. Study population was 100 primary school teachers. Data was analyzed using Chi-square. This study used Ex-post facto and descriptive research designs. Four instruments of data collection were used which include questionnaire, interview schedule, Focus Group Discussion and document analysis. Mwiria and Wamahiu (1995) assert that document analysis is the best method of accessing the valid information since it cannot create, waiver or withhold information required by researcher on data collections that ensure validation and triangulation of findings. The Study looked at drop out but did not look at how it has been influenced by Free Primary Education policy. McGregor (2007) found that 40% of South African students drop out of university in their first year. Financial difficulties among the country’s large poor black students are to blame. Students from low income, less educated families are the most likely to drop out. Ogada (2014) did his study on factors influencing dropout and repetition in primary schools in Kakamega Municipality. He found that grade dropout rates are on decline from 17.3% in 2004 to15.1% in 2010. Ojwang (2012) in his study on analysis of internal efficiency using non schooling gap and school based inputs in public schools in East Karachuonyo division note that grade wastage rates are generally high in upper classes. Nyae (2012) reveal that average dropout rates gradually increased from class one to class seven that is from 12.76% to 22.16%. The dropout rates for class seven and eight decreased to 10.33% in 2010. Kiplagat (2012) established that as a result of implementation of Free secondary education policy students were learning continuously and that cases of
dropout had declined significantly from 11.34% in 2004 to 4.26% in 2011. Studies by Ojwang (2012), Nyae (2012), and Kiplagat (2012) did not focus on influence of free primary education policy on dropout rate. This is the gap in knowledge that this study intended to fill.
Research Objective
The research objective was: to determine the extent to which Free Primary Education funding can be used to predict dropout rate in public primary schools in Emuhaya Sub County.
Synthesis of literature on influence of free primary education funding on dropout rate in public primary schools
Considerable amount of research has been done on issue of school wastage in developed countries. Studies carried out by the State University (2002) indicate that dropout rates differ by various demographic factors including gender, race and ethnicity, Immigration status and geographical location. According to report by OECD (2011), in Britain more teenage dropout than other developed nations as poor children were edged out of school by those from sharp able families. It established further that one out of five (20%) currently leave school at 16 before taking A-level style qualification examination. Shahinsha (2010) note that in Pakistan cultural values, shortage of teachers and lack of community involvement is the reason for dropout at primary school level. South Africa Basic Education (2011) carried out a household Survey and found that dropout rate before grade 9 was 1% in grade 1 and 3 and less than 1% in grade 2 and 4. From grade 5 to 8 the dropout rate was between 2% and 4%. Low dropout rates in lower grades was uniform with high enrolment rates in grade 3. Dropout rates however increased from grade 10 to 11 reaching 2%. In total 10% of learners who had been enrolled in grade 9 to 11 dropped out of school between 2007 and 2008.This was after introduction of Universal Primary Education. However this study did not focus on how free primary education policy has influenced dropout rates. In Uganda study done by Nishimura (2005) found that universal primary education has decreased delayed enrollments and increased grade completion up to the fifth grade and its effects especially large among girls in poor households. Yang (2010) also reveals that in Uganda educational status of parent and lack of educational awareness of parent have impacts on internal efficiency. Children whose parents have low educational status normally drop out of school. Therefore low academic levels of parent contribute negatively to internal efficiency of primary school. Free Primary Education program in Kenya has lead to increase in net enrolment from 79.8% in 2002 to 88.2% in 2014. Gross enrolment rate has also increased tremendously from 93% in 2002 to 103.5% in 2014 (Economic Survey, 2014). According to economic survey (2004, 2006, 2008, 2010, 2013, 2014), percentage of pupils who are still in the system or have dropped out is 33.26%, 29.10%, 26.12%, 23.80% and 31.50% in 2010, 2011, 2012, 2013 and 2014.
Wastage rates are associated with drop out and repetition. These rates vary from region to region (Abagi et al, 2001). UNESCO (2010) felt that dropout phenomena largely drains the government and society as a whole a lot of resources in terms of funds, teaching and equipment. It also implies inefficiency in use of resources in terms of funds, teaching and
equipment. Dropouts are considered waste because each school cycle is taken as an entity which should be attended in its totality if the pupil is to reach a certain level of competency (Barasa, 2003). Musyimi (2011) did a case study on wastage rates in Kenya secondary schools in Kachonzweni District, Makueni County. The study was conducted using descriptive survey design. The sample size was 18 secondary schools. Data was collected using proforma. The study established that dropout rates after introduction of Free Secondary Education was 24.1% in form 3 and 4 for boys and 22% for girls. These rates were high compared to other classes. The study further revealed that causes of dropout were; lack of family support, lack of interest, indiscipline, peer pressure, poor performance, sickness, teenage pregnancy and early marriages. The study was done in secondary schools. Study by Comboni Missionaries Kenya (2012) established that Turkana District register one of the lowest gross enrollment, retention and completion in the County. Out of 33% of children of age 5-10 that start schooling 69.2% drop before finishing primary school. Data was analyzed using percentages. The study did not look at influence of Free Primary Education policy on dropout rate.
Ogada (2014) while focusing on factors influencing drop out and repetition in public primary schools in Kakamega municipality used descriptive survey design, study population 25 head teachers, 457 teachers, 1548 standard eight pupils, 25 dropouts and 1 sub county quality standard assurance officer .Sample size was 23 head teachers, 115 teachers, 480 pupils, 25 dropouts and one sub county quality assurance standard officer. Instruments used were only questionnaire and in depth interview. Data was analyzed using descriptive statistics. The findings showed that grade dropout was generally found to be on downward trend from 17.3% in 2004 to 15.1% in 2010.Their was high enrolment in year 2005 and 2007 followed by low enrolment in 2006 and 2008 resulted in negative dropout rates in the year2006 and 2008. Dropout rates are high in grade 2 and 3 at 18.0%. Pupils who had dropped out of school alluded that poor parental (22.95%), child labor (19.67%), peer influence (18.03%) and death of parents (14.75%) made them drop. Ojwang (2012) in his study on Analysis of internal efficiency using non schooling gap and school based inputs in public primary schools in East Karachuonyo division used descriptive survey design. Target population consisted of 90 head teachers, 553 Assistant teachers and 5 Assistant education officers. A sample of 36 head teachers, 216 assistant teachers and 5 assistant education officers were used. Questionnaires, interview schedule and observation checklist were used to collect data. Data was analyzed using descriptive statistics and cohort analysis. The study found that actual survival rates were higher in lower classes and reduced in upper classes and further declined as pupils move to class 7 and 8. Nyae (2012) while using weighted average in Kubo Division of Kwale reveal that average dropout rates gradually increased from class one to class seven that is from 12.76% to 22.16% respectively. The dropout rates for class seven and eight decreased to 10.33% from highest 22.16% between class six and seven. The study also found that the main factors that influenced dropout were poor performance, pregnancy and early marriages. Other factors include poverty, drug abuse, child labor and repetition.
positive influence on access, Survival and graduation rates though girls still lagged behind boys. There was increase in enrolment in the sub county for both boys and girls after introduction of free primary education policy which was characterized by decline in enrolment as boys and girls move to upper primary level, free primary education enhanced survival in public primary schools in that through re-entry policy many girls who drop out of school had got a second chance to pursue their education thus increase in survival rate. Data was analyzed using descriptive statistics and cohort analysis. To measure influence descriptive statistics was not suitable therefore he could have used inferential. In addition the study did not look at how Free Primary Education policy had influenced dropout rates. Kiplagat (2012) established that as a result of implementation of free secondary education policy students were learning continuously and that cases of dropout had declined significantly from 11.34% in 2004 to 4.26% in 2011.Cases of girls who had dropped out of school due to early pregnancy and marriage were able to come back to school and continue with learning. Cases of child labor had also significantly reduced. This study agrees with findings by Ogada (2014) that child labor as a factor contributed to dropout. Nyamesa and Chemwai (2013) carried out a study on dropout among pupils in rural primary schools in Nandi North District. They found that grade dropout rate was highest for boys in grade six at 4% and lowest in grade 8 at 1.8%. For girls it is highest at second grade at 6% and lowest at grade three. The findings indicated that teenage pregnancy, chronic repetition, family size, lack of trained teacher counselors and early marriages were the main causes of school dropout in Nandi North. It further pointed out that factors leading to dropout differ among girls and boys.
Sang (2009) conducted a research on factors influencing dropout in secondary schools in Nandi district using descriptive survey. Study population was 15658 students. The study established that poor performance, school fees, indiscipline and pregnancy were the main factors that influenced dropout. Ngeno (2015) in her study on influence of free secondary education policy on gender parity, repetition, dropout, wastage and student’s academic achievement in Kericho County, found that there was a weak negative relationship between free secondary education Policy and dropout and it a accounted for 0.16% variation in dropout rates. Interview findings revealed that free secondary education did not have much influence on dropout rates. This study concurs with study by Kiplagat that free secondary education had reduced dropout rates but both studies focused on Free Secondary Education. Makokha (2016) in his study on Effects of Free Tuition Secondary Education On access, completion rate and quality of education in public secondary schools in Emuhaya Sub county found that FTSE policy had a positive effect on access since the number of students accessing Secondary improved, FTSE policy had a positive effect on completion rate. He also found that indiscipline among students, death of parents and early pregnancy among girls were the main factors causing dropout in secondary schools in Emuhaya. This study did not look at how free primary education had an effect on repetition rate and a gain the study was done in public secondary schools. This study is different since it focused on Free Primary Education policy. Study by Musyimi (2011), Comboni Missionaries (2012), Ojwang (2012), Nyae (2012), Ogada (2014), Kiplagat (2012), Nyamesa and Chemwai (2013) and Ngeno (2015) and Makokha (2016) did not focus on influence of free primary education policy on
dropout rate. This is the gap in Knowledge that this study sought to fill.
Conceptual framework
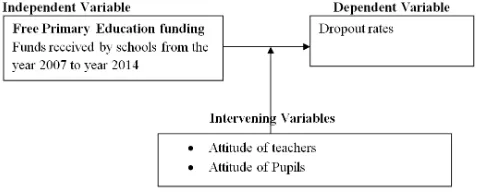
[image:4.595.314.553.424.520.2]This study was based on conceptual framework which is an input-output model propagated by Psacharopoulos and Woodhall (1985). According to the model there is a relationship between inputs and output into education system. Conceptual framework postulates that free primary education policy influences dropout rates, repetition rates and coefficient of efficiency. The independent variable in this study is free primary education policy. Free primary education policy was looked at in terms of the money the government sends to schools from the year 2007 to the year 2014 which fall under two accounts: the School Instructional Material Account Grant and General Purpose Account grant. The Framework shows the various vote heads under which free primary education funds are spent. School Instructional Material Account Grant account covers: textbooks, textbook maintenance, exercise books, supplementary readers, reference materials, pencil, duster, chalk, register’ chart and wall map. General Purpose Account covers: support staff wages, renovations, building of toilets, repair, maintenance and improvement of physical facilities, activity, local transport and travelling, electricity, water and conservancy and telephone box postage. Conceptual framework helped to focus on the variables of the study. The framework supposes that with introduction of Free Primary Education all pupils who enroll at primary level of education remain in school to learn and complete primary level of education within the required time.
Figure 1. Influence of Free Primary Education Funding on Dropout Rate in Public Primary Schools in Emuhaya Sub County
MATERIALS AND METHODS
The study adopted Ex-post facto, descriptive survey and correlation research designs. Study population included 89 Head teachers, 1 Sub County Quality Assurance Standards Officer and 3490 class 8 pupils. Sample size of 73 head teachers, 73 class teachers and 359 pupils was used. Saturated sampling was used to select Sub County Quality Assurance Standards Officer. Questionnaire, interview schedule, document analysis and focus group discussion were used to collect data. Content validity of the instruments was determined through the help of Supervisors. Reliability was established through test-retest method using 16 schools. Data obtained from pilot study was correlated using Pearson r at alpha level 0.05. Reliability index for head teachers’ and class teachers’ questionnaires were 0.72 and 0.76 respectively. Since they were higher than 0.70, the instruments were considered reliable. Quantitative data was analyzed using frequency counts, means, cohort analysis, correlation and regression. Qualitative data was transcribed and reported.
RESULTS
Demographic Characteristics of Respondents
This section provides the characteristics of respondents in relation to gender, highest professional qualification and experience in leadership.
Head teachers
[image:5.595.304.562.225.340.2]This has been presented in table form and provides the characteristics of head teachers in relation to gender, highest professional qualification and experience in leadership.
Table 1. Demographic Characteristics as indicated by Head teachers (n = 65)
Demographic Characteristics Frequency (F) Percentage (%) Gender
Male 53 81.54
Female 12 18.46
Total 65 100.00
Highest Professional Qualifications
PhD 0 0.00
M.ED 2 3.08
B.ED 18 27.69
Diploma 6 9.23
PI 39 60.00
Total 65 100.00
Headship experience in current school
1-5 years 8 12.31
6-8 years 34 52.31
Above 8 years 23 35.38
Total 65 100.00
Source: Field data
Key: Phd = Doctor of Philosophy, M.ED Master of Education, B.ED = Bachelor of Education, PI = Primary Teacher Certificate
Table 1 shows that 65 (100%) head teachers involved in the study 53(81.54%) were male while 12 (18.46%) were female. This shows that few female teachers are appointed as head teachers in Emuhaya Sub County. This is in agreement with the study carried out by Odhiambo (2014) where it was indicated that out of 20 sampled head teachers 19 (95.0%) were male while 1(5.0%) were female. Concerning highest professional qualification for head teachers 2 (3.08%) had masters degree, 18 (27.69%) holds Bachelors of Education, 6 (9.23%) holds Diploma in Education while 10 (60.00%) holds primary teacher certificate in Education. Head teacher experience in current school indicate that 8 (12.31%) had experience of between 1-5 years, 34 (52.31%) had an experience of 6-8 years while 23(35.38%) had an experience of more than 8years. This findings are in agreement with a study carried out by Ngeno (2015) where it was indicated that out of 40 sampled school principals one (2.5%) had headship experience between 1-5 years,12 (30%) had an experience of 6-10 years, 17(42.50%) had an experience of 11-15 years while 10 (25.00%) had an experience of 16-20years.This implies that in this study Head teachers had enough experience on management and they were able to give important information on dropout rate and repetition rate in Emuhaya Sub County. Head teachers with experience can be relied on for the authenticity of data collected Ngeno (2015).
Class Teacher
Table 2 shows that 50 (76.92%) of the class teachers involved in the study were males and only 15 (23.08%) were females. On highest professional qualification 20 (30.77%) of class
[image:5.595.35.289.238.401.2]teachers hold a degree in Bachelor of Education, 7(10.77%) held Diploma in Education and 38(58.46%) held Primary teacher certificate in Education. This means that the class teachers are well trained and have the necessary knowledge required to enhance internal efficiency in public primary schools in relation to drop out and repetition in Emuhaya Sub County. According to Robbins (2003) the technical, human and conceptual skills gained in training will enable class teachers and head teachers in understanding issues related to dropout and repetition. Experience gained by class teachers should make them understand educational policies better
Table 2. Demographic Characteristics as indicated by Class teachers (n=65)
Demographic Characteristics Frequency (f) Percentage (%) Gender
Male 50 76.92
Female 15 23.08
Total 65 100.00
Highest Professional Qualifications
PhD 0 0.00
M.ED 0 0.00
B.ED 20 30.77
Diploma 7 10.77
PI 38 58.46
Total 65 100.00
Source: Field data
Research Question
The research question responded to was: To what extent can Free Primary Education funding be used as a predictor of dropout rates in public primary schools in Emuhaya Sub County?
Table 3. Flow Chart showing Flow of 1995 Cohort
Year 1 2 3 4 5 6 7 8 Graduates
1995 E 4076
R 200
N 0
1996 E 4120 3682
R 172 341
N 0 124
1997 E 3608 3363
R 199 326
N 76 102
1998 E 3411 3086
R 206 341
N 102 79
1999 E 3297 2774
R 210 420
N 87 211
2000 E 2961 2335
R 201 465
N 101 103
2001 E 2801 1856
R 262 474
N 100 120
2002 E 2647 1598 1590
R 270 269
N 89 23 2530
2003 E 2530
R 157
N 110
[image:6.595.174.419.389.477.2]Source: Field Data KEY: E – Enrolment R – Repeater N-New pupils
Table 4. Dropout Rates in Emuhaya Sub County between 1995-2002 before Free Primary Education Funding
Year Class Dropout rate (%)
1995-1996 1-2 0.06
1996-1997 2-3 2.53
1997-1998 3-4 1.40
1998-1999 4-5 2.87
1999-2000 5-6 4.61
2000-2001 6-7 5.97
2001-2002 7-8 4.08
[image:6.595.101.491.502.791.2]Average dropout rate 3.07
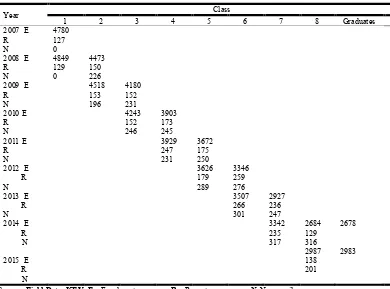
Table 5. Flow Chart showing Flow of 2007 Cohort
Year Class
1 2 3 4 5 6 7 8 Graduates
2007 E 4780
R 127
N 0
2008 E 4849 4473
R 129 150
N 0 226
2009 E 4518 4180
R 153 152
N 196 231
2010 E 4243 3903
R 152 173
N 246 245
2011 E 3929 3672
R 247 175
N 231 250
2012 E 3626 3346
R 179 259
N 289 276
2013 E 3507 2927
R 266 236
N 301 247
2014 E 3342 2684 2678
R 235 129
N 317 316
2987 2983
2015 E 138
R 201
N
Source: Field Data KEY: E – Enrolment R – Repeater N-New pupils
Table 6. Dropout Rates in Emuhaya Sub County after Free Primary Education Funding for 2007-2014
Year Class Dropout rate (%)
2007-2008 1-2 0.30
2008-2009 2-3 2.91
2009-2010 3-4 0.30
2010-2011 4-5 1.05
2011-2012 5-6 0.93
2012-2013 6-7 4.49
2013-2014 7-8 3.16
Average Dropout Rate 1.88
[image:7.595.35.294.240.344.2]Source: Field data
Table 7. Comparison of Dropout Rate before and after Free Primary Education Funding in Emuhaya Sub County for 1995
and 2007 Cohorts
Class
Dropout rates before Free Primary Education (%)
Dropout rates after Free Primary Education (%)
1-2 0.05 0.30
2-3 2.53 2.91
3-4 1.40 0.30
4-5 2.87 1.05
5-6 4.61 0.93
6-7 5.97 4.49
7-8 4.08 3.16
Average Dropout Rate 3.07 1.88
Source: Field data
Table 7 shows that dropout rates before Free Primary Education were ; 0.05%, 2.53%,1.40%, 2.87%, 4.61%, 5.97% and 4.08% for classes 1-2, 2-3, 3-4, 4-5, 5-6, 6-7 and 7-8 respectively. After Free Primary Education funding was introduced the number of pupils dropping out in classes 1, 2 and 3 increased while dropout rate reduced in classes 4,5,6 and 7. Overally the average dropout rate reduced after introduction of free primary education. These findings agree with those of Ogada (2014) who found that dropout rates were high in grade 2 and 3 at 18.0%.
Pupils who had dropped out of school alluded that poor parental (22.95%), child labor (19.67%), peer influence (18.03%) and death of parents (14.75%) made them drop.To establish the extent to which Free Primary Education funding can predict dropout rates in public primary schools in Emuhaya Sub County Head Teachers and Class Teachers
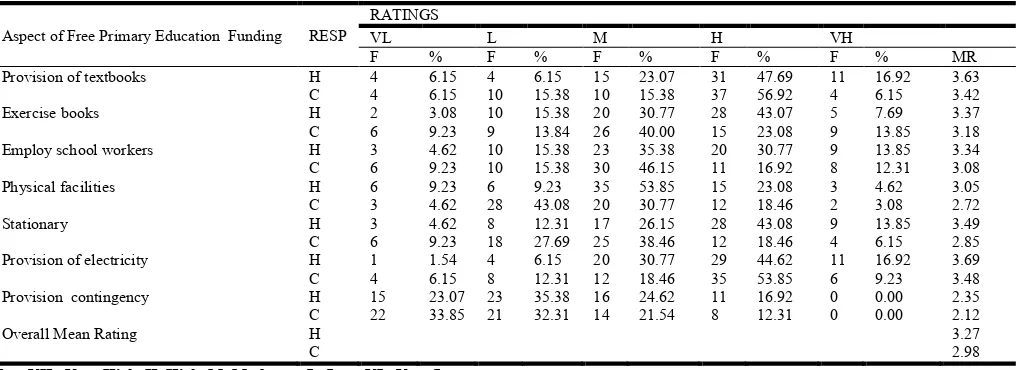
ratings of factors that influenced dropout rate were computed (Table 8).
Interpretation of Mean Rating:
1.00-1.44 = Very Low, 1.45-2.44 =Low 2.45-3.44 =Moderate 3.45-4.44 =High 4.45-5.0 =Very High
From Table 8, it can be observed that free primary educating funding had a moderate influence on dropout rate as signified by the mean rating of 2.98.
Table 9. Cumulative Dropout Rates in Emuhaya Sub County per School Based on 2007 Cohort
Dropout Rate (%) Frequency Percentage
0.00 -9.99 4 6.15
10.00-19.99 37 56.92
20.00-29.99 24 36.92
Total 65 100.00
Source: Field data
Table 9 shows dropout rates in Emuhaya Sub County as given by Head teachers in 65 public primary schools. Four (6.15%) had dropout rates ranging between 0.00% and 9.99%, thirty seven (56.92 %) between 10.00% and 19.99%. Twenty four (36.92 %) between 20.00% and 29.99%). Free Primary Education funds received per school for the 2007 cohort in eight years were used to determine influence of Free Primary Education policy on dropout rates.
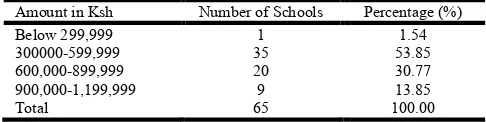
From Table 10, one school (1.54%) received less than Ksh299, 999. Thirty five schools (53.85%) received between Ksh 300, 000 and Ksh 500,000. Twenty schools (30.77%) got between Ksh 600,000 and Ksh 899,999 while nine schools (9%) got between Ksh 900,000 and Ksh1, 199,999. Dropout rates per
school and Free Primary Education funds received shown in Table 9 and Table 10 were correlated in order to obtain the strength and direction of the relationship and results tabulated as in Table 11. From Table 11 results showed that there was a strong negative relationship between Free Primary Education funding and dropout rates as signified by Pearson’s correlation coefficient of -0.743.This relationship was statistically
Table 8. Influence of Free Primary EducationFunding on Dropout Rates as rated by Head teachers and Class teachers
Aspect of Free Primary Education Funding RESP
RATINGS
VL L M H VH
F % F % F % F % F % MR
Provision of textbooks H 4 6.15 4 6.15 15 23.07 31 47.69 11 16.92 3.63
C 4 6.15 10 15.38 10 15.38 37 56.92 4 6.15 3.42
Exercise books H 2 3.08 10 15.38 20 30.77 28 43.07 5 7.69 3.37
C 6 9.23 9 13.84 26 40.00 15 23.08 9 13.85 3.18
Employ school workers H 3 4.62 10 15.38 23 35.38 20 30.77 9 13.85 3.34
C 6 9.23 10 15.38 30 46.15 11 16.92 8 12.31 3.08
Physical facilities H 6 9.23 6 9.23 35 53.85 15 23.08 3 4.62 3.05
C 3 4.62 28 43.08 20 30.77 12 18.46 2 3.08 2.72
Stationary H 3 4.62 8 12.31 17 26.15 28 43.08 9 13.85 3.49
C 6 9.23 18 27.69 25 38.46 12 18.46 4 6.15 2.85
Provision of electricity H 1 1.54 4 6.15 20 30.77 29 44.62 11 16.92 3.69
C 4 6.15 8 12.31 12 18.46 35 53.85 6 9.23 3.48
Provision contingency H 15 23.07 23 35.38 16 24.62 11 16.92 0 0.00 2.35
C 22 33.85 21 32.31 14 21.54 8 12.31 0 0.00 2.12
Overall Mean Rating H 3.27
C 2.98
Key:VH= Very High, H=High, M=Moderate, L=Low, VL=Very Low.
[image:7.595.308.555.247.300.2] [image:7.595.46.555.513.698.2]significant since 0.000 is less than 0.05 the p
set. This means that increase in Free Primary Education funding led to decrease in dropout rates. The relationship between Free Primary Education funds and dropout rate is illustrated in a scatter plot (Figure 1).
Table 10. Free Primary Education Funds received by Primary Schools for 2007 Cohort
Amount in Ksh Number of Schools
Below 299,999 1
300000-599,999 35
600,000-899,999 20
900,000-1,199,999 9
Total 65
[image:8.595.40.283.156.217.2]Source: Field data
Table 11. Influence of Free Primary Education Funds on Dropout Rates in Public Primary Schools in Emuhaya Sub County
Free Primary Education Funding Pearson’s (r)
Sig (2-tail) N
Figure 4.1. Scatter Plot showing the Relationship between Free Primary Education Funding and Dropout Rates
From Figure 1, it shows that there is a negative relationship between Free Primary Education funding and dropout rates. The diagram helped in getting the direction of the relationship. Regression line drawn show that R2 = 0.551 which mean Free Primary Education funding accounted for 55.1% variation in dropout rates. Linear Regression analysis was done to measure the level of influence as shown in Table 12 below. Adjusted R Square which is free from any error was used to measure the level of influence.
Table 12. Model Summary (Influence of Free Primary Education Funds on Dropout Rates in Public Primary Schools in Emuhaya
Sub County)
Model R R square Adjusted R
square
Standard error of the
[image:8.595.41.285.268.455.2]1 0.743 0.551 0.544
Table 13. Analysis of Variance
Model Sum of
squares
Df Mean
squares
1 Regression 0.077 1 0.077
Residual 0.063 63 0.001
Total 0.140 64
a. Dependent variable: Dropout rate b. Predictor: Free Primary Education funds
66086 Joash Mark Olenja et al. Free primary education funding as a predictor of dropout rate in public primary schools in
significant since 0.000 is less than 0.05 the p-value that was e in Free Primary Education funding led to decrease in dropout rates. The relationship between Free Primary Education funds and dropout rate is
Free Primary Education Funds received by Primary
Percentage (%) 1.54 53.85 30.77 13.85 100.00
Influence of Free Primary Education Funds on Dropout Rates in Public Primary Schools in Emuhaya Sub County
Dropout Rate -0.743
0.000 65
Scatter Plot showing the Relationship between Free Primary Education Funding and Dropout Rates
From Figure 1, it shows that there is a negative relationship between Free Primary Education funding and dropout rates. tion of the relationship. = 0.551 which mean Free Primary Education funding accounted for 55.1% variation in dropout rates. Linear Regression analysis was done to measure own in Table 12 below. Adjusted R Square which is free from any error was used to measure the
Model Summary (Influence of Free Primary Education Funds on Dropout Rates in Public Primary Schools in Emuhaya
Standard error of the estimate 0.316252
Analysis of Variance
F Sig
77.416 0.000
From Table 12 it can be noted that Adjusted R square (Coefficient of determination (R
Free Primary Education funds accounted for 54.4% in dropout rates.
Table 13 shows that Free Primary Education fund is a significant predictor of dropout rates. This means that Free Primary Education policy can be relied on to explain influence of Free Primary Education funding on dropout rates
of variance confirmed that Free Primary Education is a significant predictor of dropout rates because most children were dropping out because they were unable to pay fees but now that the government pays their school fees it is possible to know if they will drop out or not because one of the reasons of dropping out has been removed.
Table 14. Simple Linear Regression Analysis of Influence of Free Primary Education on Dropout Rates
Model B Std
error
1 Constant 0.290 0.012
Free Primary Education fund
-1.691E-0.007
0.000
a. Dependent variable: Dropout rate
b. Independent variable: Free Primary Education funds
Table 14 shows the actual influence. It
one unit increase in Free Primary Education funds there will be a decrease of 1.691 in dropout rate. The objectives of Free Primary Education were to enhance retention, participation and completion.
DISCUSSION
High dropout rates were noted between class 6 and seven and between class seven and eight where 449 pupils dropped out of school for every10, 000 pupils between class six and seven and 79 pupils dropped out of school for every2500 pupils between classes seven and eight. This i
classes therefore learners are under academic pressure to perform. Those whose academic performance is poor opt to drop out. The findings agree with findings by Musyimi (2011) who established that dropout rates after introduct
Secondary Education was 24.1% in form 3 and 4 for boys and 22% for girls. These rates were high compared to other classes. The study further revealed that causes of dropout were; lack of family support, lack of interest, indiscipline, peer pres poor performance, sickness, teenage pregnancy and early marriages. These findings agree with Basic Education Statistical Booklet (2014) which shows that high dropout rates are observed in last two classes of primary cycle with class seven recording 13.6% and class eight recording 23.1%. Head teachers interviews and Pupil Focus Discussions revealed that Free Primary Education is not the main factor in retaining children in school. They indicated that pupils still drop out because of early marriages, dr
pregnancy, parental disputes, lack of parental care, school levies and poor academic performance. These sentiments were echoed by Sub County Quality Assurance Officer who added that ‘‘early pregnancy was one of the causes of dropou
girls and motorbike operation among boys’’ These findings concur with study done by Nyae (2012) which revealed that pregnancy; early marriages, drug abuse and child labor are
ree primary education funding as a predictor of dropout rate in public primary schools in of emuhaya sub county
From Table 12 it can be noted that Adjusted R square (Coefficient of determination (R2) was 0.544. This meant that Free Primary Education funds accounted for 54.4% variation
that Free Primary Education fund is a significant predictor of dropout rates. This means that Free Primary Education policy can be relied on to explain influence of Free Primary Education funding on dropout rates. Analysis of variance confirmed that Free Primary Education is a significant predictor of dropout rates because most children were dropping out because they were unable to pay fees but now that the government pays their school fees it is possible to if they will drop out or not because one of the reasons of dropping out has been removed.
Simple Linear Regression Analysis of Influence of Free Primary Education on Dropout Rates
Standardized Coefficient
Untandardized Coefficient
Beta T Sig
23.208 0.000
-0.743 -11.897
a. Dependent variable: Dropout rate
b. Independent variable: Free Primary Education funds
Table 14 shows the actual influence. It shows that for every one unit increase in Free Primary Education funds there will be a decrease of 1.691 in dropout rate. The objectives of Free Primary Education were to enhance retention, participation and
re noted between class 6 and seven and between class seven and eight where 449 pupils dropped out of school for every10, 000 pupils between class six and seven and 79 pupils dropped out of school for every2500 pupils between classes seven and eight. This is because this is examination classes therefore learners are under academic pressure to perform. Those whose academic performance is poor opt to drop out. The findings agree with findings by Musyimi (2011) who established that dropout rates after introduction of Free Secondary Education was 24.1% in form 3 and 4 for boys and 22% for girls. These rates were high compared to other classes. The study further revealed that causes of dropout were; lack of family support, lack of interest, indiscipline, peer pressure, poor performance, sickness, teenage pregnancy and early marriages. These findings agree with Basic Education Statistical Booklet (2014) which shows that high dropout rates are observed in last two classes of primary cycle with class 3.6% and class eight recording 23.1%. Head teachers interviews and Pupil Focus Discussions revealed that Free Primary Education is not the main factor in retaining children in school. They indicated that pupils still drop out because of early marriages, drug abuse, poverty, early pregnancy, parental disputes, lack of parental care, school levies and poor academic performance. These sentiments were echoed by Sub County Quality Assurance Officer who added that ‘‘early pregnancy was one of the causes of dropout among girls and motorbike operation among boys’’ These findings concur with study done by Nyae (2012) which revealed that pregnancy; early marriages, drug abuse and child labor are
[image:8.595.299.568.270.341.2] [image:8.595.29.295.730.780.2]factors that cause dropout. Free Primary Education policy has reduced dropout rates. It means with introduction of Free Primary Education policy some factors that affected pupils have been removed for example fee problem has been removed hence those who could not pay school fees can now learn continuously. This finding agree with findings of Ngeno (2015) who found that in Kericho County dropout rates decreased after introduction of Free secondary education policy. These findings disagree with that of UNESCO (2009) which revealed that in Nicaragua and Guatemala dropout rates remained high at 52% and 35%.They concur with findings by Yang (2014) in Uganda which revealed that the trend of primary education in relation to dropout rate have indicated decreasing trend from 2009 to 2013. The findings also agree with Ogada (2014) which showed that grade dropout was generally found to be on downward trend from 17.3% in 2004 to 15.1% in 2010.There was high enrolment in year 2005 and 2007 followed by low enrolment in 2006 and 2008 resulted in negative dropout rates in the year 2006 and 2008.
Both rating of head teachers and class teachers is almost equal which implies that both the respondents agree that Free Primary Education policy has reduced dropout in public primary schools through provision of electricity and water conservancy. This may be because through provision of electricity the teachers are able to vary teaching methods through the use of information communication technology and media technology which makes learning interesting. Kimberly and Gamble (2001) in their study among people of Benin found out that there are many factors that influenced learning in schools. He noted that lack of facilities in schools such as water, electricity and enough workers negatively influenced learning. Heyneman and Stuardo (1978) found that in Chile inefficiency in schools was experienced due to inadequacy of textbooks and inability of poor children to buy books even when teachers wished to use them. Head teachers are administrators so they are in better position to know the influence provision of stationary before and after Free Primary Education policy. The difference may also be attributed to the fact that head teachers look at the strengths of Free Primary Education policy while for class teachers some may have concentrated on challenges of Free Primary Education since sometimes there is delay in disbursement of the funds to schools. Kamwitha (2015) in his study on school based factors influencing pupils’ wastage in public primary schools in Mwala Division found that provision of instructional materials influenced pupils to drop. This was reported by the repeaters, dropouts who resumed classes and also head teachers who noted that their schools did not have adequate instructional materials. This average rating by both head teachers and class teachers could be due to the fact that the exercise books provided may not be enough. In addition sometimes there is delay in disbursement of Free Primary Education funds and pupils have to buy exercise books. Head teachers said ‘‘Learners get four exercise books in a term against all the subjects they undertake, learners from poor families are not able to fill the gaps in order to continue with education. At the same time few exercise books and pencils are not enough to complete the term’’
This agree with the findings by Ananga (2011) that the cost of pen, pencils, copybooks, private coaching and school uniform remain a relative economic burden for poor household. Kadzamira and Rose (2003) concur that lack of money to buy essential school materials for children’s schooling is likely to
cause dropout. Mukundi (2004) noted that children from economically vulnerable families drop out due to lack of resources to pay for costs of education for their children that are not covered by Free Primary Education. The high rating by head teachers could be due to the fact that the head teachers have experience in financial management and are aware of the cost pupils had to cater for before introduction of Free Primary Education policy. The rating of head teachers and class teachers are not high. This may be attributed to the fact that physical facilities may not be adequate since Free Primary Education policy led to increase in enrolment and led to increase in and thus overcrowding in public primary schools. This agrees with study done by Ojwang (2012) whose findings showed that in East Karachuonyo more than half (65%) of sampled schools had inadequate physical facilities. In particular only 13(36.1%) schools had adequate classrooms. Head teachers said ‘‘There is inadequate funding i.e. amount allocated to sanitary towels is very low therefore many girls still have a challenge during menstruation which make be lured
by boda boda boys with small money leading to pregnancy
hence drop out” This agrees with findings by Lema (2005) who found that approximately one in ten school age African girls skip school during menstruation or dropout entirely because of lack of sanitation. Fawe (2004) also report that more than half of girls in upper primary schools in Kenya drop out of school because they lack sanitary pads. This concurs with findings of Owuor (2012) in Ndhiwa Sub County that inadequate menstrual management contributed to school dropout among primary school girls.
unable to afford school levies are in school and can be able to finish the cycle without leaving on the way’’. During interviews Sub County Quality Assurance and Standards Officer also said; ‘‘though dropout cases are still witnessed in Emuhaya many pupils who would have dropped out of school have survived due to Free Primary Education policy.’’ The finding concurs with that of US Department of Education (2011) which revealed that dropout rates had declined from 11% to 8%. It does not agree with house hold survey done in South Africa which revealed that dropout rates had increased to almost 12% in both grades 10 and 11. The findings agree with Yang (2014) who found that trend of primary education in relation to dropout rate of upper primary schools in Uganda had indicated decreasing trend from 2009 to 2013.Long distance from home to school, family low standards of living, shortage of school facilities and involvement in family work were found to be major factors to student dropout that affects school internal efficiency.
Again these findings agree with findings by Ngeno (2015) in her study in Kericho County where she established that there was a weak negative relationship between Free Secondary funding and dropout rates. This meant an increase in FSE funding led to decrease in dropout rate. FSE funding contributed to 0.16% variation in dropout rates. Similarly study by Kiplagat (2012) established that as a result of implementation of Free Secondary Education students were learning continuously and that cases of dropout had declined significantly from 11.34% in 2004 to 4.26% in 2011. A lot of factors leading to dropout were eliminated by Free Primary Education policy. For example pupils whose parents were unable to pay school fees were sent home and those who could not manage to pay the levies could drop out of school. Similarly pupils whose parents could not pay school levies were sent home continuously and this made them to perform poor in exams as a result they were forced to repeat. With continued repeating a pupil would opt to drop out of school. Before Free Primary Education funding pupils used to pay for tuition, personal emolument, electricity, water, local travel transport, activity and repair and maintenance. This meant that parents had a financial burden and pupils who could not afford to pay ended up dropping out of school. With introduction of Free Primary Education the government pays for tuition, personal emolument, electricity, water, local travel transport, activity and repair and maintenance. This mean parents have been relieved the burden of paying school fees therefore pupils can be in schools throughout without dropping out because of lack of fees.
Conclusion
Dropout rate reduced because, primary school education had been made affordable. The parents were now shouldering a less burden. Pupils equally were not being excluded from school, as exclusion was considered illegal.
Recommendation
Free Primary Education funding should be increased to make primary education more affordable to all Pupils of primary school going age of six years. This would make most requirements catered for parents would be left with the responsibility of providing only personal effects such as uniform and transport to and from school. This means that
amount allocated per pupil would be increased from 1,020/= in 2003 to 6,120/=
REFERENCES
Abadzi, H. 2007. “Absenteeism and Beyond: Instructional Timelossand Consequences,” Washington, DC: World Bank Policy Research Working Paper, No.4376. Retrieved on 24th July 2015 at 3p.m from http;//go.world bank.org.
Abagi, O. and Odipo, G. 1997. Efficiency of Primary Education in Kenya: Situational Analysis and Implications for Educational Reforms. IPAR Discussion Paper No.
00497/9. Nairobi: Regal Press
Abagi, O. and Olwenya, J. 1999. Educational Reform in Kenya for the Next Decade: Implementing Policies for Adjacent
and Revitalization. Nairobi: IPAR Report.
Abagi. O., Wagacha, M. and Kimuyu, P. 200. Kenya’s
Strategic Policies for the 21stC Macroeconomic and
Sectoral Choices. Nairobi: Institute of Policy Analysis and
Research.
Acholla, O. W. 2012. “Factors Influencing Drop Out Among Learners With Disability in Regular Primary School in Kisumu East District, Kenya.” Unpublished Master of Education Thesis, Maseno University.
Adeyemi, T.O. 2012. School Variables and Internal Efficiency in Ondo Estate, Nigeria: Education and Social Research Journal.
Ajwang, A. R. 2014. “Influence of Teacher Input on Pupils Academic Achievement in Public Primary Schools in Kakamega Municipality Kenya.” Master of Education Thesis. Maseno University.
AKinwumiji, A. 1995. Educational Planning Statistics and
Models. Ibadan Centre for External Studies.108-116.
Akinyi, H. O. 2011. “Assessment of Educational Wastage in Primary School in Flood Prone Areas of Nyando District, Kenya.” Unpublished Master of Education Thesis, Maseno University.
Alexander, R. 2008. Education for All, the Quality Imperative and Problem of Pedagogy. Brighton, UK, University of Sussex, Centre for International Education Access, (Create Pathways to Access Research Monograph, 20.
Ampiah, G. J. and Aduyeboah, C. 2009. Mapping the Incidence of School Drop Out: A Case Study of Communities in Northern Ghana. Comparative Education, 45(2): 219-232.
Ananga, E. 2011. Typologies of School Dropout: Dimensions and Dynamics of Exclusion from Universal Basic Education in Ghana. International Journal of Education
Development.
Ayodele, J. B. 200. Fundamental Systems Analysis in
Education. Lagos: Bola BayPublishers.
Bacolod, G. Marigee, P. and Ranjan, N. 2005. Why Children Work, Attend School or Stay Idle: the Roles of Ability and House Hold Wealth. Mimeo University of California-Irvine.
Barasa, E. N. 2003. “Analysis of Flow, Trends of Students in Secondary School Education in Funyula Division Busia District, Kenya.” Unpublished Master of Education Thesis. Maseno University, Kenya.
Basic Education Report. 2011. Educational Measurement, Assessment and Public Examination. Report on the
National Certificate of Examination Results. Republic of
South Africa. Government Printer.
Bii, N. and Nzevu, J. 201. Internal Efficiency and Performance: An Assessment of Secondary schools in