ISSN Print: 2169-2653
DOI: 10.4236/ojap.2018.74016 Dec. 25, 2018 309 Open Journal of Air Pollution
An Alternative Technique for Determining
Gravimetric Particle Mass Deposition on Filter
Substrate: The Particle Extraction Method
Charity Garland, Samantha Delapena, David Pennise
Berkeley Air Monitoring Group, Berkeley, CA, USA
Abstract
Airborne particulate matter (PM) filter sample processing is susceptible to error and can present issues associated with organizing samples, tracking da-ta, and maintaining weighing conditions. While filter weighing facilities should implement robust quality assurance and control checks to ensure that data collection is accurate and filter storage is secure, mistakes and accidents can still occur that compromise valuable data. This paper presents a novel approach to PM filter sample processing that allows for data validation or data recovery while ensuring data integrity. The technique approximates the original, unused pre-sampling weight of polytetrafluoroethylene (PTFE) fil-ters after PM collection to determine PM mass-deposition (MD). The method describes the extraction of PM loaded on PTFE filters via sonication in rela-tively non-toxic solvents, methanol and distilled water. The extraction me-thod is compared to the standard gravimetric PM MD determination meme-thod for a set of 265 PTFE filters with mean post-sampling filter mass of 116 ± 3.6 mg, mean estimated PM MD using the standard method of 367 ± 589 μg, and mean estimated PM MD using the extraction method of 371 ± 589 μg. A Deming regression comparison of the two methods yields a slope of 0.9983 and a Pearson’s r of 0.999. A Bland-Altman assessment of the percent and absolute differences between the two methods shows the limits of agreement between −32.5% and 25.5% and −61.9 and 50.1 µg, respectively. The 99% confidence interval of the mean difference in mass deposition between the two methods is −5.8 ± 4.5 µg. These data demonstrate that estimating
pre-sampling PTFE filter mass by extracting PM from sampled filters is a via-ble technique for gravimetric filter analysis. This method is of use in recover-ing pre-samplrecover-ing filter weights that have been lost, incorrectly measured, or otherwise compromised.
How to cite this paper: Garland, C., De-lapena, S. and Pennise, D. (2018) An Al-ternative Technique for Determining Gra-vimetric Particle Mass Deposition on Filter Substrate: The Particle Extraction Method. Open Journal of Air Pollution, 7, 309-321. https://doi.org/10.4236/ojap.2018.74016
Received: October 30, 2018 Accepted: December 22, 2018 Published: December 25, 2018
Copyright © 2018 by authors and Scientific Research Publishing Inc. This work is licensed under the Creative Commons Attribution International License (CC BY 4.0).
http://creativecommons.org/licenses/by/4.0/
DOI: 10.4236/ojap.2018.74016 310 Open Journal of Air Pollution
Keywords
PTFE Filters, Gravimetric Analysis, Particulate Matter, Particle Extraction, Gravimetry
1. Introduction
Gravimetric filter analysis, employing a pump and filter system for sample col-lection, is the gold standard method for measuring the mass concentration of particulate matter (PM) in air (Balakrishnan et al., 2015; Health and Safety Ex-ecutive (HSE), 1997; Rosa et al., 2014) [1][2][3]. The basis for this analysis is rooted in high precision (0.1 - 1 μg resolution) mass measurements of filter me-dia taken prior to and after sample collection. High-precision scales used for weighing filters must be operated in a highly controlled environment that is clean, demonstrates low static and vibration, and is temperature and humidity stable, to ensure consistency in scale performance and accuracy of the measure-ment. Moreover, the conditions must be well-matched between pre- and post-sampling filter mass measurements, which may be separated by several months and up to years, making these requirements potentially difficult to satis-fy. Additionally, filter data may be lost or compromised by incorrect mass mea-surements resulting from various issues including unstable scales, improper scale operation or calibration, or transcription errors. Large sample sets can be comprised of hundreds to thousands of filters and some erroneous mass mea-surements are likely to occur. While post-sampling filter mass meamea-surements can be repeated if filters are stored properly, there is currently no method for recovering lost or compromised pre-sampling filter mass measurements.
This study examines the efficacy of a particle extraction method used to ap-proximate the original, unused pre-sampling mass of commonly used polyte-trafluoroethylene (PTFE) filters used for collection of PM smaller than 2.5 µm in aerodynamic diameter (PM2.5), from primarily wood smoke sources.
2. Materials and Methods
DOI: 10.4236/ojap.2018.74016 311 Open Journal of Air Pollution and post-sampling flow rate of the pump (liters, L, per minute), multiplied by the duration of sampling (minutes). Dividing the PM mass (µg) by the known volume of air (converted from L to m3) passed through the filter results in an
average mass concentration of PM during the sampling period in terms of mass of PM per unit volume (µg/m3). The pump and filter method of sample
collec-tion and analysis is common and more detailed protocols exist (RTI Interna-tional, 2008; USEPA, 2017) [4][5].
Changes in filter mass unrelated to the PM mass collected during sampling, such as contamination or mass loss from filter handling and/or transport, are commonly accounted and corrected for by using field blank filters. These field blank filters generally number between 10% and 20% of the total number of sampled filters and are treated the same way as the sample filters, apart from sampling air, including all aspects of storage, transportation, and sample han-dling.
Particle extraction tests were performed on “traditional” pump and PTFE fil-ter samples of PM2.5 household air pollution (HAP) and personal exposure (PE)
from primarily wood fuel combustion from cook stoves in rural Lao People’s Democratic Republic (Lao PDR) (L. Drew Hill et al., 2015) [6]. A total of 265 fil-ters were analyzed by both the standard gravimetric method and the PM extrac-tion method proposed herein.
2.1. Materials
2.1.1. Filter SamplesFilter samples were collected on 37 mm diameter, 2 µm pore size PTFE filters with polymethylpentene (PMP) support rings (Pall Corporation). PM2.5 mass
deposited on the filter was determined gravimetrically by weighing the filters on an electronic microbalance with 0.1 µg resolution (Mettler Toledo XP2U, USA) (RTI International, 2008) [4]. All filters had known pre-sampling weights, dup-licate post-sampling weights to ensure accuracy, and post-extraction weights. Filter samples were:
1) 265 sample filters with primarily wood smoke PM2.5 deposition from HAP
and PE field samples. Of this group, six samples were excluded due to apparent incorrect pre-sampling weights, evidenced by negative mass depositions. An ad-ditional 28 filters were excluded that were below the extraction method’s limit of detection of 60 µg, which is described in Section 2.3.3,
2) 21 field blanks (handled similarly to the sample filters but not used for sampling),
3) Eight extraction blanks (filters taken directly from the package and not otherwise handled or sampled), and
4) Four lab-simulated filter samples loaded with wood smoke PM deposited using an air pollution chamber.
2.1.2. Extraction Materials
DOI: 10.4236/ojap.2018.74016 312 Open Journal of Air Pollution Digital Ultrasonic Cleaner). Filters were sonicated in 50 mL glass beakers, cov-ered with 5 cm watch glasses. Methanol (ACS reagent, ≥99.8%) and distilled wa-ter were used as extraction solvents.
2.2. Particle Extraction
While there is limited literature on the extraction of PM from filter media, one of the few relevant experiments analyzed the extraction efficiency of wood smoke particulates from PTFE coated glass-fiber filter media using various sol-vents. This study demonstrated that the highest mass recovery of PM resulted from the use of methanol (MeOH) as the solvent (Williams et al., 1988) [7]. Thus, our initial trials of PM extraction from PTFE filter substrate were com-pleted using MeOH.
Early tests of extraction efficiency and pre-sampling filter weight estimates were completed using lab-simulated filter loadings of three to six milligrams of PM on PTFE filters using an air pollution chamber containing smoke from wood combustion. The MD was determined using the post-sampling mass and both the original pre-sampling and post-extraction filter masses. The average MD derived from the two methods was found to be within 0.4% of one another (N = 4). Extraction times were tested to optimize time and extraction effective-ness by comparing post-extraction filter mass and pre-sampling filter mass agreement. Post-extraction filter-mass reached a floor after three 150-second so-nication baths, two completed in pure MeOH followed by one in pure distilled water. The first two baths in 30 mL of fresh MeOH removed all visible PM depo-sited on the filter. The third sonication bath in fresh distilled water was intended to remove any water-soluble PM material that remained on the filter. Following the final water bath, filters were briefly immersed in fresh MeOH, to expedite drying, and placed in partially covered petri dishes. Filter conditioning duration was tested by mass measurements taken every 24 hours over four days. No changes in mass were observed after 48 hours, therefore conditioning in a hu-midity and temperature-controlled room lasted at least 48 hours. Once condi-tioned, the post-extraction filter mass was determined gravimetrically. All filters were treated using this particle extraction protocol.
The detailed protocol is as follows:
1) Equilibrate filters to room temperature from the refrigerator or freezer for approximately 45 minutes to reduce the risk of tearing;
2) Fill sonicator half full of water; 3) Place 50 mL beakers in sonicator; 4) Add 30 mL of MeOH to each beaker;
5) Place filter PM side down in beaker and sonicate for 75 seconds; 6) Flip the filter over with forceps and sonicate for another 75 seconds; 7) Remove filter and replace used MeOH with 30 mL of fresh MeOH; 8) Sonicate the filter in both orientations for 75 seconds each;
DOI: 10.4236/ojap.2018.74016 313 Open Journal of Air Pollution 11) Remove filter and dip in fresh MeOH bath;
12) Place filter in slightly ajar petri dish and let dry and condition in a clean, temperature and humidity-controlled room for at least 48 hours;
13) Weigh filter according to typical weighing protocol.
2.3. Data Handling
2.3.1. Blank Filter Processing
While developing this method, unused filters underwent the extraction protocol to determine whether there was filter mass loss solely due to the extraction me-thod. Eight extraction blanks were conditioned for 48 hours in a temperature and humidity-controlled room and then weighed prior to extraction. Extraction of new filters resulted in a loss, on average, of 21± 13 µg. Since PTFE is not so-luble in methanol it is possible that the new filters contain residue that was re-moved during extraction. Research Triangle Institute (RTI) has shown that off-gassing of filters can last longer than 48 hours after opening, which may re-sult in changes in filter mass (RTI International, 2008) [4]. This finding empha-sizes the importance of testing mass stability of new filter batches.
The blank filter processing test was used for determining the extraction method limit of detection (LOD) and was not used in calculating the post-extraction filter mass. Any filter mass loss incurred by the filters unrelated to PM deposition is accounted for by a post-extraction field blank filter adjust-ment, explained in the following section.
2.3.2. Mass Deposition
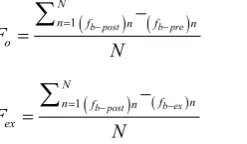
The average un-extracted, original field blank mass change (Fo) was used to
cor-rect the original MD (Mo), as is standard to account for non-sampling-related
filter mass changes during PM measurement campaigns (RTI International, 2008; USEPA, 2017) [4][5]. Analogously, the average post-extraction field blank mass change (Fex) was used to apply a batch-specific correction to the extracted
MD (Mex) to obtain a realistic proxy for a filter’s original MD (Mo). Applying a
batch-specific correction allowed for field blanks to act as a more specific proxy for filter mass changes caused by processes that vary between filter batches; such as shipment, field transport, and storage. The average field blank mass change from a given batch was subtracted from each sampled filter’s MD in the batch to account for previously described changes in mass unrelated to sample collection, as well as differences between the pre-sampling (Xpre) and post-extraction (Xex)
weights caused by the extraction process.
MD for the full filter data set was determined using both the standard gravi-metric (Mo) and the extraction (Mex) method employing the following
calcula-tions:
–
o Xpost Xpre Fo
Μ = − (1)
ex Xpost Xex Fex
DOI: 10.4236/ojap.2018.74016 314 Open Journal of Air Pollution
( ) ( )
1 b post b pre
N
n f n f n o
F
N
− −
= −
=
∑
(3)( ) ( )
1 b post b ex
N
f n n f n ex F N − − = −
=
∑
(4)where:
Μo = original MD using original, un-extracted field blank adjustment.
Μex = extracted MD using post-extraction filter weight and post-extraction
field blank adjustment.
Fo = average field blank original mass change.
Fex = average field blank post-extraction mass change.
Xpost = sample filter post-sampling mass.
Xpre = sample filter pre-sampling mass.
Xex = sample filter post-extraction mass (filter pre-sampling mass proxy).
fb–post = field blank post-sampling mass.
fb–pre = field blank pre-sampling mass.
fb–ex = field blank post-extraction mass.
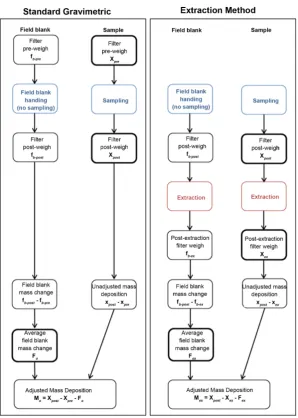
To help clarify the operational order of both the standard gravimetric and ex-traction methods, Figure 1 shows a schematic of filter handling and data analy-sis steps for sample and field blank filters for both processes.
2.3.3. Limit of Detection
Extraction blanks were analyzed to determine the limit of detection (LoD) for this method using the commonly accepted calculation for LOD shown in equa-tion 5 (yLOD). The average mass change (Bex) of 21 µg for all extraction blanks (N
= 8) and the standard deviation of the extraction blank mass change (σBex) of 13
µg yielded an LoD of 60 µg. All samples with Mex below 60 µg were excluded
from the following analysis (N = 28) for a total sample size of 231. 3
LOD ex Bex
y =B + ∗σ (5)
3. Results and Discussion
The average post-extraction field blank mass change (Fex) ranged from 15 to 21
µg depending on the sample batch, as compared to the original average field blank mass change (Fo) of −2 to −5 µg, meaning the post-extraction field blank
[image:6.595.329.453.74.146.2]mass was smaller than the original pre-weights by between 17 and 26 µg. This change in mass is consistent with the results of the blank filter extraction expe-riment, which showed a reduction in blank filter mass of about 21 µg post-extraction.
Figure 2 depicts a Deming regression model relating the field blank adjusted
original mass deposition (Mo) and the post-extraction, field blank adjusted mass
deposition (Mex) for the full sample set (A) and for filters with MD less than or
DOI: 10.4236/ojap.2018.74016 315 Open Journal of Air Pollution
Figure 1. Filter handling and data analysis for the standard gravimetric and
ex-traction method filter processing.
regression since it accounts for errors in both methods of a method comparison (Deming, W.E., 1943) [8]. The agreement between the two methods for the full filter set is excellent, with a slope of 0.998 and a Pearson’s correlation coefficient (r) of 0.999. Examining only lower mass deposition filters with MD less than or equal to 1000 µg (N = 216) shows the slope (1.0119) and the correlation coeffi-cient (r = 0.991) to be similar to the values for the complete sample set, indicat-ing that high MD outliers are not drivindicat-ing the relationship between the methods. The Deming regression analysis was done using R version 3.4.2. The package “mcr” was used for the analysis and visualization (Manuilova, E., et al., 2014)
[9].
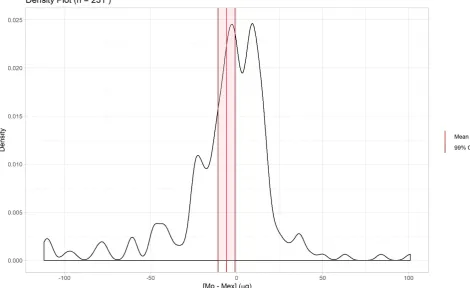
Figure 3 shows the distribution of the individual differences in mass deposi-tion derived from the original pre-sampling weight (Mo) and the post-extraction
DOI: 10.4236/ojap.2018.74016 316 Open Journal of Air Pollution
[image:8.595.60.540.69.323.2](a) (b)
Figure 2. A Deming regression model relating original mass deposition from the standard gravimetric method (Mo) versus mass
deposition determined from the extraction method (Mex) for all filters (a) and for filters with an Moof 1000 µg or less (b). The 95%
confidence bounds are calculated with the bootstrap (quantile) method. The “Identity” line indicates equivalent methods.
Figure 3. The mean mass deposition difference determined from field-blank adjusted original pre-sampling weight [Mo] and
field-blank adjusted post-extraction weights [Mex] is −5.8 ± 4.5. The distribution of the differences in mass deposition using the
[image:8.595.61.532.390.678.2]DOI: 10.4236/ojap.2018.74016 317 Open Journal of Air Pollution interval (CI) for the set of measurement differences is −5.8 ± 4.5 µg, indicating there is a 99% chance that the average difference in MD from these two me-thods, if implemented as described herein, will be between 1.3 µg and 10.3 µg for the sample population. The upper and lower CIs for the set of MD differences account for between approximately 0.35% and 2.8%, respectively, of the mean estimated PM MD for both the standard method (367 ± 589 µg) and the extrac-tion method (371 ± 589 µg).
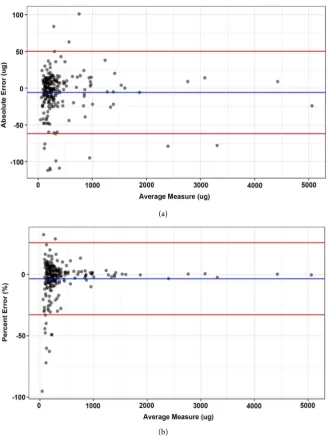
The Bland-Altman analysis is useful for comparing two different measure-ment methods that both have inherent error (Altman, D.G. and Bland, J.M., 1983) [10]. Figure 4(a) shows the absolute error between the two methods ver-sus the average mass deposition using the two different methods. The mean ab-solute error is −5.9 µg and the limits of agreement (LoA) for the two methods are ±56 µg, indicating 95% of the individual differences between Mo and Mex lie
between 50.1 and -61.9 µg. The percent error in MD using the two methods ver-sus the average of the two measurement methods is shown in Figure 4(b) and demonstrates that the limits of agreement (LoA) for the two methods are within ± 29% of the mean of −3.5%. As expected, the percent error gets larger as the measurement approaches the LoD. The percent error Bland-Altman plot indi-cates that few samples were outside the bounds of the LoA (N = 12) and that they are all relatively low MD filters, approximately 280 µg or less.
The mean values of the absolute (−5.9 µg) and percent error (−3.5%) indicate a slight bias between the two methods, with a minor overestimate by the extrac-tion method. Correcting the bias by adding the mean difference of −5.9 µg to in-dividual Mex values improved the estimate, yielding a mean absolute error of
close to 0 µg. However, this adjustment is likely to vary from project to project and would be difficult to derive on a case by case basis. For this reason, we do not recommend making the mean absolute error adjustment when employing the extraction method unless a significant subset of representative samples throughout the study have both Mo and Mex measurements to derive a
repre-sentative value for approximate absolute error. In the case of this study, using the absolute error confidence interval of 9.7 µg and a population size of 231, a subset of 43% of the samples would allow a representative assessment of absolute error of this sample set. The Bland-Altman figures were created in R version 3.4.2. The package ggplot 2 was used to generate the figures.
To understand the magnitude of the effect of the extraction method on the metric of interest, an estimate of PM concentration was done using a typical gravimetric sample scenario for the standard and extraction MD determination methods, respectively. For the mass deposition sample set analyzed herein, a sample duration of 1440 minutes and a flow rate of 1.5 liters per minute was as-sumed, which is common for exposure and indoor air pollution studies. The dif-ference in average approximate concentration using the two methods was found to be 2 µg/m3. The standard method yields an approximate concentration of 170 ±
DOI: 10.4236/ojap.2018.74016 318 Open Journal of Air Pollution
(a)
[image:10.595.209.539.68.506.2](b)
Figure 4. Bland-Altman relationships shows the absolute (Mo– Mex) (a) and percent (b)
error between the two MD determination methods (Mo versus Mex) for all values where
Mex > LOD (N = 231). The percent error is calculated using the average of the two
mea-surements. The mean value is defined by the blue line and the 95% limits of agreement are shown in red [mean ± 1.96*standard deviation] (A: −5.9 ± 56 µg, B: −3.5% ± 29%).
DOI: 10.4236/ojap.2018.74016 319 Open Journal of Air Pollution
4. Method Implementation Considerations
While this process is robust, some considerations and limitations exist:
Like standard gravimetric measurements, the analysis relies on field blanks to account for mass changes due to handling in the field and extraction. This method requires a minimum of ten field blanks, and ideally 10% - 20% of to-tal filter sample size. These field blanks also undergo the extraction process.
The field blank adjustment will vary depending on the field campaign, filter size, and duration of filters in the field. Field blank analysis, such as described herein, should be done for any filter project attempting extraction.
This process has only been tested on PTFE filters with PMP support rings. PTFE coated glass fiber filters and other types of filter media may not be via-ble for this type of filter processing. Care should be taken to undertake ade-quate testing prior to using the method on other types of filter media.
Filters that are not equilibrated to room temperature before extraction are susceptible to ripping during the extraction process. Tearing did not result in statistically significant differences between Μoand Mex (p = 0.17), and so torn
filters were included in the analysis. However, ensuring that the filters are at room temperature and not placed directly from the refrigerator into the so-nicator will reduce the likelihood of tearing during extraction.
Extracted filters proved to be relatively more electrically charged than unex-tracted filters. It is recommended to use all possible anti-static measures when weighing extracted filters to reduce measurement time and error.
The LoD of the method is 60 µg. This method should not be used on gravi-metric samples that are expected to experience PM loading less than 60 µg. Satisfying this LoD may be more challenging in short term samples or low-level ambient samples than in household air pollution or emissions stu-dies. For low PM deposition studies, this technique is not recommended.
All filters (N = 12, ~5%) demonstrating a percent error outside the LoA
(~±30%) have a MD of <280 µg, which may suggest that confidence in this method will be greatest when mass deposition is expected to be greater than or equal to 280 µg.
It is up to the user of this method to decide if the LoA for percent error
(−3.5% ± 29%) and absolute error (−5.9 ± 56 µg) is acceptable for the user’s application.
While batch number may affect the extraction performance of filters, this is expected to be accounted for by the time-period specific field-blank adjust-ment. Tracking batch number for the field-blank adjustment analysis may be useful.
DOI: 10.4236/ojap.2018.74016 320 Open Journal of Air Pollution ventilated work spaces. We suggest evaluating extraction effectiveness of PM from other combustion sources before using this method for filter analysis.
Acknowledgements
We wish to thank Kirk Smith and L. Drew Hill from the University of California, Berkeley (UCB) for sharing filters for use in the PM extraction tests and final experiment. The filters used in this analysis were collected by Berkeley Air Mon-itoring Group and UCB under the World Bank-funded cookstove intervention project, which took place in Lao PDR (Contract #7171980). We would also like to extend our thanks to Katharine Hammond at UCB for advising on the extrac-tion process and results and Ajay Pillarisetti, Drew Hill, and Madeleine Rossa-nese for input on the manuscript.
Conflicts of Interest
The authors declare no conflicts of interest regarding the publication of this paper.
References
[1] Balakrishnan, K., Sambandam, S., Ghosh, S., Mukhopadhyay, K., Vaswani, M., Arora, N.K., et al. (2015) Household Air Pollution Exposures of Pregnant Women Receiving Advanced Combustion Cookstoves in India: Implications for Interven-tion. Annals of Global Health, 81, 375-385.
[2] Health and Safety Executive (HSE) (1997) General Methods for Sampling and Gra-vimetric Analysis of Respirable, Thoracic and Inhalable Aerosols. In: Methods for the Determination of Hazardous Substances (MDHS) Guidance, Health and Safety Executive (HSE).
[3] Rosa, G., Majorin, F., Boisson, S., Barstow, C., Johnson, M., Kirby, M., et al. (2014) Assessing the Impact of Water Filters and Improved Cook Stoves on Drinking Wa-ter Quality and Household Air Pollution: A Randomised Controlled Trial in Rwan-da. PLoS ONE, 9, e91011. https://doi.org/10.1371/journal.pone.0091011
[4] RTI International. (2008) Standard Operating Procedure for Particulate Matter (PM) Gravimetric Analysis. Environmental and Industrial Sciences Division. [5] USEPA (2017) Method 5: Determination of Particulate Matter Emissions from
Sta-tionary Sources. United States Environmental Protection Agency.
https://www.epa.gov/sites/production/files/2017-08/documents/method_5.pdf
[6] Drew Hill, L., Pillarisetti, A., Smith, K.R., Delapena, S., Delapena, S., Garland, C., et al. (2015) Air Pollution and Impact Analysis of a Pilot Stove Intervention. House-hold Energy, Climate, and Health Research Group School of Public Health Univer-sity of California, Berkeley.
http://ehsdiv.sph.berkeley.edu/krsmith/publications/2015/Lao_MoH_Main_report.
[7] Williams, R., Pasley, T., Warren, S., Zweidinger, R., Watts, R., Stead, A. and Clax-ton, L. (1988) Selection of a Suitable Extraction Method for Mutagenic Activity from Woodsmoke-Impacted Air Particles. International Journal of Environmental Analytical Chemistry, 34, 137-154. https://doi.org/10.1080/03067318808027411 [8] Deming, W.E. (1943) Statistical Adjustment of Data. Wiley, NY (Dover
DOI: 10.4236/ojap.2018.74016 321 Open Journal of Air Pollution
[9] Manuilova, E., Schuetzenmeister A. and Model, F. (2014) Mcr: Method Comparison Regression. R Package Version 1.2.1. https://CRAN.R-project.org/package=mcr [10] Altman, D.G. and Bland, J.M. (1983) Measurement in Medicine: The Analysis of