A Study on the Functional Reliability of Gravity Dam
Qiang Xu1, Jianyun Chen1,2*, Jing Li1
1School of Civil and Hydraulic Engineering, Dalian University of Technology, Dalian, China 2State Key Laboratory of Coastal and Offshore Engineering, Dalian University of Technology, Dalian, China
Email: [email protected], {*eerd001, lijing}@dlut.edu.cn Received December 24, 2011; revised January 20, 2012; accepted February 8, 2012
ABSTRACT
The research objective is to design and construct a method for functional reliability analysis of concrete gravity dam. Firstly, the pseudo excitation method was utilized to analyze to calculate the probabilistic characteristics of concrete gravity dam excited by random seismic loading. Meanwhile, the response surface method based on weighted regression was associated to that method to analyze functional reliability of concrete gravity dam. Eventually, a test example was given to verify and analyze the convergence and stability of this method.
Keywords: Concrete Gravity Dam; Random Load; Functional Reliability; Pseudo Excitation Method
1. Introduction
The basic purpose of structural reliability analysis is to obtain the probabilistic responses of structural systems with uncertain design parameters, such as loadings, ma- terial parameters (strength, elastic modulus, Poisson’s ratio, etc.), and shape dimensions. Among the methods avail- able for these problems, the response surface method (RSM) is a powerful tool [1]. The theory and methods of RSM have been developed significantly during the last twenty years and have been documented in an increasing num- ber of publications. Although, from a theoretical point of view, the field has reached a stage where the developed methodologies are becoming widespread, RSM used to analyze large structures is still a complex and difficult task. In order to solve this problem, a rigorous series of tests has to be carried out. Linda and Ping (1999) [2] constructed confidence intervals about the difference in mean responses at the stationary point and alternate points based on the proposed delta method and F-projection method and compared coverage probabilities and interval widths. Zheng and Das (2000) [3] proposed an improved response surface method and applied that to the reliabil-ity analysis of a stiffened plate structure. Guan and Melchers (2001) [4] evaluated the effect of response sur-face parameter variation on structural reliability. Byeng and Kyung (2004) [5] proposed the hybrid mean value (HMV) method for highly efficient and stable RBDO by evaluating the probabilistic constraint effectively. Gupta and Manohar (2004) [6] used the response surface method to study the extremes of Von Mises stress in nonlinear structures under Gaussian excitations. Herbert and
Ar-mando (2004) [7] compared RSM and the artificial neu-ral network (ANN) techniques. Irfan and Chris (2005) [8] proposed a new response surface called ADAPRES, in which a weighted regression method was applied in place of normal regression. Wong et al. (2005) [9] proposed an adaptive design approach to overcome the problem, which was that the solution of the reliability analysis initially diverged when the loading was applied in sequence in the NLFE analysis, and made several suggestions to improve the robustness of RSM. Jiang et al. (2006) [10] improved the method to fit the indeterminate coefficients of re-sponse surface. Jin Weilian and Yuan (2007) [11] pre-sented a response surface method based on least squares support vector machines (LS-SLM) aiming at the reli-ability analysis problems with implicit performance func-tion. Chebbah (2007) [12] dealt with the optimization of tube hydro forming parameters in order to reduce defects which might occur at the end of forming process such as necking and wrinkling by RSM. Jin et al. (2008) [13] pre-sented a new artificial neural net work-(ANN) based re-sponse surface method in conjunction with the uniform design method for predicting failure probability of struc-tures. Henri and Siu (2008) [14] described the use of higher order polynomials in order to approximate the true limit state more accurately in contrast to recently proposed algorithms which focused on the positions of sample points to improve the accuracy of the quadratic the sto-chastic response surface method (SRSM). TongZou et al.
(2008) [15] presented an accurate and efficient Monte Carlo simulation method for limit-state- based reliability analysis at both component and system levels, using a re-sponse surface approximation of the failure indicator func-tion. Xuan et al. (2009) [16] proposed an adaptive
struction of the numerical design, in which the response surface was fitted by the weighted regression technique, which allowed the fitting points to be weighted according to their distance from the true failure surface and their distance from the estimated design point.
To date, however, most reliability methods such as the first order reliability method (FORM) [17], the second- order reliability method (SORM) [18,19], the weighted regression method (WRM) [20,21], and the space re- duced weighted regression method (SRWRM) [22] can- not be used to analyze large structures. These traditional reliability methods have two aspects of deficiencies. On the one hand, limited state function is usually implicit when we use a finite element method (FEM) to analyze struc- ture. It leads to the difficulty in obtaining implicit limited state function for basic random variables. On the other hand, in order to overcome the above defects, some reli- ability methods use polynomial response surface function to fit implicit limited state function, but the number of basic random variables is very large when analyzing large structures. And these reliability methods need more ex- perimental points to confirm the indeterminate coefficients of these basic random variables. It follows that, during the process, the calculation efficiency and the storage effi- ciency of these methods are very low. Even in some large structures, it is impossible to obtain enough experimental points. Therefore, most of reliability methods only can be used to analyze small structures.
It has now been widely recognized that the most rea- sonable method for dealing with such multiple excitation problem is the random vibration approach. Among a great deal of research activities, the reach work by Kiureghian [23] and Ernesto [24] are representative. They all devel- oped their research about the seismic analysis of long- span structures based on random vibration approach. Nev- ertheless, when solving the high degree random different- tial equations, they all faced unacceptable computational efforts. Compared to these algorithms, Lin [25] proposed a pseudo-excitation method, which was an accurate and highly efficient algorithm series for linear structural sta-tionary random response analysis, to deal with dynamic response of structures subject to random seismic excita- tion. In this method, the determination of random response of a linear structure was converted to the determination of response of the structure under a series of harmonic loads. By using this algorithm series, the aforementioned difficulties in the stationary random response computa- tions of long-span structures were satisfactorily resolved. Based on this algorithm, Lin [26] et al. analyzed non- stationary random responses of linear structures subjected to evolutionary random excitation. The analytic thought was that the random excitation was first transformed into a pseudo excitation to generate deterministic equations of motion, which were then solved by means of a modified high precision direct integration method. Furthermore,
Lin [27] et al. developed the inverse pseudo-excitation method for dealing with loading identifcation problems. Then, Lin [28] et al. utilized this algorithm to make prob- abilistic analysis for long-span structures such as long- span bridges [29], non-uniform beams [30] and so on. Other researchers carried out a rigorous series of algorithms in order to improve and develop pseudo-excitation method. Xu [31] et al. presented a new algorithm for buffeting analysis of long span bridges, featured mainly by a com- plete finite element approach and a pseudo-excitation method and then used this algorithm to make fully cou- pled buffeting analysis of Tsing Ma suspension bridge [32] and vibration analysis of wind-excited structures [33]. Then, based on the pseudo-excitation method, Xu [34,35]
et al. and Zhang [36] et al. also presented closed-form solu- tion for seismic response of adjacent buildings connected by hydraulic actuators with linear quadratic Gaussian (LQG) controllers. Based on the pseudo-excitation method, Sun [37] et al. presented a formulation for fully coupled buffeting analysis of long-span cable-supported bridges, in which dynamic coupling between modes of vibration, dynamic forces on bridge deck and towers and cables, and varying wind speed and structural properties along the bridge deck and towers and cables can be taken into consideration. Li [38] et al. utilized pseudo-excitation me- thod for the random vibration analysis of seismic responses of tall buildings. Xue [39] et al. utilized the pseudo-exci- tation method to make a random vibration study of struc- tures under multi-component seismic excitations. Li [40]
et al. extended the pseudo-excitation method with the stochastic orthogonal polynomial expansion method to make response analysis of stochastic parameter structures under non-stationary random excitation. Nevertheless, the pseudo-excitation method only is utilized to analyze linear structures because this method is derived from superpo- sition principle, which only is applied to linear structures. In this paper, we construct an approach to calculate the functional reliability, which is denoted as the displace- ment at the head of gravity dam. The Pseudo excitation method and the response surface method based on weighted regression are associated to analyze the functional reli- ability of gravity dam. Ultimately, a test example is util- ized to verify and analyze the convergence and stability of the proposed method.
2. The Analytical Method for the Functional
Reliability
2.1. Brief Introduction on Pseudo Excitation Method
t T
At time , autocorrelation function of stationary ran-dom process x t
is given by
d , ; ,
xx
R E x t x t
x t x t F x t x t
where E(#) denotes the expected value of variable #. Fourier transform pairs are consisted of auto-spectral density function Sxx
f and Autocorrelation functionxx
R
, it can be written as
xxS f
2 j f d xxR e
2 j f d xx f e f
0 Sxx f fd
(2)
xxR
S (3)From Equations (1)-(3), it can be seen that
2 2
xx xx xx
E D R (4)
where Exx and Dxx2
denote the expected value and vari-ance of x t .
when Exx = 0, 2
xx
D can be determined from S
f
S f
xx
Pseudo excitation method is the numerical methods for
xx and the basic principle of the pseudo excitation
method is depicted as Figure 1.
.
Linear system under single-point and stationary ran-dom excitation x t , the response power spectrum of that is written as
2
yy xx
S H S
i t
e
(5) This relationship is depicted as Figure 1(a), the
meaning of frequency response function H is depicted as
Figure 1(b). When the harmonic excitation of
sin-glepoint is applied in the linear system, the corresponding response y He i t
i t
e
. It is worth noting that pseudo exci-tation is constructed by exciexci-tation, which was mul-tiplied by constant Sxx
. The pseudo excitation is given by
i xx
t
x t S e (6) The response can also be multiplied by the same con-stant. It is depicted as Figure 1(c). Still using
#
#to represent the corresponding pseudo response of variable
, it should be noted from Figure 1(c) that
2 2
*
xx yy H S S
y y y (7)
* i t i t
xx xx xx xy
x y S e S He S H S (8)
* * i t i t *
xx x
y x S H e S ex H SxxSyx
*#
#1
y y2
(9) where denotes the conjugate of .
If considering two pseudo responses and de-pict as Figure 1(d), it could be seen that
1 2
* * *
1 2
i t i t
1 2 1 xx 2 xx
y y H S e H S e H S Hxx Sy y
2 1
* *
2 1
(10)
2 1 xx y y y y H S H S
* T S y y
* T xyS x y
(11) From aforementioned analysis, it should be noted that
yy (12)
(13)
* T yxS y x (14) Thus it can be obtained that
2 2
,
ff VV
S f S V (15)
where f and V denote internal force and displacement, respectively.
2.2. The Method to Calculate the Probabilistic Characteristics
Here, all random variables are assumed to obey Gaussian distribution. Because other distribution form can be translate into Gaussian distribution easily, and Gaussian distribution is extensively applied in the analysis of ran-dom variables.
When dam is excited by static and random seismic load, the element’s displacement of dam is random vari- able. From static analysis of the dam, the expected value
k of displacement of element k is obtained. Andthe variance
E V
D V
t
MV CV KV F
V V
k of displacement of element k can
be derived as follow.
The vibration equation of gravity dam is determined as (16) where , and V denote acceleration, velocity and
displacement of nodes in dam model, respectively; K,
and denote stiffness matrix, damping matrix and mass matrix of dam model, respectively; denotes random seismic load.
C M
( )t
F
From Equation (16), it should be noted that gravity dam under random seismic load is a linear system. Ac- cordingly, the pseudo excitation method can be utilized in aforementioned system.
The pseudo excitation is constructed as ( ) ( ) i
f t F t S e
( )
(17)
fF t and S
where denote pseudo excitation and the power spectrum density of random seismic load, re- spectively.
2
yy xx
S H S
H
(a) Sxx
(b) x =ei t
(c) x= i t xx
S e
(d) x= i t xx
S e
H y He i t
i t xx y S He
H
1 1
i t xx y S H e
H
2 xx 2 i t
y S H e
[image:3.595.317.539.79.165.2]Through the pseudo excitation method, the power spec-trum density of the displacement of element k is deter-mined as
*V k k
S V V
k
V
kD V
0 k d
k SV
k (18)
where denotes pseudo displacement response of ele- ment k.
Thus the variance of displacement of element
k is given by
D V
P V L
(19)2.3. The Method to Calculate the Functional Reliability
The displacement of element k of concrete gravity dam model is taken as functional reliability, and the functional reliability k can be decomposed into two parts
and expressed as
k
P L I P Ik
k
L P I
P V L (20) where is the objective displacement. k is the
probability due to the randomness of the elastic modulus of element k and P L Ik
is the conditional probabilityof element k due to the randomness of seismic load under the condition of these random elastic modulus.
In which
2
0
d dL D Vk
D V d 0 d 0 0 1 exp 2 2 )L L k
k L L
k k
L E V P L I
D V D V
(21) where 0 k is the objective variance of element k. Itcan be observed that this expression has considered the randomness of seismic load.
The implicit limited state function g x
D V
Vk D Vk
P I
is denoted as the discrepancy between k and k under
the condition of random elastic modulus of element
k.D V0
0g x D (22) and k can be derived from the response surface method based on weighted regression [41]. It can be ex-pressed as
Vk D V0 k
k
P V L
k
P I P D (23) Ultimately, the functional reliability should be derived through above procedure.
3. The Numerical Examples for Gravity
Dam
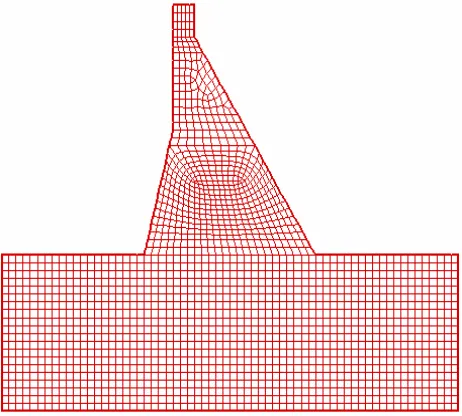
The gravity dam is 160 m high. The normal pool level (NPL) is 155 m deep. The level of the back of the dam is 10 m deep. The elevation of upstream and downstream broken-line sloping surface relative to foundation plane
are 80 m and 140 m, respectively. The concrete strength of the gravity dam is C20. The finite element model of the gravity dam is divided into 2432 elements. The model con-sists of 8-node iso-parametric plane elements for the dam and foundation. The density of the dam ρ = 2450 kg/m3,
and Poisson ratio v = 0.18. The damping ratio of dam ζ = 0.05. The density of rock foundation ρ = 2700 kg/m3, and
Poisson ratio v = 0.25. And the parameters α = 0.9, β = 0.1. Applied load includes gravity load and hydrostatic and uplift pressure and seismic load whose horizontal peak acceleration is 0.25 g. And the objective element k is extracted from one of elements at dam head. The power spectrum density of seismic load is given by
22 1
2ln ln
2
1,2,3, ,
T
f k a k
k k d d k d S S p T T
k k N
T N t (24)
TSa k and
where are target response spectrum and damping ratio, respectively; (p≤ 0.15) and d are exceeding response spectrum probability and duration of ground motion, respectively; and are the num-ber of trigonometric series and time step, respectively.
p T
N t
Thus, it should be observed that the functional reliabil-ity P V
kL
is taken as the reliability for the displace-ment of gravity dam head. And the displacedisplace-ment of dam head is regarded as the functional reliability of overall gravity dam.The concrete gravity dam model is shown in Figure 2.
[image:4.595.326.540.249.349.2]The probability distributions of all random parameters of
[image:4.595.308.539.512.720.2]each element are shown in Table 1.
4. Results and Discussion
The result of k of gravity dam is shown in Table 2.
The result of functional reliability k of gravity
dam is shown in Table 3. And the deviation factor
itera-tive procedure is shown in Figure 3. The relation
be-tween objective variance
P I
P V L
0
D Vk and the probability
is shown in Figure 4. The relation between
ob-jective displacement and conditional probability k
P I
P L I
k
P V L
k
is shown in Figure 5. The relation between objective
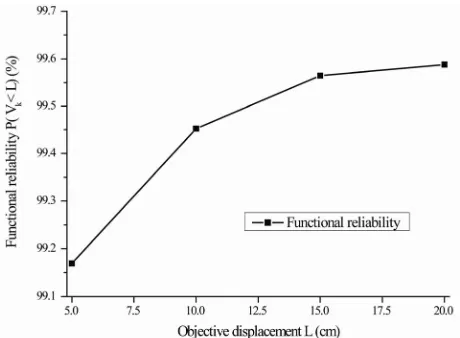
displacement L and functional reliability is shown in Figure 6.
Table 1. The probability distribution of all random pa-rameters of each element.
Elastic modulus of rock foundation
Probability distribution value (pa) Expected Coefficient of variation
Normal distribution 4.00E + 10 0.1
Elastic modulus of dam
Probability distribution value (pa) Expected Coefficient of variation
Normal distribution 3.50E + 10 0.1
Table 2. The result of P Ik
of the displacement of the head of gravity dam.
Objective variance
D0 (m)
Deviation factor
vk
The iterative step number
k
Reliability index
β
In each iterative step of the method of this paper, only 100 experimental points are utilized to approximate im-plicit limited state function g x
while the traditional response surface method needs 4865 experimental points. Thus, the method of this paper saves a lot of storage space and can be applied in analyzing large structures such as gravity dams.Table 3. Result of functional reliability of the displacement of gravity dam head.
Objective displacement
L (cm)
The conditional probability
% k
P I
2.22948 1 3.4057 99.967
1.28292 2 3.1652 99.923
0.55978 3 3.0339 99.879 1
0.45342 4 3.0270 99.877
2.23032 1 3.5678 99.982
0.93529 2 3.1980 99.931
0.84176 3 3.0540 99.887 2
0.61364 4 3.0147 99.871
2.63879 1 3.3393 99.958
1.52136 2 3.0299 99.878
0.39891 3 2.9500 99.841 3
0.35902 4 2.9032 99.815
2.73594 1 3.1708 99.924
1.08575 2 2.8713 99.796
0.78985 3 2.8227 99.762 4
0.56693 4 2.8013 99.746
k L I P V kL
P (%)
Functional reliability (%)
5 99.292 99.169
10 99.580 99.452
15 99.750 99.565
20 99.842 99.588
Figure 3. Deviation factor iterative procedure.
Figure 5. The relation between objective displacement L and conditional probability
Figure 6. The relation between objective displacement L and functional reliability
k L .
k
P I P V L .
REFERENCES
From Figure 3, it can be seen that convergence rate ofthe proposed response surface method based on weighted regression is high. The iteration process achieves stabil-ity normally at fourth iteration step. From Figure 4, it
can be observed that the probability
[1] Y. W Liu and F. Moses, “A Sequential Response Surface Method and Its Application in the Reliability Analysis of Aircraft Structural System,” Structural Safety, Vol. 16, No. 1-2, 1994, pp. 39-46. doi:10.1016/0167-4730(94)00023-J
k
P I
0 k
D V
decreases while the objective variance increases and they are substantially appeared inverse proportion relation. From Figure 4, it can be observed that the conditional
probability
[2] L. J. Moore and P. Sa, “Comparisons with the Best in Response Surface Methodology,” Statistics & Probability, Vol. 44, No. 2, 1999, pp. 189-194.
kP I P V
k
[3] Y. Zheng and P. K. Das, “Improved Response SurfaceMethod and Its Application to Stiffened Plate Reliability Analysis,” Engineering Structures, Vol. 22, No. 5, 2000, pp. 544-551. doi:10.1016/S0141-0296(98)00136-9
L
and the functional reliability
increase while objective displacement L increases and they are obviously exhibited direct proportion relation.
Meanwhile, they all appear exponential characteristic. [4] X. L. Guan and R. E. Melchers, “Effect of Response Surface
Parameter Variation on Structural Reliability Estimates,”
Structural Safety, Vol. 23, No. 4, 2001, pp. 429-444. doi:10.1016/S0167-4730(02)00013-9
From Table 3, it can be seen that the functional
reli-ability of overall gravity dam is 99.169%, 99.452%, 99.565% and 99.588% when the objective displacement is 5 cm, 10 cm, 15 cm and 20 cm, respectively. And it indicates the security of the gravity dam is high.
[5] B. D. Youn and K. K. Choi, “A New Response Surface Methodology for Reliability-Based Design Optimization,”
Com- puters and Structures, Vol. 82, No. 2-3, 2004, pp. 241-256. doi:10.1016/j.compstruc.2003.09.002
5. Conclusion
[6] S. Gupta and C. S. Manohar, “Improved Response Surface Method for Time Variant Reliability Analysis of Nonlinear Random Structures under Non-Stationary Excitations,”
Nonlinear Dynamics, Vol. 36, No. 2-4, 2004, pp. 267-280. doi:10.1023/B:NODY.0000045519.49715.93
In this paper, we construct an approach to calculate the-functional reliability, which is denoted as the displace-ment at the head of gravity dam. The Pseudo excitation method and the response surface method based on weighted regression are associated to analyze the functional reli-ability of gravity dam. Ultimately, a test example is util-ized to verify and analyze the convergence and stability of the proposed method.
[7] H. M. Gomes and A. M. Awruch, “Comparison of Re-sponse Surface and Neural Network with Other Methods for Structural Reliability Analysis,” Structural Safety, Vol. 26, No. 1, 2004, pp. 49-67.
doi:10.1016/S0167-4730(03)00022-5
[8] I. Kaymaz and C. A. McMahon, “A Response Surface Method Based on Weighted Regression for Structural Re-liability Analysis,” Probabilistic Engineering Mechanics, Vol. 20, No. 1, 2005, pp. 11-17.
doi:10.1016/j.probengmech.2004.05.005
6. Acknowledgements
This study was supported by Project supported by the National Natural Science Foundation of China (Grant No. 51109029, 51178081, 51138001, 50909015, 51009020). and China Postdoctoral Science Foundation (Grant No. 20110491535).
[image:6.595.308.538.84.253.2]Safety, Vol. 27, No. 4, 2005, pp. 287-308. doi:10.1016/j.strusafe.2005.02.001
[10] J. Q. Jiang, C. G. Wu, C. Y. Song, et al., “Adaptive and Iterative Gene Selection Based on Least Squares Support Vector Regression,” Journal of Information & Computa-tional Science, Vol. 3, 2006, pp. 443-451.
doi:10.1109/GRC.2008.4664732
[11] W.-L. Jin and X.-X. Yuan, “Response Surface Method Based on LS-SVM for Structural Reliability Analysis,”
Journal of Zhejiang University (Engineering Science), Vol. 41, No. 1, 2007, pp. 44-47.
[12] M. S. Chebbah, “Response Surface Method for the Rapid Design of Process Parameters in Tube Hydroforming,”
Material Processing and Design, Vol. 7, 2007, pp. 455-460. doi:10.1063/1.2740853
[13] J. Cheng, Q. S. Li and R.-C. Xiao, “A New Artificial Neu-ral Network-Based Response Surface Method for StructuNeu-ral Reliability Analysis,” Probabilistic Engineering Mechanics, Vol. 23, No. 1, 2008, pp. 51-63.
doi:10.1016/j.probengmech.2007.10.003
[14] H. P. Gavin and S. C. Yau, “High-Order Limit State Func-tions in the Response Surface Method for Structural Reli-ability Analysis,” Structural Safety, Vol. 30, No. 2, 2008, pp. 162-179. doi:10.1016/j.strusafe.2006.10.003
[15] T. Zou, Z. P. Mourelatos, Z. P. Mourelatos and J. Tu, “An Indicator Response Surface Method for Simulation-Based Reliability Analysis,” Journal of Mechanical Design, Vol. 130, No. 7, 2008, pp. 1-11. doi:10.1115/1.2918901 [16] X. S. Nguyen, A. Sellier, F. Duprat and G. Pons, “Adaptive
Response Surface Method Based on a Double Weighted Regression Technique,” Probabilistic Engineering Mecha- nics, Vol. 24, No. 2, 2009, pp. 135-143.
doi:10.1016/j.probengmech.2008.04.001
[17] Y. J. Hong, J. Xing and J. B. Wang, “A Second-Order Third-Moment Method for Calculating the Reliability of Fatigue,” International Journal of Pressure Vessels and Piping, Vol. 76, No. 8, 1999, pp. 567-570.
http://dx.doi.org/10.1016/S0308-0161(99)00013-7 [18] A. Der Kiureghian and T. Dakessian, “Multiple Design
Points in First and Second-Order Reliability,” Structural Safety, Vol. 20, No. 1, 1998, pp. 37-49.
doi:10.1016/S0167-4730(97)00026-X
[19] H. U. Koyluoglu and S. R. K. Nielsen, “New Approxima-tions for SORM Integrals,” Structural Safety, Vol. 13, No. 4, 1994, pp. 235-246. doi:10.1016/0167-4730(94)90031-0 [20] C. C. Qiu and M. E. Orazem, “A Weighted Nonlinear Re-gression-Based Inverse Model for Interpretation of Pipeline Survey Data,” Electrochimica Acta, Vol. 49, No. 22-23, 2004, pp. 3965-3975.
http://dx.doi.org/10.1016/j.electacta.2004.03.045
[21] K. Triantafyllopoulos, “Multivariate Discount Weighted Regression and Local Level Models,” Computational Sta-tistics & Data Analysis, Vol. 50, No. 12, 2006, pp. 3702- 3720. doi:10.1016/j.csda.2005.07.003
[22] J. Zhao and Z. Z. Lu, “Response Surface Method for Re-liability Analysis of Implicit Limit State Equation Based on Weighted Regression,” Journal of Mechanical Strength, Vol. 28, No. 4, 2006, pp. 512-516.
[23] A. D. Kiureghian and A. Neuenhofer, “Response Spectrum Method for Muti-Support Seismic Excitation,” Earthquake Engineering & Structural Dynamics, Vol. 21, No. 1, 1992, pp. 713-740. doi:10.1002/eqe.4290210805/abstract [24] H. Z. Ernesto and E. H Vanmarcke, “Seismic Random
Vibration Analysis of Multi-Support Structural Systems,”
Journal of Engineering Mechanics, Vol. 120, No. 5, 1994, pp. 1107-1128.
doi:10.1061/(ASCE)0733-9399(1994)120:5(1107) [25] J. H. Lin, “A Fast CQC Algorithm of PSD Matrices for
Random Seismic Responses,” Computers & Structures, Vol. 44, No. 3, 1992, pp. 683-687.
doi:10.1016/0045-7949(92)90401-K
[26] J. H. Lin, W. P. Shen and F. W. Williams, “Accurate High- Speed Computation of Non-Stationary Random Structural Response,” Engineering Structures, Vol. 19, No. 7, 1997, pp. 586-593. doi:10.1016/S0141-0296(97)83154-9
[27] J. H. Lin, X. L. Guo, H. Zhi, W. P. Howson and F. W. Wil-liams, “Computer Simulation of Structural Random Loading Identifcation,” Computers and Structures, Vol. 79, No. 4, 2001, pp. 375-387. doi:10.1016/S0045-7949(00)00154-1 [28] J. H. Lin, Y. Zhao and Y. H. Zhang, “Accurate and Highly
Efficient Algorithms for Structural Stationary/Non-Station- ary Random Responses,” Computer Methods in Applied Mechanics and Engineering, Vol. 191, No. 1-2, 2001, pp. 103-111. doi:10.1016/S0045-7825(01)00247-X
[29] J. H. Lin, Y. H. Zhang, Q. S. Li and F. W. Williams, “Seismic Spatial Effects for Long-Span Bridges, Using the Pseudo Excitation Method,” Engineering Structures, Vol. 26, No. 9, 2004, pp. 1207-1216.
doi:10.1016/j.engstruct.2004.03.019
[30] J. H. Lin, G. Z. Song and Y. Sun, “Non-Stationary Ran-dom Seismic Responses of Non-Uniform Beams,” Soil Dynamics and Earthquake Engineering, Vol. 14, No. 4, 1995, pp. 301-306. doi:10.1016/0267-7261(94)00030-K [31] Y. L. Xu, D. K. Sun, J. M. Ko and J. H. Lin, “Buffeting
Analysis of Long Span Bridges: A New Algorithm,”
Computers and Structures, Vol. 68, No. 4, 1998, pp. 303- 313. doi:10.1016/S0045-7949(98)00072-8
[32] Y. L. Xu, D. K. Sun, J. M. Ko and J. H. Lin, “Fully Cou-pled Buffeting Analysis of Tsing Ma Suspension Bridge,”
Journal of Wind Engineering and Industrial Aerodynamics, Vol. 85, No. 1, 2000, pp. 97-117.
doi:10.1016/S0167-6105(99)00133-6
[33] Y. L. Xu, W. S. Zhang, J. M. Ko and J. H. Lin, “Pseudo- Excitation Method for Vibration Analysis of Wind-Excited Structures,” Journal of Wind Engineering and Industrial Aerodynamics, Vol. 83, No. 1-3, 1999, pp. 443-454. doi:10.1016/S0167-6105(99)00092-6
[34] Y. L. Xu and W. S. Zhang, “Closed-Form Solution for Seismic Response of Adjacent Buildings with Linear Quadratic Gaussian Controllers,” Earthquake Engineering & Structural Dynamics, Vol. 31, No. 2, 2002, pp. 235-259. doi:10.1002/eqe.107
[36] W. S. Zhang and Y. L. Xu, “Dynamic Characteristics and Seismic Response of Adjacent Buildings Linked by Dis-crete Dampers,” Earthquake Engineering & Structural Dynamics, Vol. 28, No. 10, 1999, pp. 1163-1185.
doi:/10.1002/(SICI)1096-9845(199910)28:10<1163::AID -EQE860>3.0.CO;2-0
[37] D. K. Sun, Y. L. Xu, J. M. Ko and J. H. Lin, “Fully Coupled Buffeting Analysis of Long-Span Cable-Supported Bridges: Formulation,” Journal of Sound and Vibration, Vol. 228, No. 3, 1999, pp. 569-588. doi:10.1006/jsvi.1999.2425
[38] Q. S. Li, Y. H. Zhang, J. R. Wua and J. H. Lin, “Seismic Random Vibration Analysis of Tall Buildings,” Engineer-ing Structures, Vol. 26, No. 12, 2004, pp. 1767-1778. doi:10.1016/j.engstruct.2004.06.013
[39] S. D. Xue, Z. Cao and X. S. Wang, “Random Vibration Study of Structures under Multi-Component Seismic Exci-tations,” Advances in Structural Engineering, Vol. 5, No. 3, 2002, pp. 185-192. doi:10.1260/136943302760228130 [40] J. Li and S. T. Liao, “Response Analysis of Stochastic
Pa-rameter Structures under Non-Stationary Random Excita-tion,” Computational Mechanics, Vol. 27, No. 1, 2001, pp. 61-68. doi:10.1007/s004660000214
[41] J. Y. Chen, Q. Xu, J. Li and S. L. Fan, “Improved Response Surface Method for Anti-Slide Reliability Analysis of Gravity Dam Based on Weighted Regression,” Journal of Zhejiang University—Science A (Applied Physics & Engi-neering), Vol. 11, No. 6, 2010, pp. 432- 439.