Nutritional and Functional Characteristics of
Protein-Fortified Pasta from Sweet Potato
Jyothi Gopalakrishnan, Renjusha Menon, Gourikutty Padmaja,
Moothandassery Sankarankutty Sajeev, Subramoney Narayana Moorthy
Division of Crop Utilization, Central Tuber Crops Research Institute, Kerala, India. Email: padmajabn@yahoo.com
Received June 9th, 2011; revised September 26th, 2011; accepted October 4th, 2011.
ABSTRACT
Despite being a healthy low glycaemic index food, the production and consumption of sweet potatoes are decreasing globally. The global production trends indicated a decline from 130.47 million tonnes (MT) in 2004 to 107.64 MT in
2009, while the production in China, having the largest share towards world production of sweet potatoes, witnessed a decrease from 105.84 MT in 2004 to 81.21 MT in 2009. There is an interest in increasing consumption of healthy low glycaeimic index foods, especially in the context of a projected alarming rise in the diabetic population in the develop- ing world by 2025. The objective of this study was to enhance the utilization of sweet potato as a low glycaemic food,
mainly through its use in the development of high protein pasta. Among three protein sources, whey protein concentrate
(WPC), defatted soy flour (DSF), and fish powder (FP), WPC gave high quality pasta with strong starch-protein net- work formation, as evidenced from scanning electron microscopic studies and low in vitro starch digestibility. Protein nutritional quality was also high for WPC-fortified sweet potato pasta, with very high scores for lysine and leucine as well as high essential amino acid index and calculated protein efficiency ratio. Fractionation of starch showed that the WPC-fortified sweet potato pasta had the lowest rapidly digested starch (RDS) and the highest resistant starch (RS)
content, indicating its potential as a low glycaemic food.
Keywords: Sweet Potato, Pasta, Protein, Fortification, Quality, Evaluation
1. Introduction
Sweet potato [Ipomoea batatas (L) Lam.] has assumed great significance in recent years as a health food due to the various bioactive principles in the roots. Nevertheless, the production statistics of sweet potato during 2004- 2009 indicate a drastic reduction in the world production from 130.47 million tonnes (MT) in 2004 to 100.93 (MT) in 2007, followed by a small rise of 107.64 MT in 2009 [1]. China, which contributes the major share of world sweet potato production, also indicates a decline from 105.84 MT in 2004 to 81.21 MT in 2009 [1]. The total production of sweet potato roots in India also decreased from 1.18 MT to 1.12 MT during 2004-2007, indicating that its importance as a food item is decreasing. Despite being a carbohydrate rich food, sweet potato is also reported to have low glycaemic index (<55), suggesting its suitability as a food for diabetic people [2]. Whilst the global prevalence of diabetes is projected to increase from 4% in 1995 to 5.4% by 2025, approximately 170% increase in diabetic population has been predicted in
developing countries, with India topping the list, follow- ed by China [3]. FAO-WHO Expert Consultation recom- mends the increased consumption of low glycaemic foods rich in resistant starch, non-starch polysaccharides and oligosaccharides [4]. Foods with low glycaemic response are reported to be of use in the treatment of obesity, type 2 diabetes mellitus and in weight management [5]. Sweet potato is reported to have anti-diabetic property and the components contributing to this effect have been isolated and studied from white-skinned sweet potatoes [6]. The objective of this study was to enhance the utilization pro- spects of sweet potato through the development of a va- lue added low glycaemic food like pasta.
Nutritional and Functional Characteristics of Protein-Fortified Pasta from Sweet Potato 945
of pasta with various protein sources such as legume flours, cheese, soy proteins, mustard protein isolate and gluten meal has been attempted by several workers, with a view to enhancing the nutritional value of pasta [9,10]. The possibility of using sweet potato for noodle and pasta manufacture has also been explored by different re- searchers [11,12]. As protein content and gluten strength are critical factors deciding the cooking quality of pasta and since sweet potato lacks gluten, fortification with pro-tein sources like whey propro-tein concentrate (WPC), defat-ted soy flour (DSF) and fish powder (FP) was attempdefat-ted in the present study to understand their impact on starch- protein network formation. The three protein sources cho-sen for the study have been reported to have health pro-moting functional ingredients like immunoglobulin and lactoferrin (WPC), isoflavones (soy flour) and omega-3- fatty acids (fish) [13,14]. The study aimed at the develop- ment of a slowly digestible functional pasta from sweet potato, which also has high protein content. Despite its cultivation in many states of India, there are no processed products having commercial potential and this has prom- pted the study.
2. Materials and Methods
2.1. Samples
Pale cream fleshed, white-skinned sweet potato variety
viz., Sree Arun, grown at CTCRI Farm, was used for the study. Roots harvested at 105 days after planting were cleaned free of dirt, and healthy, undamaged roots were selected for the preparation of edible grade flour. Refined wheat flour (RWF) was purchased from the local market. Whey Protein Concentrate (WPC; Procon 3700) with crude protein and fat contents of 70.0% and 4.32% res- pectively was purchased from M/s Mahaan Proteins Ltd. Uttar Pradesh, India. Defatted soy flour (Vigorsoy) (DSF) having crude protein and fat contents of 53.0% and 0.6% respectively was purchased from the local market. Edible grade fish powder (crude protein and fat content of 75% and 14% respectively) was made by drying the cleaned fish (Indian anchovy; Stolephorus indicus) for 18h under sun light, powdering and sieving through a 355 micron mesh size sieve. Gelatinized cassava (Manihot esculenta
Crantz) starch (3.0%) was used as a binder in the pasta formulations. Based on the optimization studies using 1.0%, 3.0% and 5.0% cassava starch, 3.0% cassava starch was used as binder for the pasta, as the water requirement of the pasta mix was low coupled with good cooking qua- lity for this level.
2.2. Preparation of Edible Grade Sweet Potato Flour
Sweet potato roots were peeled and sliced to round discs
of Ca. 0.5 cm thickness. The slices were soaked in acetic acid (1.0% w/v; 1.0 kg sweet potato slices per 5.0 L water) for 1 h to eliminate the browning problem, after which they were washed in running water and dried in the sun light for 36 h. Dried chips were powdered in a blender and sieved (mesh: 355 micron) to obtain fine sweet potato flour (SPF).
2.3. Pasta Formulations
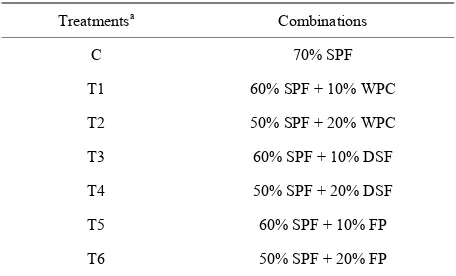
Treatment details for the various combinations are given in Table 1. All the formulations had 3% cassava starch
(w/w basis) which was gelatinized with distilled water (100 ml) and added to the rest of the dry mix for each treatment. Starch was gelatinized by double plate method at 100˚C for 15 min.
2.4. Preparation of Pasta
Requisite quantity of water (standardized through re- peated trials to get the smooth outer finish) was added to the mix from each treatment and uniformly kneaded in the Mixing Chamber of Italian Pasta making machine (P3 Model from M/s La Monferrina, Italy). Pasta was extruded at room temperature (30˚C ± 1˚C) using the round die (No. 62) and cut to short pieces of length 3.0 cm. The freshly extruded pasta tubes had an internal diameter of
Ca. 0.5 cm and were dried at 50˚C in an air oven for 18 h to get a product with <12.0% moisture content.
2.5. Hydration Level
Water requirement for each pasta mix was quantified, as it was important to obtain pasta with smooth outer finish and non-breakable nature. Hydration level (%) was cal- culated as water added (ml) × 100/weight of pasta mix (g) [15].
2.6. Cooking Procedure
[image:2.595.309.537.563.701.2]Pasta samples were dried to constant weight at 105˚C for
Table 1. Formulations for protein fortified sweet potato pas- ta.
Treatmentsa Combinations
C 70% SPF
T1 60% SPF + 10% WPC
T2 50% SPF + 20% WPC
T3 60% SPF + 10% DSF
T4 50% SPF + 20% DSF
T5 60% SPF + 10% FP
T6 50% SPF + 20% FP
aAll the formulations had 27% refined wheat flour (RWF) and 3% gela-
2 - 3 h. Fifty gram of dry pasta was added to 500 ml boiling water containing 1.0 g sodium chloride. Optimum cooking time (OCT) for each sample (al dente point) was determined using the Approved Method 66 - 50 [16], and corresponded to the time of disappearance of the white central part of the pasta. After the specific OCT for each sample, the cooked pasta was drained and surface water removed by keeping over a thin muslin cloth.
Swelling Index (SI) of cooked pasta (g water absorbed per g of dry pasta) was determined as (weight of cooked pasta-weight of dry pasta)/weight of dry pasta [17]. Cooking loss (%) was determined by drying the water drained from cooked pasta at 105˚C and expressing the weight of residue as percentage of original pasta sample [18].
2.7. Protein Nutritional Quality
The crude protein content of cooked pasta samples was determined by the Kjeldahl method [19]. A modified method of Bidingmeyer et al. [20] was used for deter- mining the amino acid profile of pasta samples. Amino acid analysis was done (in duplicate) only on 10% pro- tein fortified pasta and compared with the control pasta. Samples (100 mg) were hydrolyzed with 10.0 ml of 6.0 N HCl in sealed tubes (under N2 gas) for 24 h at 110˚C.
The hydrolysates were flash evaporated for complete removal of acid and the volume was made up to 5.0 ml using 0.05 N HCl. Amino acids in the hydrolysates were derivatised using phenyl isothiocyanate and the phenyl- thiocarbamyl amino acids were analysed using waters Pico- Tag amino acid analysis system, with waters 2487 Dual λ
absorbance detector and Pico-Tag column (15.0 cm length and 3.5 cm dia). Tryptophan was estimated by the ninhydrin method of Szakács and Perl [21].
Essential amino acid (EAA) score was calculated using the formula [22]
g EAA in test sample g total EAA in test sample
g EAA in whole sample 100
g EAA in egg
Essential amino acid index (EAAI%) was calculated as per the formula of Oser [23] from the ratio of the total EAA in test sample to the total EAA in whole egg pro- tein and expressed as percentage. Biological value (BV) was calculated using the formula of Oser [24] as:
BV 1.09 EAAI % 11.7
Nutritional index (NI) was calculated using the for- mula of Crisan and Sands [25] as:
EAAI % Pr otein %
NI
100
Computed protein efficiency ratio (C-PER) was calcu- lated according to the formula of Satterlee et al. [26] as:
2C PER 2.1074 7.1312 SPCR
2.5185 SPCR
where SPCR is the ratio the total EAA score for test sample to total EAA score for casein.
Nitrogen solubility index (NSI) was determined by the method of Obulesu and Bhagya [27]. One gram dry pasta flour was suspended in 20.0 ml distilled water and after adjusting the pH to 7.0, the suspension was shaken for 1 h using a rotary shaker at room temperature. The clear supernatant obtained by centrifugation at 8000 rpm for 10 min, was used to determine soluble nitrogen by Kjel- dahl method [19]. Values are expressed as percentage of total N in the material.
In vitro protein digestibility was determined by the procedure of AOAC [19] with slight modifications. Dried pasta powder (100 mg) was suspended in 10.0 ml distilled water and allowed to hydrate for 1h. The pH of the sample was adjusted to 8.0 and equilibrated for 30 min at 37˚C. One tablet of Panzynorm-N (manufactured by M/s German Remedies India, Ltd., Mumbai, India) containing 10,000 units of lipase, 9000 units of alpha- amylase and 500 units of protease, was dissolved in 5.0 ml sodium phosphate buffer (0.1 M; pH 8.0). One mi- lliliter of the digestive enzyme was added and incubated at 37˚C for 1 h. Enzyme and sample blanks were also si- multaneously kept and after the reaction period, the en- zyme was heat killed and the total amino acid content in the supernatant was quantified using ninhydrin reagent [28]. In vitro protein digestibility is expressed as mg amino groups (Leucine equivalent) released per h per 100 g cooked pasta (dwb).
2.8. In Vitro Starch Digestibility
Nutritional and Functional Characteristics of Protein-Fortified Pasta from Sweet Potato 947
Samples were incubated at 37˚C for 1 h, after which 40.0 ml sodium phosphate buffer (0.02 M; pH 6.9 containing 0.12 M sodium chloride) was added. After equilibrating for 10 min at 37˚C, 1.0 ml Panzynorm N (one tablet dis- solved in 5.0 ml 0.02 M sodium phosphate buffer pH 6.9) was added and incubation continued for 20 min. One milliliter of the supernatant was withdrawn and heat in- activated at 100˚C. The aliquot was added to 3.0 ml so- dium acetate buffer (0.2 M; pH 4.8) and incubated at 60˚C for a further 10min with 0.25 ml Dextrozyme GA (M/s Novo Industries, Denmark). Incubation of the Pan- zynorm assay system was continued up to 120 min and aliquots of 1.0 ml were withdrawn at every 20 min inter- val. Samples were treated identically with 0.25 ml Dex- trozyme GA. Glucose content in each aliquot was quanti- fied using Glucose oxidase (EC 1.1.3.4)—peroxidase (EC 1.11.1.7) reagent (M/s Beacon Diagnostics Pvt. Ltd. Gu- jarat, India). Starch measured at 20 min [Glucose ex- pressed as (g/100g pasta) × 0.9] was taken as the rapidly digested starch (RDS) and that measured at 120 min. was taken as RDS + slowly digested starch (SDS) [32] Resis- tant starch (RS; starch remaining undigested after 120 min.) was computed as the difference between total starch content in the cooked pasta (g/100 g dwb) and (RDS + SDS)120min. Separate enzyme and substrate
blanks were maintained for each sample.
2.9. Scanning Electron Microscopy (SEM)
Scanning Electron Microscopy gives information about the size, shape and arrangement of particles in the pasta matrix [33]. Cooked pasta (as per the method described earlier), immediately after cooking was surface dried by blotting the adherent water on a filter paper (Whatman No. 1) was transversely cut using a razor blade and the sample was mounted onto brass stubs using double-sided carbon conductive adhesive tape. A gold coating (10 - 15 mm thick) was then applied using JEOL JFC 1600 mag- notron sputtering unit with 10 mA current for 80 seconds. Bulk samples were examined at 10 kV and 1 Pa vacuum using a JEOL JSM6390 LV scanning electron micro- scope (Oxford, UK).
3. Results and Discussion
Sweet potato is being increasingly realized as a health food due to its anti-oxidant, anti-diabetic and low gly- caemic properties. Since sweet potato lacks gluten type proteins, incorporation of appropriate protein additives was necessary to maintain the quality of sweet potato pasta which also helped in augmenting the protein nutritional quality of pasta. With a view to enhancing the utilization of sweet potato, an easy to cook nutritionally fortified, low glycaemic pasta was developed from sweet potato flour using protein sources like whey protein con-
centrate (WPC), defatted soy flour (DSF) and fish po- wder (FP) and the nutritional, cooking as well as di- gestibility characteristics were studied.
3.1. Cooking Characteristics
3.1.1. Hydration Level
The control pasta made with 70% sweet potato flour had the highest hydration level (HL; 50%) indicative of the high water holding capacity of the flour. Among the three protein sources, HL (%) was the highest for WPC-fortified pasta (40%) (Table 2). Traditional pasta
[image:4.595.309.537.558.702.2]from durum wheat semolina has been reported to require 25% - 34% water and dough containing non-traditional ingredients requires more water to attain proper con- sistency and non-breakable nature [15]. During pasta making, starch and proteins undergo structural changes and the wheat proteins are responsible for the absorption of water during mixing and cooking, imparting the com- pact texture to durum semolina pasta [7]. Water re- quirement for each pasta mix may be different depending on the type of ingredients. In our study, we have used 3% gelatinized cassava starch as a binder for the pasta and hence a strong dough was obtained that could be uni- formly extruded at around 35˚C - 37˚C. Tam et al. [34] reported the use of pre-gelatinized maize starch as a bin- der in the preparation of Bihon-type noodles from maize starch. As the temperature during mixing was below 40˚C in our study, there may not be any structural chan- ges induced in sweet potato starch. Vansteelandt and Del- cour [35] also observed that structural changes in wheat starch do not occur at the mixing stage except the absorp- tion of water. Lowest hydration level (%) was obtained for FP-fortified pasta mix and we used fish powder having a fat content of Ca. 14%. Ingredients with higher levels of lipid are reported to lower the water require- ment during pasta making [15].
Table 2. Hydration level, cooking loss and swelling index of high protein pasta from sweet potato.
Treatmentsa Hydration level
(%)
Cooking loss (%)
Swelling Index (SI)
Control 50 12.86 ± 0.12 1.43 ± 0.01
T1 40 11.45 ± 0.75 1.47 ± 0.15
T2 40 12.06 ± 0.12 1.40 ± 0.06
T3 30 10.90 ± 0.12 1.56 ± 0.05
T4 36 13.40 ± 0.69 1.60 ± 0.03
T5 26 13.90 ± 0.46 1.66 ± 0.00
T6 26 16.06 ± 0.00 1.75 ± 0.15
aAll the formulations had 27% refined wheat flour (RWF) and 3% gela-
3.1.2. Cooking Loss
The quantity of solids going into water during cooking of pasta is a determinant of pasta quality and compact textured pasta leads to lower cooking loss. We found that the optimal cooking time (OCT) determined as per the AACC method was 2 - 4 min for the various pastas (data not shown), which was much less than the reported values of 7 - 9 min for the traditional durum wheat pasta [10]. Cooking loss was quantified at the OCT and it was found that all the pasta samples had higher cooking loss
(Table 2). Fish powder fortification led to higher
cooking loss (12% - 16%) for the pasta, indicative of a weaker starch-protein interaction, which gets disrupted during cooking. Rayas-Duarte et al. [36] obtained higher cooking loss in spaghetti fortified with 30% buckwheat, amaranth or lupin flours and attributed this to the weak- ing of gluten. Limroongreungrat and Huang [12] found that pasta made from 100% alkali-treated sweet potato flour had the lowest cooking loss (9.9%), while DSF fortification raised the cooking loss to 11% - 16%. Petitot
et al. [10] also reported higher cooking loss in semolina pasta fortified with 35% split pea or faba bean flours, as compared to only 5.6% in durum wheat semolina pasta.
Higher cooking loss resulting from the dilution of gluten and weakening of starch-protein network was also reported in wheat spaghetti fortified with legume flours [36]. On the contrary, very low cooking loss of 1.6% - 1.8% was only reported in corn starch based Bihon-type noodles, where the manufacturing process itself involves gelatinization of starch prior to drying [34], which in- dicates that starch gelatinization and adhesion can help reduce cooking loss. Malcolmson et al. [37] observed that cooking loss of optimally cooked spaghetti was in- fluenced primarily by the protein level and entrapment of gelatinized starch in protein network could prevent the leaching of starch components.
3.1.3. Swelling Index
Swelling Index (SI) of pasta is an indicator of the water absorbed by the starch and proteins during cooking, which is utilized for the gelatinization of starch and hydration of proteins. Higher swelling index was ob- tained in our study for the pasta fortified with DSF and FP compared to the control pasta which had a SI of 1.43
(Table 2). Gelencsér et al. [5] reported SI values of 1.8 -
1.9 for pasta from two wheat varieties like Triticum aestivum and T. durum and found no differences during fortification with resistant starch. Tudoricăet al. [33] re- ported SI values of 1.85 for durum semolina pasta, while higher values were obtained for fiber-fortified pasta. Spaghetti fortified with buckwheat, amaranth and lupin flours were reported to swell 2.9 - 3.0 times during cooking [36]. Non-wheat ingredients lead to discontinuity
within the gluten matrix and result in weak dough pro- perties [15]. During cooking of pasta, starch absorbs water and swells and the granular structure collapses lea- ding to the leaching of amylose. Sweet potato pasta for- mulations used in our study had 27% refined wheat flour. However, addition of non-wheat ingredients like sweet potato flour and protein sources could have led to di- lution of glutens. Nevertheless, the restricted swelling (low SI values) in the pasta products compared to the reported values of 1.8 - 1.9 for durum semolina pasta indicates that the added proteins also may be competing with starch for water. Tudoricăet al. [33] reported that the uneven distribution of water within the pasta matrix due to the competitive hydration of fiber, led to pre- vention of starch swelling and hence the increased coo- king loss was due to the disruption of protein-starch network.
3.2. Protein Nutritional Quality
Although pasta is a rich source of carbohydrates, wheat proteins are low in essential amino acids such as lysine and threonine [8]. Legume flours rich in lysine have been used for pasta and spaghetti fortification [15,36]. We have produced high protein sweet potato pasta using three protein sources like whey protein concentrate (WPC), defatted soy flour (DSF) and fish powder (FP) each hav-ing specific functional attributes as well. The crude pro-tein content could be significantly enhanced in the pasta, with highest values being obtained for WPC(20%) and DSF (20%) fortified pasta.The crude protein contents in the pasta were 5.14% (control), 9.41% (T1), 16.44% (T2), 9.85% (T3), 15.32% (T4), 10.29% (T5) and 12.84% (T6). The dry protein sources like WPC, DSF and FP (Indian anchovy) had crude protein contents of 70, 53% and 75% respectively.
The detailed amino acid pattern of the control as well as 10% protein fortified pasta was only studied and the essential amino acids (EAA) were compared with the FAO reference pattern [38] for school going children (10 - 12 years) and adults who are the likely consumers and the pattern for wheat flour pasta. It was found that lysine enhancement was the major advantage obtained through fortification with WPC (5.30 g/100 g protein), DSF (4.58 g/100 g protein) and FP (4.05 g/100 g protein), while the wheat flour pasta had a reported value of only 2.01 g/100 g protein [39]. The control pasta had almost similar level (1.91 g/100 g) of lysine only (Table 3). The lysine
Nutritional and Functional Characteristics of Protein-Fortified Pasta from Sweet Potato 949
Table 3. Amino acid pattern (g/100 g protein) of protein enriched pasta from sweet potato.
Amino acid content
FAO/WHO/UNU reference pattern (1985) [38] Amino acid
Control WPC fortified (T1) DSF fortified(T3) FP fortified(T5)
Children 10 - 12 years Adult
Wheat flour pastab
Essential
Ileu 2.95 3.96 3.08 2.41 2.82 1.30 4.17
Leu 5.01 7.79 5.75 4.78 4.40 1.90 7.65
Lys 1.91 5.30 4.58 4.05 4.40 1.60 2.01
Met + Cys 2.18 3.14 2.08 2.18 2.20 1.70 4.02
Phe + Tyr 7.10 6.57 6.95 5.39 2.20 1.90 7.81
Thr 4.10 4.95 4.13 4.52 2.80 0.90 2.88
Val 3.47 4.40 3.86 3.11 2.50 1.30 4.99
Try 0.72 0.77 0.79 0.74 0.90 0.50 0.96
Non-essential
Asp 6.16 10.52 10.35 7.29 4.67
Glu 16.24 21.22 21.19 13.45 32.22
Ser 4.29 5.49 5.59 3.65 5.21
Gly 3.39 2.63 3.43 7.26 NRa NRa 3.25
His 2.27 2.21 2.40 2.53 2.07
Arg 4.30 3.54 5.80 13.83 3.62
Ala 2.94 3.66 3.47 4.75 3.29
Pro 6.82 6.22 5.41 3.69 10.91
aNR- Nothing reported; b[39] in the Reference Section.
4.3%) was reported in spaghetti fortified with buck wheat, amaranth and lupin flours [36]. We found that the level of lysine enhancement that could be achieved through protein fortification in sweet potato pasta was highly significant. Aspartic acid levels were higher in the pro- tein-enriched pasta than wheat flour pasta, while two non- essential amino acids, Arginine and glycine were very high in FP-fortified pasta (Table 3).
Essential amino acid scores (EAA score) for protein- enriched pastas from sweet potato show very high values for Thr > Leu > Lys > Ileu for WPC-pasta, Thr > Phe + Tyr > Leu > Lys for DSF-pasta and Thr > Phe + Tyr > Lys > Leu for FP-pasta (Table 4). Whilst lysine was the
first limiting amino acid (LAA) for control pasta, it was not a LAA for the three protein fortified pastas. Try- ptophan was the first LAA for WPC-pasta, while it was the second LAA for the other two protein-enriched pastas. Threonine, reported as the 2nd limiting amino acid for
wheat pasta [8], had the highest score for all the three
protein fortified pasta. There are no reports on the de- tailed amino acid scoring pattern for durum wheat pasta or any of the several protein-fortified pasta, except for the total protein or lysine content [36]. The essential ami- no acid composition of defatted soy flour has been stu- died by Obulesu and Bhagya [27], who found that Met + Cys was less (1.8 g/100 g protein), while Phe + Tyr (8.0 g/100 g protein) was higher than the FAO reference pattern. Essential amino acid score of WPC-80 (with 80% protein) was studied by Sindayikengera and Xia [40], who found that Val, Phe + Tyr and Ileu were the 1st,
2nd and 3rd LAA respectively. Highest scores were re-
ported for Met + Cys, Lys and Thr. We found that the WPC fortified pasta had Met + Cys as the 2nd LAA and
the difference could have occurred from the WPC-70 (with 70% protein) used in our studies.
[image:6.595.61.538.100.463.2]Table 4. Essential amino acid (EAA) score for protein en- riched pasta from sweet potato.
Essential amino acid score EAA
C T1 T3 T5
Ileu 97.55 130.95 101.85 79.70
Leu 104.03 161.75 119.39 99.25
Lys 48.72 135.20 116.84 103.32
M + C 68.30 98.37 65.16 68.30
P + T 136.33 126.15 133.45 103.49
Thr 155.77 188.07 156.91 171.73
Val 93.88 119.05 104.44 84.14
Try 75.63 80.88 82.98 77.73
1st LAA Lys Try M + C M + C
2nd LAA M + C M + C Try Try
3rd LAA Try Val Ileu Ileu
(C-PER) given in Table 5 are parameters to assess the
protein nutritional quality of sweet potato pasta. The former two indices like EAAI and BV were much higher for WPC-pasta and DSF-pasta than the control SP-pasta. Highest BV (70.34) for WPC-pasta indicates the superior quality of the protein, which is also substantiated by the high EAAI (%) of 75.27. Nutritional index (NI) and C-PER were also the highest for WPC-pasta. Fish pow- der fortified pasta had EAAI (%) and BV similar to the control pasta. Nevertheless, the NI was much higher (9.32) than the control pasta (4.31), resulting from the high crude protein content in it. Sindayikengera and Xia [40] reported EAAI (%), BV, NI and C-PER for WPC-80 as 72.28, 67.09, 58.42 and 4.85 respectively and the high NI value corresponds to 80% protein in WPC-80. We had used only 10% WPC-70 for protein fortification in pasta and hence the difference in NI. Obulesu and Bhagya [37] also reported EAAI (%), BV, NI and C-PER values of 76, 71, 42 and 1.6 respectively for defatted soy flour with a crude protein content of 55%. Nutritional in- dex values of 6.14 were obtained for the 10% DSF for- tified pasta in our study, which had crude protein content of 55%.
3.2.1. Nitrogen Solubility Index
The nitrogen solubility index (NSI) expressed as per- centage of total nitrogen for the control as well as 10% protein-fortified pasta reduced significantly in the fortified samples (Table 5). Whilst the control pasta had
NSI of 14.0%, it decreased to 10.0%, 8.0% and 6.0% respectively for the WPC, DSF and FP-fortified pasta.
Table 5. In vitro protein digestibility and Nutritional indices of protein-fortified pasta from sweet potato.
Parameters C T1 T3 T5
EAAI (%) 56.00 75.27 63.71 55.47
BV 49.34 70.34 57.74 48.76
NI 4.31 11.59 6.14 9.32
C-PER 1.37 2.09 1.68 1.40
IVPD 479.96 496.64 488.48 491.72
NSI (%) 14.00 10.00 8.00 6.00
The decreased NSI resulted from the starch-protein in- teractions occurring during the pasta making processes. Such interactions could mask the polar side-chains of proteins, leading to less protein solubility. Obulesu and Bhagya [27] reported that the NSI of soy flour was 79% and it reduced to 12% in soy protein isolate. Sindayi- kengera and Xia [40] also reported high solubility (>80%) indices for WPC-80 and sodium caseinate and enzyme- mediated hydrolysis further increased the solubility. The compact texture of the dry pasta resulting from protein- starch interactions might have resulted in the low protein solubility in our study.
3.2.2. In Vitro Protein Digestibility
Although nitrogen solubility was reduced for the pro- tein-fortified pasta, in vitro protein digestibility(mg leu- cine equivalent/h/100 g dry pasta) was significantly high for the three 10% protein-fortified pasta as compared to the control pasta. There was no significant difference in IVPD between the three types of proteins (Table 5).
Proportionate increase in IVPD was reported with increase in the degree of hydrolysis of WPC-80 and so- dium caseinate [40]. Obulesu and Bhagya [27] also re- ported high protein digestibility for DSF and soy protein isolate.
3.3. In Vitro Starch Digestibility (IVSD)
Pasta is a widely popular carbohydrate diet, with a unique feature of progressive release of carbohydrates, leading to low postprandial glucose and insulin response. There are a large number of studies on the starch digesti- bility of traditional durum semolina pasta as well as that fortified with non-traditional ingredients [4,5,7]. We found that the sweet potato pasta (control and protein- fortified) also exhibited the “lente” (slow release) proper- ties and glucose was released into the in vitro system in a progressive manner. The control SPF-pasta had the high- est IVSD of 51.47 units at 120 min while least IVSD was observed for the WPC (10 and 20%) fortified pasta (T1 nd T2; Table 6). Among the three sources, DSF was the
[image:7.595.309.537.111.231.2]Nutritional and Functional Characteristics of Protein-Fortified Pasta from Sweet Potato 951
Table 6. Time course production of glucose during digestion of starch in sweet potato pasta.
Time (min) Treatmentsa
20 40 60 80 100 120
C 44.93 ± 2.40 46.13 ± 0.59 47.25 ± 0.66 49.71 ± 1.21 51.19 ± 1.78 51.47 ± 0.59
T1 37.80 ± 1.35 38.23 ± 0.96 38.64 ± 0.00 39.87 ± 0.74 43.23 ± 1.27 46.40 ± 1.50
T2 42.80 ± 0.82 43.92 ± 0.00 44.47 ± 1.06 45.43 ± 3.00 48.03 ± 1.33 48.80 ± 1.47
T3 46.67 ± 2.83 47.43 ± 3.37 49.80 ± 4.19 51.30 ± 3.47 53.74 ± 0.00 58.33 ± 1.37
T4 51.43 ± 3.00 55.10 ± 3.14 56.56 ± 0.00 58.40 ± 1.90 58.63 ± 3.07 61.23 ± 2.27
T5 45.20 ± 2.39 47.67 ± 0.32 48.57 ± 0.70 52.17 ± 1.87 52.87 ± 2.91 55.53 ± 0.00
T6 48.17 ± 1.51 48.97 ± 2.03 49.10 ± 1.90 49.77 ± 1.67 55.77 ± 2.16 57.50 ± 1.49
aT1, T3 and T5 had 60% sweet potato flour, while T2, T4 and T6 had 50% sweet potato flour; all the formulations had 27% refined wheat flour (RWF) and 3%
gelatinized cassava starch; each value is Mean ± S.D.
least effective in reducing the IVSD of SPF-pasta. Sig- nificantly lower starch digestibility was observed for T1 (10% WPC fortification) which increased in the 20% WPC fortified pasta (T2). Sweet potato has been reported as a low glycaemic food with a glycaemic index (GI) of <55 [2].
Combining the low glycaemic property of sweet potato with the “lente” property of pasta, we have obtained pasta having low in vitro starch digestibility. Petitot et al.
[7] observed that the enzymatic susceptibility of starch in pasta depends on the special organization and structural state of the components. The low degree of mastication and large particle size limiting the surface area over which amylase can act also contribute to the slow in vivo
release of glucose [32].
The digested starch fractions such as rapidly digested starch (RDS; starch digested in the first 20 minutes of enzyme action), slowly digested starch (SDS; starch digested from 20 min to 120 min) as well as the resistant starch (RS; starch remaining undigested after 120 min. calculated as [Total starch (data not shown) – (RDS + SDS)] were quantified for the control as well as protein-fortified pasta. It was found that the RDS fraction was the highest for control SPF-pasta and the lowest for 10% WPC-fortified pasta (Table 7; T1 and T2). Slowly
digested starch was more in the T3 (10% DSF) and T5 (10% FP) treatments. Resistant starch fraction was the highest in T1 (17.08 g/100 g cooked pasta, dwb), follow- ed by T3 and T5. Increasing the level of proteins from 10% to 20% increased starch digestibility and hence the RDS fractions were more and RS fractions less in the 20% fortified samples (Table 7). This also corresponded
[image:8.595.308.537.326.463.2]with the IVSD data, where higher glucose levels were obtained for 20% protein fortified samples. Resistant starch showed significant difference between 10% and 20% fortification levels. Gelencsér et al. [41] studied the
Table 7. Rapidly digested, slowly digested and resistant starch fractions (g/100 g cooked pasta on dry basis) in the high protein pasta from sweet potato.
Treatmentsa RDS SDS RS
C 40.44 ± 2.43 5.89 ± 3.08 12.67 ± 1.41
T1 34.02 ± 1.21 7.74 ± 0.99 17.08 ± 1.35
T2 38.52 ± 0.74 5.40 ± 1.67 11.51 ± 1.33
T3 42.00 ± 2.55 10.50 ± 3.18 15.80 ± 1.23
T4 46.29 ± 2.70 8.82 ± 3.29 9.72 ± 2.04
T5 40.68 ± 2.15 9.30 ± 2.15 14.82 ± 0.00
T6 43.35 ± 1.36 8.40 ± 0.41 8.05 ± 1.34
aTreatment details as in
Table 6; all the formulations had 27% refined wheat flour (RWF) and 3% gelatinized cassava starch; each value is Mean ± S.D.
3.4. SEM Studies
The cooked pasta from control (SPF-RWF blends with 3% gelatinized cassava starch) presented a smooth outer surface and the starch and protein were not separately visible in the SEM pictures. Small cracks and open areas were visible in the control sweet potato pasta (Figure 1(a)). Starch granules were not visible as they were
embedded in a strong protein starch network. Sweet potato pasta fortified with 10% and 20% whey protein concentrate (WPC) also exhibited a strong starch protein network formation and the gelatinized starch granules could not be differentiated in the SEM pictures (Figure
(a)
(b)
(c)
Figure 1. (a) SEM pictures of control sweet potato pasta (×2500); (b) SEM pictures of 10% WPC fortified sweet potato pasta (×2500); (c) SEM pictures of 20% WPC for- tified sweet potato pasta (×2500).
1(b), (c)). Sheet like structures, holding the gelatinized
starch inside them were also evident and the thickness of folds was more at 20% fortification (Figure 1(c)). Forti-
fication of sweet potato pasta with defatted soy flour (DSF) resulted in a slightly loosened network as eviden- ced from the SEM pictures and fully swollen starch granules as well as gelatinized starch without compact shape were visible and the protein-starch network was also visible on the edges (Figures 2(a), (b)). The loose
protein starch network formation in DSF-fortified sweet potato pasta was also supported by the in vitro starch digestibility kinetics, where the time course release of glucose was higher than the 10% and 20% WPC pasta (Table 6), indicating the enhanced entry of α-amylase
into the loose protein-starch network. Fish powder (FP)- fortified pasta samples had the least protein-starch network formation as evidenced from the SEM pictures (Figures 3(a), (b)). Starch granules were fully swollen
during cooking and had lost their shape. Leaching of amylase would have also resulted in higher cooking loss as well as higher in vitro starch digestibility (Tables 2
and 6 respectively). Exposure of discrete “uncovered”
starch granules and discontinuous protein matrix were also reported for pea fiber fortified durum wheat pasta [33]. SEM photographs of protein fortified sweet potato pasta indicate that WPC could mimic gluten in the in-
(a)
(b)
[image:9.595.94.252.250.674.2] [image:9.595.345.502.411.683.2]Nutritional and Functional Characteristics of Protein-Fortified Pasta from Sweet Potato 953
(a)
(b)
Figure 3. (a) SEM pictures of 10% FP fortified sweet potato pasta (×2500); (b) SEM pictures of 20% FP fortified sweet potato pasta (×2500).
formation of a strong starch-protein network.
4. Conclusions
High protein pasta, with low starch digestibility was developed from pale cream fleshed sweet potato, using protein sources like whey protein concentrate, defatted soy flour and fish powder. The products exhibited high Swelling Index and significantly high lysine and threo- nine contents. WPC-fortified sweet potato pasta, which is hitherto unreported, had high values for Essential amino acid index, biological value, nutritional index and protein efficiency ratio. In vitro starch digestibility progressed slowly over a period of 2 h for all the pastas, with the lowest values for the WPC-fortified pasta. Scanning.
Electron Microscopic studies provided evidence for the formation of strong protein-starch network in WPC- fortified sweet potato pasta, while the other two protein sources such as defatted soy flour and fish powder re- sulted in a loose network leading to higher starch di- gestibility than WPC pasta. Resistant starch content was the highest for WPC-pasta indicating its potential as a low glycaemic food suited to type 2 diabetic patients, obese patients and weight conscious people.
5. Acknowledgements
We acknowledge the support extended by the Sophisti-
cated Testing and Instrumentation Center, Cochin Uni- versity of Science and Technology, Kerala for the Scan- ning Electron Microscopic studies on pasta and the fa- cilities provided by the Director, CTCRI, India to under- take the work.
REFERENCES
[1] FAO Statistical Database, “Sweet Potato Production Statis- tics,” 2011.
http://faostat.fao.org/site/567/DesktopDefault.aspx?PageI D=567
[2] I. Björck, H. Liljeberg and R. Ostman, “Low Glycaemic Index Foods,” British Journal of Nutrition, Vol. 83, Sup-plement 1, 2000, pp. S149-S155.
[3] H. King, R. E. Aubert and W. H. Herman, “Global Bur-den of Diabetes 1995-2025: Prevalence, Numerical Es- timates and Projection,” Diabetes Care, Vol. 21, No. 9, 1998, pp. 1414-1431.doi:10.2337/diacare.21.9.1414
[4] I. Goni and C. Valentin-Gamazo, “Chickpea Flour Ingre-dient Slows Glycemic Response to Pasta in Healthy Vol-unteers,” Food Chemistry,Vol. 81, No. 4, 2003, pp. 511- 515.doi:10.1016/S0308-8146(02)00480-6
[5] T. Gelencsér, V. Gal, M. Hodsayi and A. Salgo, “Evalua-tion of Quality and Digestibility Characteristics of Resis-tant Starch Enriched Pasta,” Food and Bioprocess Tech-nology: An International Journal,Vol. 1, No. 2, 2008, pp. 171-179.doi:10.1007/s11947-007-0040-z
[6] S. Kusano and H. Abe, “Anti-Diabetic Activity of White- Skinned Sweet Potato (Ipomoea batatas L.) in Obese Zucker Fatty Rats,” Biology & Pharmacology Bulletin, Vol. 23, No. 2326, 2000, pp. 23-26.
doi:10.1248/bpb.23.23
[7] M. Petitot, J. Abecassis and V. Micard, “Structuring of Pasta Components during Processing: Impact on Starch and Protein Digestibility and Allergenicity,” Trends in Food Science and Technology, Vol. 20, No. 11-12, 2009, pp. 521-532.doi:10.1016/j.tifs.2009.06.005
[8] C. Stephenson, “World’s Best Pasta,” Macaroni Journal, Vol. 65, 1983, pp. 4-8.
[9] M. A. Sadehi and S. Bhagya, “Quality Characteristics of Pasta Enriched with Mustard Protein Isolate,” Journal of Food Science, Vol. 73, No. 5, 2008, pp. S229-S237.
doi:10.1111/j.1750-3841.2008.00742.x
[10] M. Petitot, L. Boyer, C. Minier and V. Micard, “Forti- fication of Pasta with Split Pea and Faba Bean Flours: Pasta Processing and Quality Evaluation,” Food Research International, Vol. 43, No. 2, 2010, pp. 634-641.
doi:10.1016/j.foodres.2009.07.020
[11] L. S. Collado and H. Corke, “Use of Wheat-Sweet Potato Composite Flour in Yellow-Alkaline and White-Salted Noodles,” Cereal Chemistry, Vol. 73, No. 4, 1996, pp. 439-444.
[12] K. Limroongreungrat and Y. W. Huang, “Pasta Products Made from Sweet Potato Fortified with Soy Protein,”
[image:10.595.93.255.83.361.2][13] M. S. Anthony, T. B. Clarkson and J. K. Williams, “Ef-fects of Soy Isoflavones on Atherosclerosis Potential Me- chanisms,” The American Journal of Clinical Nutrition, Vol. 68, Supplement 6, 1998, pp. S1390-S1393.
[14] M. J. Messina, “Legumes and Soybeans: Overview of Their Nutritional Profiles and Health Effects,” American Journal of Clinical Nutrition, Vol. 70, Supplement 3, 1999, pp. S439-S450.
[15] F. A. Manthey, A. R. Yalla, T. J. Dick and M. Badarud-din, “Extrusion Properties and Cooking Quality of Spa-ghetti Containing Buckwheat Bran Flour,” Cereal Chem-istry,Vol. 81, No. 2, 2004, pp. 232-236.
doi:10.1094/CCHEM.2004.81.2.232
[16] AACC, “Approved Methods of the American Association of Cereal Chemists, (Method 66-50),”10th Edition, AACC/ Eagan Press, St. Paul, 2000.
[17] C. Mestres, P. Colonna and A. Buleon, “Characteristics of Starch Networks within Rice Flour Noodles and Mung-bean Starch Vermicelli,” Journal of Food Science, Vol. 53, No. 6, 1988, pp. 1809-1812.
doi:10.1111/j.1365-2621.1988.tb07848.x
[18] A. Debbous and C. Doctkott, “Effect of Process Variables on Spaghetti Quality,” Cereal Chemistry,Vol. 73, No. 6, 1996, pp. 673-677.
[19] AOAC, “Official Methods of Analysis,” 16th Edition, Association of Official Agricultural Chemists, Washing-ton DC, 1995.
[20] B. A. Bidingmeyer, S. A. Cohen, T. L. Tarvin and B. Frost, “A New Rapid Highly Sensitive Analysis of Amino Acids in Food Type Sample,” Journal of the Association of Analytical Chemists, Vol. 70, No. 2, 1987, pp. 241- 261.
[21] P. M. Szakács and I. M. Perl, “Determination of Trypto-phan in Unhydrolyzed Food and Feedstuff by the Acid Ninhydrin Method,” Journal of Agricultural and Food Chemistry,Vol.38, No. 3, 1990, pp. 72-726.
[22] FAO, “Amino Acid Content of Foods and Biological Data on Proteins,” Food and Agriculture Organization, Rome, 1968.
[23] B. L. Oser, “Methods for Integrating Essential Amino Acid Content in the Nutritional Evaluation of Protein,”
Journal of American Dietetic Association,Vol.27, No. 5, 1951, pp. 399-404.
[24] B. L. Oser, “Protein and Amino Acid Nutrition,” Aca-demic Press, New York, 1959.
[25] E. V. Crisan and A. Sands, “Nutritional Value of Edible Mushroom,” In: S. T. Chang and W. A. Hayer, Eds., Bi-ology and Cultivation of Edible Mushrooms, Academic Press, New York, 1978, pp. 137-168.
[26] L. D. Satterlee, H. F. Marshall and I. M. Tennyson, “Mea- suring Protein Quality,” Journal of the American Oil Che- mists Society,Vol.56, No. 3, 1979, pp. 103-109.
doi:10.1007/BF02671431
[27] M. Obulesu and S. Bhagya, “Biochemical, Functional and Nutritional Characteristics of Soy Protein Concentrate Prepared by Thermal Processing,” Journal of Food
Sci-ence and Technology,Vol.43, No. 2, 2006, pp. 161-166. [28] S. Moore and W. H. Stein, “Analysis of Amino Acids,” In:
S. P. Colowick and N. O. Kaplan, Eds., Methods in En-zymology, Academic Press, New York, 1948, pp. 468- 471.
[29] S. N. Moorthy and G. Padmaja, “A Rapid Titrimetric Method for the Determination of Starch Content of Cas-sava Tubers,” Journal of Root Crops, Vol. 28, No. 1, 2002, pp. 30-37.
[30] H. N. Englyst, J. Veenstra and G. J. Hudson, “Measure-ment of Rapidly Available Glucose (RAG) in Plant Foods: A Potential in Vitro Predictor of the Glycaemic Response,”
British Journal of Nutrition, Vol.75, No. 3, 1996, pp. 327-337.doi:10.1079/BJN19960137
[31] B. V. McCleary and D. A. Monaghan, “Measurement of Resistant Starch,” Journal of the Association of Analy- tical Chemists,Vol.85, No. 3, 2002, pp. 665-675.
[32] E. H. J. Kim, J. R. Petrie, L. Motoi, M. P. Morgenstern, K. H. Sulton, S. Mishra and L. D. Simmons, “Effect of Structural and Physico-Chemical Characteristics of the Protein Matrix in Pasta on in Vitro Starch Digestibility,”
Food Biophysics,Vol.3, No. 2, 2008, pp. 229-234.
doi:10.1007/s11483-008-9066-7
[33] C. M. Tudorică, V. Kuri and C. S. Brennan, “Nutritional and Physicochemical Characteristics of Dietary Fiber En-riched Pasta,” Journal of Agricultural and Food Chemis-try,Vol.50, No. 2, 2002, pp. 347-356.
doi:10.1021/jf0106953
[34] L. M.Tam, H. Corke, W. T. Tan, J. Li and L. S. Collado, “Production of Bihon-Type Noodles from Maize Starch Differing in Amylose Content,” Cereal Chemistry, Vol. 81, No. 4, 2004, pp. 475-480.
doi:10.1094/CCHEM.2004.81.4.475
[35] J. Vansteelandt and J. A. Delcour, “Physical Behaviour of Durum Wheat Starch (Triticum durum) during Industrial Pasta Processing,” Journal of Agricultural and Food Chemistry,Vol. 46, No. 7, 1998, pp. 2499-2503.
doi:10.1021/jf9710692
[36] P. Rayas-Duarte, C. M. Mock and L. D. Satterlee, “Qual-ity of Spaghetti Containing Buckwheat, Amaranth and Lupin Flours,” Cereal Chemistry, Vol. 73, No. 3, 1996, pp. 381-387.
[37] L. J. Malcolmson, R. R. Matsuo and R. Balshaw, “Tex- tural Optimization of Spaghetti Using Response Surface Methodology: Effects of Drying Temperature and Durum Protein Level,” Cereal Chemistry, Vol. 70, No. 4, 1993, pp. 417-423.
[38] FAO/WHO/UNU, “Energy and Protein Requirements,”
Technical Series 7241, FAO/WHO/UNU Publications, Ro- me, 1985.
[39] The Real Italian Pasta, “Nutritional Values,” 2010. http://www.pasta.go.it/values.htm
[40] S. Sindayikengera and W. S. Xia, “Nutritional Evaluation of Caseins and Whey Proteins and Their Hydrolysates from Protamex,” Journal of Zhejiang University SCIENCEB, Vol.7, No. 2, 2006, pp. 90-98.
Nutritional and Functional Characteristics of Protein-Fortified Pasta from Sweet Potato 955
[41] T. Gelencsér, V. Gal and A. Salgo, “Effects of Applied Process on the in Vitro Digestibility and Resistant Starch Content of Pasta Products,” Food and Bioprocess