A Study in Personal
Carbon Allocation:
Cap and Share
December 2008
A S
tu
dy
in
P
er
so
na
l C
ar
bo
n A
llo
ca
tio
n:
Ca
p a
nd
S
ha
re
D
ec
em
b
er
2
00
A report to Comhar SDC Sustainable Development Council, Ireland
By AEA Energy & Environment and Cambridge Econometrics
AEA Energy & Environment
Cambridge Econometrics
Authors:
Authors:
Mark Johnson
Hector Pollitt
Michael Harfoot
Unnada Chewpreecha
Courtney Musser
Jamal Tarafdar
Tricia Wiley
December 2008
A Study in Personal
Carbon Allocation:
Cap and Share
A Study in Personal Carbon Allocation: Cap and Share
Foreword
Climate change represents an enormous challenge to all of us in Ireland in the near future. We must reduce greenhouse gas emissions across all sectors in accordance with our European and international commitments. While some sectors such as power generation and large industry are included in the EU Emissions Trading Scheme (ETS), others, such as transport, residential housing and agriculture are not and new policy measures are needed to reduce emissions in these sectors also. In particular, individual actions will be needed to achieve the emissions reductions under discussion in Europe by 2020 in the non-trading sectors. Innovative and fair policies are necessary to stimulate the scale of the reductions required.
Cap and share is an idea proposed in Ireland by the Foundation for the Economics of Sustainability (FEASTA) which is based on the argument that each citizen would be given a carbon emissions allowance allocation, with the total of such allocations amounting to the desired cap.
Essentially, the scheme would operate similarly to a carbon levy but would address the problem of public acceptability since the cap is placed on upstream emissions from primary fossil fuel suppliers to the sectors included in the scheme and certificates would be issued to all adults entitling them to an equal share of the emissions permitted under that year’s cap. These certificates could then be sold to the fossil fuel suppliers via an intermediary such as a bank or post office. By capping emissions upstream the price of emissions is built into the price of fossil fuels which are passed through to the consumer. The consumer has an incentive to use less fossil fuel than the average amount for which he is compensated through the sale of the certificates.
More information at www.capandshare.org
Comhar SDC commissioned research in 2007 on Cap and Share as a policy instrument to reduce greenhouse gas emissions from Irish residential and transport sectors which are not covered by the EU emissions trading scheme. The consultants AEA Energy and Environment and Cambridge Econometrics have carried out the work on this project. AEA considered in more detail the design issues concerning the Cap and Share scheme and reviewed the merits of the proposal relative to other personal carbon allocation approaches and more traditional measures such as carbon taxes and regulation. Cambridge Econometrics performed an economic analysis of the impacts such a scheme could have using the E3ME model. The results of this work are described in this report and these findings will form the basis for any recommendations to government that Comhar SDC will make in the future on the issue.
We are grateful for the assistance of our Cap and Share Steering Group in helping oversee the project, which consisted of David Browne (Department of Transport), Donal Buckley (IBEC), John Burke (Department of Finance), Kelley Kizzier (EPA), Richard Douthwaite (FEASTA), and Mark Winkelmann (DoEHLG). A very informative stakeholder workshop was held in August 2008 where the consultants presented the results of the project to policymakers, politicians, members of the voluntary sectors, and academics. Finally, we would like to thank the Department of Transport and the EPA who co-funded this project.
Frank Convery
Executive Summary
Introduction
The challenge of climate change demands a response from all sectors of the economy. Importantly, action on the part of individuals will be required if greenhouse gas (GHG) emissions are to be cut to the levels necessary to avoid the worst consequences of climate change. However, new challenges must be overcome to achieve a shift in individual behaviour. For example, the public must be engaged with any new policy and see it as a fair and worthwhile approach. Further, any measure that engages with the public can also involve complexities associated with interactions on an individual level, which in turn can bring significant costs. To be successful, however, innovative solutions will be required and in recent years a number of novel approaches to personal carbon allocation schemes have been proposed.
One such scheme, called Cap and Share, would require fuel suppliers to surrender tradable allowances relating to the emissions from the fuel they import. The allowances would be issued freely to individuals, who would then sell them via intermediaries to the fuel suppliers. This approach would engage with the public at a fairly simple level, whilst also shielding individuals from the impact of any fuel price rises occurring as a consequence of the scheme.
Comhar SDC asked AEA and Cambridge Econometrics to consider in more detail the design issues concerning the Cap and Share scheme, and to review the merits of the proposal relative to other personal carbon allocation approaches, and more traditional measures such as carbon taxes and regulation. They also asked for an assessment of the economic impacts of the scheme in comparison with a carbon tax. The design issues were examined by AEA and the economic analysis was performed by Cambridge Econometrics using its E3ME model. This report contains a combined executive summary for the two project elements.
Part 1: Policy analysis
The Cap and Share proposal
Cap and Share was originally developed by the Foundation for the Economics of Sustainability (FEASTA) and is a regulatory and economic framework for controlling the use of fossil fuels in relation to climate stabilisation. Accepting that climate change is a global problem and that there is a need to cap and reduce GHG emissions globally, the philosophy of Cap and Share maintains that the earth’s atmosphere is a fundamental common resource. Consequently, it is argued, each individual should get an equal share of the benefits from the limited amount of fossil fuels that will have to be burned and their emissions released into the atmosphere in the period until the atmospheric concentration of greenhouse gases has been stabilised at a safe level.
Applying the scheme at a national level, a cap would be set by an independent committee and all adults would receive certificates entitling them to an equal share of the emissions permitted under that year’s cap. Certificates would then be sold, via banks or post offices, to those companies who import fossil fuels or extract them from the ground. Each of these primary fossil fuel suppliers would be required to acquire and surrender certificates equal to the emissions from the use of the fossil fuels that they introduced into the economy. By capping emissions at the upstream end of the supply system the price of emissions allowances is built into the price of fossil fuels, which then flows through the economy. However, whilst carbon-intensive products and services become more expensive, individual consumers obtain an income from the certificates that they sell and are therefore compensated. Furthermore, the higher the carbon cost the greater the compensation.
A Study in Personal Carbon Allocation: Cap and Share
received by consumers is derived from emissions from fossil fuel use in Ireland and should therefore be consistent.
The Cap and Share approach is shown simplistically in the diagram on the following page. The red arrows show the flow of allowances. The blue arrows show the increased costs associated with goods and services under the scheme and the transfer of money when allowances are sold. For example the blue line between consumers and primary fossil fuel suppliers indicates an increased price for fossil fuels.
Cap and Share
Primary Fossil fuel Suppliers
Allowance trading
Carbon cost for products and services
Government (sets cap)
Individuals
Taxpayers Consumers Emissions
Emissions
Surrender allowances for emissions from fuel supplied
Free allowances Sell
allowances
Industry Commerce and Government
Services
Revenue from allowance sales
Design issues
Scope
The Cap and Share scheme could in principle apply to the whole economy as a means of driving down emissions in all sectors. However, in practice there would be interactions with existing measures and it may be desirable to focus on certain emitting sectors.
Outside of the sectors already covered by the EU Emissions Trading Scheme (ETS), emissions from the transport sector represent the largest growing source of GHGs. Emissions from the transport sector are the fastest growing in both Ireland’s and
Northern Ireland’s economies, rising by 60% over the period 990 – 2005 in Ireland and by 44% in Northern Ireland over the same period. Transport sector emissions from the EU 27 as a whole increased by 27% from 990 to 2005.
These factors suggest that the focus of a Cap and Share scheme should be emissions from the transport sector. A second further area of potential coverage is domestic use of energy, although the EU ETS already regulates emissions from the electricity sector.
The benefits of restricting the scheme to the transport sector would be:
•
a focused move towards a more sustainable transport system,•
a simpler scheme initially and,•
the opportunity for learning before any further expansion.The advantages of wider initial implementation would be:
•
economies of scale and,•
the opportunity to understand more about the interaction between the scheme and the wider economy.There are pros and cons associated with
implementing a Republic only scheme compared with a whole of Ireland Scheme:
•
In a Republic-only scheme cross-border effects could be significant. Using the transport sector as an example, changes in the price differential between Northern Ireland and the Republic of Ireland initially would reduce fuel tourism and possibly reverse it. However, a scheme applied to the Republic would need only to interface with the EU Emissions Trading Scheme, which covers large industrial emitters and electricity generation, and the cap-setting process would be simpler.Electricity Market under the devolved powers of the Northern Ireland Executive. However, the situation for a Whole of Ireland scheme is more complex, since Northern Ireland, in addition to the EU ETS, operates the Climate Change Levy and is planning the Carbon Reduction Commitment, both regulating the business use of energy. Furthermore, consideration needs to be given regarding the setting of the cap given different emission reduction targets as well as the presence of parallel institutions and processes, for example using the National Insurance number for Northern Ireland in place of the Personal Public Service (PPS) system as a means of identifying individual participants, as discussed below.
Overall, a Republic-only scheme would be simpler to implement and we estimate that a reversal in fuel tourism would not occur before a carbon price of
€20/tCO2. It seems preferable therefore to introduce
a Republic-only scheme in the first instance, with subsequent consideration to expansion.
Equity
Any trading scheme (or non-trading instrument) has the potential to benefit some participants at the expense of others. With the Cap and Share scheme these effects would be no more significant than any other mechanism that places a cost on carbon emissions. Under the proposal, lower income households, on average, would benefit since they have lower than average energy consumption and would receive emissions certificates worth more than the increased fuel costs they incur. However, due to variability within income bands, some low income households will be worse off, and may be less able to find energy savings or absorb increased costs compared with their wealthier counterparts.
Those living in rural communities could also be disadvantaged, relative to those in towns and cities, because they are likely to travel greater distances for basic amenities. They would also have less access to low carbon public transport alternatives. This is seen as a major challenge for
climate policy in Ireland and raises issues that would apply for any mechanism that prices carbon, be it a carbon tax or trading scheme. Regarding domestic heating, those in rural communities are also likely to be disadvantaged, since the housing stock will generally be older and less efficient and access to gas (with a lower emissions factor than domestic oil) will be more limited.
Finally, the distribution of certificates to single-person households may not fully compensate them for the increased costs they would incur. A single-person household may have a similar consumption to a household with two or more adults. However, the single-person household would receive only one carbon entitlement.
There are a number of possible ways to address these equity concerns. In keeping with the principle of equal allocation, the preferred approach would be to address these equity concerns through alternative measures, such as increases in the Children’s Allowance, the domestic heating allowance or funding for public transport. These measures could be funded through general taxation or through the auction of a proportion of the emissions allowances. The former would seem preferable since using income tax, for example, would be seen to align with the concerns being addressed, whereas reducing each individual’s allocation would be seen to worsen the issue. A further possibility would be allocate more to those who would otherwise stand to lose, although this would appear to undermine the principle of the scheme.
Population coverage
A Study in Personal Carbon Allocation: Cap and Share
There is a question over the treatment of children, since they are consumers of energy but not
necessarily purchasers. Literature regarding personal trading schemes generally suggests not allocating in full to children (although the principle of equal per capita allocation underpins the Cap and Share proposal). If there were no full allocation to children consideration would need to be given to the age at which individuals are considered an adult for the purpose of the scheme. Consideration should also be given to other mechanisms to support families regarding their increased carbon costs. Less-favoured alternatives would include partial allocation to children or allocation on a household basis.
Short-stay visitors, e.g. tourists, should not be included in the scheme, although long-stay residents that register for a PPS number could be included. If this were the case then consideration would need to be given to avoiding exploitation of the scheme by visitors who gain and sell certificates and then promptly leave. An eligibility period would seem the best way to address this.
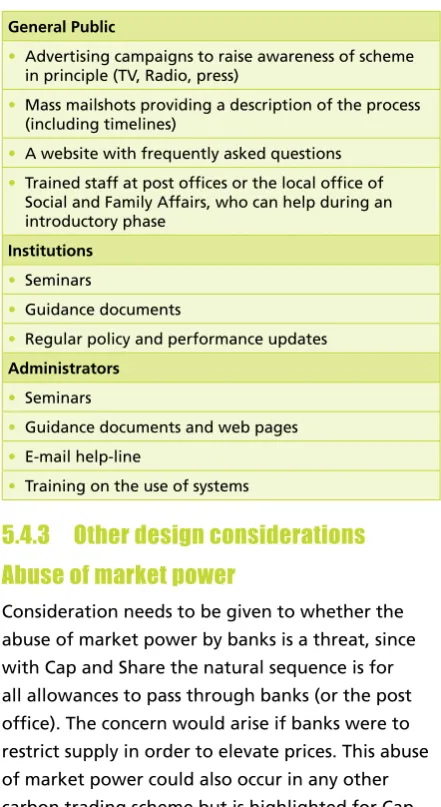
Institutional arrangements
A Government body, most likely the Department of Environment, Heritage, and Local Government, would need to be responsible for setting the framework, the objectives and dealing with any policy-related issues. It would be responsible for developing the design aspects and consulting with other institutions, industry, the public and other interest groups.
Cap setting could either be carried out by
Government or an independent body. In either case, however, the cap should be consistent with the national budget in the Climate Protection Bill and the strategy it sets for individual sectors.
The scheme would need to be run by a single administrative body. This would ensure consistent accountability for all aspects and clarity from the perspective of participants. It would also ensure the effects of any changes to approach could be managed throughout the process. The Environmental
Protection Agency (EPA), as scheme administrator for the EU ETS would be the logical choice. It could also draw on its experience from being responsible for the National Emissions Inventory. The responsibilities of this body would be to:
•
maintain the register of fuel suppliers;•
define the standards by which emissions must be reported and verified;•
produce guidance documents and;•
maintain the trading registry.In addition to the above activities there would be a number of other functions for which the scheme administrator must maintain an overview, but which may be carried out by other bodies. These would include:
•
maintaining a list of participating individuals and issuing them with certificates (for which the Department of Social and Family Affairs would have a role);•
determination and verification/audit of emissions (for which Customs and Excise would have a role);•
market regulation and;•
training and capacity building.Transaction costs
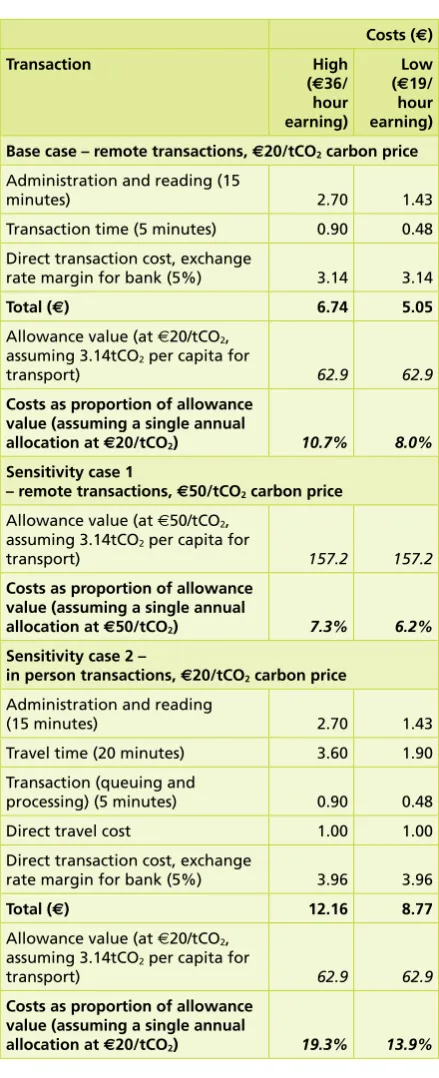
The costs of designing the Cap and Share scheme in relation to other measures are discussed below, and are, in general, expected to be lower then the more complex personal carbon allocation options, but higher than a carbon tax. For the Cap and Share scheme the cost of administering the fuel suppliers is likely to be secondary to the costs associated with issuing certificates to the general public.
8-% of the value of the certificates. This range depends on income and assumes an allowance price of €20/tCO2 and a bank direct transaction charge of
5%. Cost effectiveness improves at higher carbon prices, with transaction costs around 67% for a price of €50/tCO2. However, if participants were
required to cash in allowances in
person then the costs could be significantly higher. To minimise transaction costs for individuals to a level that will be considered acceptable, consideration would need to be given to the following:
•
Allowing on-line and postal facilities for converting certificates.•
Minimising the amount of material that an individual must understand, possibly making use of passive media such as television and radio broadcasts.•
Allowing individuals to delegate the authority to cash in allowances.•
Simplifying the requirements on banks and post offices to minimise their costs and the changes that they may charge for transactions.•
Considering the cost impacts when deciding whether to distribute certificates more frequently than yearly.Finally, the administrative costs to those industries that would be required to register, trade and surrender allowances would be small in comparison with the costs to Government and the general population as a whole.
Legal aspects
On legal aspects the European Commission is unlikely to prohibit the scheme on the basis of it constituting State aid, primarily because the scheme as a whole would not give rise to a net benefit to any commercial undertakings. However, we do identify cases that may have relevance to Cap and Share where State aid has been upheld. Therefore it is not possible to be fully conclusive on this issue. Similarly, internal market rules should not be prohibitive.
Cap and Share compared with
other measures
The policy options available to deliver emissions reductions vary considerably in their nature, from personal carbon allocation schemes to taxation to regulation. We have identified a set of key criteria and assessed each of the main options to gain an understanding of their relative merits. The results are illustrated in the following figure. Note that in this context, equity refers to the extent to which a mechanism results in a direct cost increase for individuals, since certain sectors may not be able to accommodate these costs. None of the schemes preferentially target certain groups of individuals for action, and therefore equity in this context would not differentiate the options.
Scheme
Cost Effectiveness Public Engagement Environmental Outcome Equity Simplicity
Personal carbon allocation schemes Cap and Share
DTQs/TEQs
PCR2
RAPS3
Ayres Scheme Sky Trust
Other mechanisms Carbon Tax Regulation Voluntary Schemes Fuel Excise Duty
KEY: Relative performance against each criteria
Strong Weak
Domestic Tradable Quotas/Tradable Energy Quotas 2 Personal Carbon Rationing
A Study in Personal Carbon Allocation: Cap and Share
On the basis of our simple multi-criteria and SWOT analyses the following conclusions can be drawn with respect to the personal carbon allocation schemes:
•
The schemes that treat individuals as an emitting entity (Tradable Energy Quotas (TEQs), PersonalCarbon Rationing (PCR)2, Rate All Products3 and
Services and the Ayres Scheme4) look the least
appealing, because of their complexity and the resulting costs.
•
Of those schemes, however, TEQs and PCR are less complex and costly.•
Most of the schemes can provide individuals, on average, with full compensation for increased carbon costs, with the exception being TEQs, which is the only scheme for which all of the allowances (or the value of them) are not allocated freely to individuals.•
The above suggests that PCR would currently be the favoured approach amongst the options for which individuals trade allowances. The decision between PCR, say, and the approaches of Cap and Share and Sky Trust is a balance between the improved public engagement of the first and the better cost effectiveness and simplicity of the latter two. Overall, currently, Cap and Share and Sky Trust appear favourable to PCR, although we have not assessed the full cost effectiveness of the last two.•
If Cap and Share and Sky Trust5 were favoured,the decision between the two is quite finely balanced. Cap and Share would seem to offer better public engagement although the
Energy and the Common Purpose: Descending the Energy Staircase with Tradable Energy Quotas (TEQs), David Fleming, September 2007, http://www.theleaneconomyconnection. net/downloads.html#TEQs
2 Hillman, M., and Fawcett, T., How we can save the planet, Penguin Books, pp. 26 – 33, 2004.
3 Starkey and Anderson (2005).
4 Ayres, Robert, Environmental Market Failures: Are there any local market-based corrective mechanisms for global problems? (CMER, INSEAD, Fontainebleau, France, 996). 5 http://www.capanddividend.org/files/WP50.pdf
resulting costs of engagement at an individual level would probably make it more expensive to implement than the Sky Trust.
Regarding the non-trading options, a carbon tax or use of fuel excise duty appear preferable to direct regulation or voluntary schemes on the grounds of cost effectiveness and simplicity. They are also likely to be simpler and cheaper to implement than the trading approaches and offer the opportunity to raise revenue to achieve further environmental objectives (such as emissions reductions in non-traded sectors) that would otherwise have to be generated from other sources. However, overall the lack of public engagement, uncertainty over environmental outcome and no direct compensation for individuals, mean these non-traded options score less well in our analysis than Cap and Share and Sky Trust.
Conclusions for Part 1
Overall, we have highlighted a number of key design issues relating to the Cap and Share scheme, and suggested possible ways forward. In particular:
•
A cautious approach would suggestimplementation for the transport sector only in the Republic, with subsequent consideration to sectoral and geographical expansion.
•
The scheme is not inherently inequitable, but measures would be needed to shield the vulnerable from increased costs. We suggest this be separate from the scheme itself.•
The scheme should be based on the PPS system and electoral role, with consideration given to the treatment of children. Evidence suggests not allocating to children, although again consideration will be needed for increasing support to families.Environment, Heritage, and Local Government puts in place the regulatory framework to enable Cap and Share to be implemented. Following that, the EPA would be the logical choice for the body/organisation to deal with the practicalities of the scheme.
•
Transaction costs to individuals can be acceptably low, provided they can cash in their certificates remotely (on-line or by post). We make other suggestions for reducing transactions costs.•
Of the various personal carbon allocation approaches proposed, Cap and Share and the Sky Trust currently appear the most favourable.•
Furthermore, the lack of public engagement, uncertainty over environmental outcome and no direct compensation for individuals mean that non-traded options such as a carbon tax and direct regulation score less well in our analysis than Cap and Share and Sky Trust.Part : Economic analysis
The aim of Part 2 of the study was to assess the likely economic (primarily macro, sectoral and income-distributional) and energy impacts of the introduction of a personal Cap and Share emission-trading scheme in Ireland, applied to the sectors, including road transport, which are not covered by the EU ETS.
The E3ME model (see www.e3me.com) was used to provide quantitative estimates of these impacts through a series of carefully-designed scenarios. Results for the scenarios with Cap and Share schemes were compared against the baseline used in the study and against equivalent carbon-based tax schemes. Different emission-reduction targets and an alternative set of assumptions about global oil prices were also tested to see how these affected the outcomes.
Both the Cap and Share schemes and the carbon taxes increased the effective cost of fossil fuels to end users not covered by the EU ETS (see diagram).
Energy demand falls as a result of the higher price. There may be a further fall in energy demand from the signalling and awareness effects of the Cap and Share scheme but this was not accounted for in the modelling.
In the highest emission-reduction scenarios, the Cap and Share scheme was set to achieve a 30% reduction in CO2 emissions in the non-EU ETS sectors
by 2020, compared to 2005 levels. This is broadly equivalent to reducing emissions by 3% pa over this period. A high carbon price (over €300/tCO2 at
2008 prices in 2020) was required to achieve this (see table). This outcome reflects the ambitious nature of the target but it is also partly driven by modelling assumptions, for example the limited alternative fuels for road transport and a lack of government regulation to help meet the targets.
Even with high carbon prices the economic effects of the schemes were found to be small, with only minor impacts on GDP and employment levels. Household consumption was lower compared to the baseline as higher fuel costs eroded real incomes (although spending on non-energy items increased) but Ireland’s balance of payment improved due to lower levels of fossil-fuel imports.
The economic sectors that benefited from the Cap and Share scheme are those that produce consumer services and investment goods, including fuel-efficient vehicles. Manufacturing sectors that are not included in the EU ETS will face higher production costs.
Cap and Share can be considered highly equitable, with the allowances distributed evenly to households, regardless of income. This means that lower-income households are relatively better-off compared to the baseline. Low-income households also gain on average because they spend a smaller share of their income on transport fuels. However, rural households will lose out as they typically spend twice as much of their income on transport fuels as urban households.
A Study in Personal Carbon Allocation: Cap and Share
Fuel prices
impact on economic activity. This was due to the revenue-recycling measures which accompanied the taxes (a combination of higher social benefits and lower income taxes). Low-income households (including pensioners) also benefited in the scenarios but not to the same extent as in the Cap and Share scheme. Rural households are affected by higher transport costs in the same way as in the Cap and Share scheme.
Lower emission-reduction targets and higher global oil prices resulted in a lower carbon price, as the targets are easier to achieve. For example, a 20% emission-reduction target required an allowance price closer to €60/tCO2. However, the economic
outcomes of the Cap and Share scheme were largely unaffected by these different assumptions.
Summary Scenario Results, 2020
Scheme Cap and Share Cap and Share Cap and Share CO2 Tax Cap and Share CO2 Tax
Oil Prices Standard Standard Standard Standard High High Target Reduction 30% 20% 0% 30% 30% 30% Allowance Price
(€08/tCO2) 308.8 67.2 83.9 - 22.3 -Carbon Tax Rate
(€08/tCO2) - - - 329.0 - 239.6 Change in GDP (%) 0.0 0.0 0.0 0.9 0. 0.6 Change in
Employment (%) 0.0 0.0 0.0 0.0 0.0 0.0 Allowances issued per
household (tCO2) .9 3.7 5.4 - .9
-Note(s): The target reduction is defined as % reduction in CO2 emissions, in the non-ETS sectors in 2020, compared to 2005. Changes in
GDP and employment are relative to a baseline with the same oil price assumptions as the scenario.
Source(s): E3ME.
The Impact of Cap and Share on Incomes
Cap and share Tax rates by fuel
and user Domestic supply
prices
Taxes passed on Import prices Wage rates
Prices for consumers, government, investment, exports
Higher nominal incomes/wealth
Real incomes/wealth Industrial prices
Allowances given to households Carbon content
Generation costs Imputed tax liability
Contents
Part 1 – Cap and Share: Policy Options
Introduction 5
2 Review of scope 6
2. EU ETS scope 6
2.2 EU ETS in Ireland 6
2.3 The EU ETS review 8
2.4 Sectors outside the EU ETS 20
2.5 Other climate change regulation 22
2.6 Lessons from the EU ETS 23
3 Policy approach – personal carbon allocation options 25
3. Cap and Share 26
3.2 Tradable Energy Quotas 29
3.3 Personal Carbon Rationing 32
3.4 Rate All Products and Services 35
3.5 Ayres scheme 36
3.6 Sky Trust (now more commonly referred to as Cap and Dividend) 37
3.7 Common aspects 39
3.8 SWOT Table 4
4 Policy approach – non trading options 46
4. Carbon tax 46
4.2 Regulation 49
4.3 Voluntary schemes 5
4.4 Fuel Excise Duty 53
4.5 Other policies 55
4.6 SWOT Table 57
4.7 Overview of types of policy options 60
4.8 Conclusions 60
5 Cap and Share constraints and design issues 6
5. What sectors are likely to be particularly affected by the scheme? 6 5.2 Would a Cap and Share scheme be consistent with the principles of the EU ‘internal market’? 66 5.3 What proportion of the population would be covered in the scheme? 73 5.4 What administrative and institutional arrangements would be necessary for the operation
of the scheme? 78
A Study in Personal Carbon Allocation: Cap and Share
5.8 Option to restrict Cap and Share scheme to transport sector only 96 5.9 Could the scheme be extended to cover the whole island of Ireland, what would be the
cross-border effects if Northern Ireland were not covered by the scheme? 98
5.0 Safety Valves 0
6 Conclusions 03
Part – Cap and Share: Possible Macroeconomic Effects in Ireland
Overview 05
. Introduction 05
.2 Acknowledgements 05
2 The E3ME model 06
2. Introduction 06
2.2 The theoretical background to E3ME 07
2.3 E3ME as an E3 model 07
2.4 Energy-environment links 08
2.5 Model data sources 0
2.6 Parameter estimation 0
3 Detailed methodology
3. Introduction
3.2 Baseline forecast
3.3 Formal definition of scenarios 3
3.4 Additional assumptions 6
4 Model results 20
4. Aggregate results 20
4.2 Sectoral results 23
4.3 Impacts on the fuel mix 27
4.4 Household distributional results 27
4.5 Results in the context of higher oil prices 30
5 Conclusions 32
5. Introduction 32
5.2 Economic impacts 32
5.3 Energy and environmental impacts 33
5.4 Comparing Cap and Share with carbon taxes 33
6 References 34
Appendices
AEA Energy & Environment
Authors:
Mark Johnson
Michael Harfoot
Courtney Musser
Tricia Wiley
Part 1:
1 Introduction
The challenge of climate change demands a response from all sectors of the economy. Importantly, action on the part of individuals will be required if greenhouse gas emissions are to be cut to the levels necessary to avoid the worst consequences of climate change. However, new challenges must be overcome to achieve a shift in individual behaviour. For example, the public must be engaged with any new policy and see it as a fair and worthwhile approach. Further, any measure that engages with the public can also involve complexities associated with interactions on an individual level, which in turn can bring significant costs. To be successful, however, innovative solutions will be required and in recent years a number of novel approaches to personal carbon allocation schemes have been proposed.
One such scheme, called Cap and Share, would require fuel suppliers to surrender tradable allowances relating to the emissions from the fuel they import. The allowances would be issued freely to individuals, who would then sell them via intermediaries to the fuel suppliers. This approach would engage with the public at a fairly simple level, whilst also shielding individuals from the impact of any fuel price rises occurring as a consequence of the scheme.
Comhar SDC have asked AEA to consider in more detail the design issues concerning the Cap and Share scheme, and to review the merits of the proposal relative to other personal carbon allocation approaches and more traditional measures such as carbon taxes and regulation. This report presents that analysis. A further report will describe economic analysis of the impacts such a scheme could have, which will be carried out by Cambridge Econometrics.
This report is divided into 4 main sections:
•
Section 2 reviews experience with other emissions regulation, principally the EU Emissions Trading Scheme, to identify issues important to the scope of a Cap and Share Scheme and any lessons that could apply.•
Section 3 reviews the Cap and Share proposal along with other suggested personal carbon allocation schemes. It assesses the options against key criteria and develops a SWOT analysis.•
Section 4 reviews non-trading options following the same methodology as Section 3.•
Section 5 reviews the main design issues relating to the Cap and Share proposal. Where possible it makes suggestions on ways forward where there are choices to be made and highlights possible solutions to concerns that might remain.Acknowledgment
The AEA project team would like to acknowledge the work of David Harrop in laying the foundations for this project. David tragically died before it was commissioned in full and we would like to dedicate this report to his memory.
Review of scope
The implementation of a trading scheme such as the Cap and Share scheme must take account of pre-existing systems in place. Firstly, to establish if the proposed system is required and, secondly, to determine what sectors of the economy the new scheme should target. In this context, the following Sections 2. – 2.4 discuss the scope of the European Union Emissions Trading Scheme in Ireland, in terms of the sectors covered by it and the importance of those sectors compared with the total Ireland’s overall greenhouse gas emissions. Finally, Section 2.5 discusses other extant policies and regulations with which a new scheme must also interact.
.1 EU ETS scope
The European Union Emission Trading scheme (EU ETS) has been designed in three phases. It commenced on January 2005 with Phase I of the scheme that ran from 2005 to 2007. Phase II began on January 2008 and will run until 202. The EU ETS covers power generation, cement, glass, ceramics, and pulp and paper, which are termed “trading sectors”. Additionally, the scheme covers emissions from large combustion installations, (larger than 20 MWthermal), commonly found in the
food processing and pharmaceutical industries for example. Operators of installations that are covered by the scheme are obliged to monitor and report emissions of greenhouse gases (GHGs) from that installation and to surrender allowances for the volume of those emissions.
To date allocations of allowances to those sectors and installations covered by the scheme have principally been made on the basis of past emissions, discounted to meet Kyoto targets. Prior to the commencement of each Phase of the scheme, Member States have been required to submit a National Allocation Plan (NAP), detailing the allocation of allowances over that period, for approval by the European Commission. In Section 2.2, the allocation of allowances in the Republic of Ireland and Northern Ireland will be discussed in the
context of establishing the sectoral coverage of the Community trading scheme.
Directive 2003/87/EC, which established the EU ETS also set out the requirement for a review of the scheme. In 2006, the Commission published a Communication that established a review process and committed to produce a legislative proposal in 2007. The Commission’s review of the EU ETS reported in January 2008 with implications for the future scope of Phase III and relevant proposals from that review are considered in Section 2.3.
. EU ETS in Ireland
The allocation of allowances to installations in the Republic of Ireland is covered by Ireland’s National Allocation Plan (NAP), which is administered by Ireland’s Environmental Protection Agency (EPA). For those installations in Northern Ireland that qualify for the EU ETS, allowances are allocated according to the UK NAP, administered by the Department for Environment, Food and Rural Affairs.
..1 Republic of Ireland
Ireland’s NAP for 2008 to 202 (Phase II of the EU
ETS) was notified to the EU Commission in July 2006. The intended total quantity of allowances for this period was given as 22.638 Mt CO2 equivalent
per year. The Commission gave their approval to the plan as submitted, subject to 5 amendments, including a reduction to the overall quantity of allowances allocated2. Following a request from
Ireland for further clarification of their decision, the EU Commission issued a revised decision in July 2007, in which the reduction to the overall quantity of allowances allocated was lessened. The total quantity of allowances to be allocated by Ireland is now 22.262 Mt CO2 eq. per annum, which amounts
Environmental Protection Agency, Ireland’s National Allocation Plan 2008 – 2012, 2 July 2006. See: http://www.epa. ie/downloads/pubs/air/etu/epa_ireland_nap_2008-202.pdf 2 Commission Decision of 29 November 2006 concerning the
A Study in Personal Carbon Allocation: Cap and Share
to 3% of the projected national GHG emissions over that period, taking into account existing GHG reduction measures.
The Commission’s decision, in response to the first submission of Ireland’s Phase II NAP, to reduce the total allocation of allowances was due to Commission’s opinion that Ireland’s forecasted growth of transport sector emissions was overly conservative. Therefore, the proposed allocation of allowances to sectors within the Community trading scheme, based in part on that forecast, did not comply with Ireland’s reduction commitment under the Kyoto Protocol.
There are 2 installations within the Republic of Ireland that qualify for the EU ETS. Table 2. shows the distribution of the allowances to these installations grouped into three sectors; power generation, cement and general (covering all other types of installations). The power generation sector is clearly the largest sector followed by cement and then all the remaining summed together. The largest sectors within the ‘general’ classification are aluminium and food processing, but it also includes breweries, brick manufacturers, pharmaceutical companies, universities, and hospitals. In addition, there are two oil companies whose operations in Ireland are covered by the EU ETS; Marathon Oil, which is the operator of the Kinsale Head Gas Field, and, Conoco Phillips, operators of the Whitegate refinery in County Cork.
Table 2.1: Ireland’s proposed average annual sector allocations for 2008 – 2012
Sector Incumbent
Allocation
Proportion (%)
Power generation 3,080,36 64.6 Cement 3,867,237 9. General 3,295,484 6.3
Total 20,098,766
-3 Environmental Protection Agency, Ireland’s National Allocation Plan 2008 – 2012: As notified to the Commission prior to Final allocation Decision, October 2007. See: http://www.epa. ie/downloads/pubs/air/etu/nap2%20january%202008.pdf
Under a “De-minimis Threshold Rule” within Ireland’s NAP, installations that only satisfy the 20MWthermal EU ETS inclusion criteria as a result of
aggregating very small emission sources (under 3MWthermal) have been excluded from the provisional
NAP. However, the operators of these installations can request to remain within the scheme.
New entrants to the scheme will be allocated allowances from a New Entrant Set-Aside and no allocation will be proportionately greater than that which the existing installations in the same sector were allocated, nor will an allocation be greater than 87% of projected emissions. A set-aside will also exist for new high efficiency CHP, the allowances for this set-aside will be taken from the Power generation sector allocation.
The Irish Government intends to purchase a maximum of 8.035 million allowances through the Kyoto Protocol flexible mechanisms, emissions reduction units (ERUs) or certified emissions reduction units (CERs), for which the National Development Plane 2007-203 provides the sum of
€270 million. Across the different sectors, the use
of ERUs and CERs is limited to % of the allocation to each installation for Power generation and the Cement sector, and 5% of the allocation to each installation in the General sector.
.. Northern Ireland
The UK’s Phase II NAP was approved by the Commission on 29 November 20064. Twenty three
installations from Northern Ireland are included in that plan amounting to a total emission of 5.7 million tonnes of CO2. Power Generation represents
almost 80% of those emissions and Cement manufacturing 4% (Table 2.2).
As is the case in the Republic of Ireland, a voluntary
de minimis threshold has been included in the UK’s Phase II NAP; combustion units less than 3MW would be excluded from the calculation of aggregated installed capacity, units equal to or greater than that value would be included. If, using this threshold, the aggregated units exceed 20MW, all units would be included.
A New Entrant Reserve of allowances is in place for installations that start or extend operations between 2008 and 202. Emissions projections for each sector within the UK’s Phase II NAP take account of growth, including provision for new entrants, as the output growth assumptions reflect the demand for a particular product irrespective of whether it is produced by a new entrant or an existing installation. Contributions to the NER in each sector are deducted from the total allocation to that sector before distributing the remainder to existing installations.
The UK government forecasts that it is on course to emit less than its Kyoto Protocol target. It is therefore not intended that any use will be made of flexible mechanisms by the Government. The use of Kyoto project credits, CERs or ERUs, by installations is limited to 8% of the free allocation to each. This percentage limit amounts to approximately two thirds of the ‘effort’ required by UK installations in Phase II, where effort is calculated as the difference between projected business as usual emissions and the total allocation of allowances5.
[image:20.595.306.524.184.440.2]5 Defra, EU Emissions Trading Scheme Approved Phase II National Allocation Plan 2008 – 2012, 2007. See: http://www. defra.gov.uk/environment/climatechange/trading/eu/phase2/ pdf/nap-phase2.pdf
Table 2.2: Annual allocations to installations in NI grouped by sector6
Sector Number of
Installations (tCOAllocation 2/year)
Cement 2 792490 Chemicals 6209 Glass 06592 Other Electricity
Producers 2079 Others B 6074 Ceramics 24333 Services 3 4998 Others C 2 37677 Pulp & Paper 48 Large Electricity
Producers 3 440506 Food and Drink 7 9360
Total 2 5701479
. The EU ETS review
On 23rd January 2008 the European Commission proposed a Directive amending Directive 2003/87/EC7.
Although a comprehensive review of the EU ETS is beyond the scope of this report, some of the relevant proposals from the Directive are presented below.
i. The scope of the scheme will be expanded to cover:
a. CO2 emissions from petrochemicals, ammonia
and aluminium sectors;
b. N2O emissions from production of nitric,
adipic and glyoxalic acid;
c. PFC emissions from the aluminium sector.
ii. Installations with a combustion capacity above 20MWthermal can be excluded if they have a
capacity less than 25 MW and annual emissions less than 0,000 tCO2.
6 Ibid.
A Study in Personal Carbon Allocation: Cap and Share
iii. GHG emissions from road transport and shipping are not to be included and a comprehensive cost-benefit analysis is deemed necessary, in order to allow the Commission to decide on whether emissions trading is the most appropriate means to deal with these issues.
iv. The definition of combustion installation will be codified and will cover all stationary combustion apparatuses resulting in the release of greenhouse gases.
v. An EU-wide cap should be determined in the Directive and there should be an 8-year trading period to 2020 and a linear reduction in the cap to that point. The Directive should provide for automatic and predictable adjustments to the cap upon conclusion of an international agreement.
vi. The EU ETS should be able to link to other mandatory emissions trading systems capping absolute emissions.
vii. Auctioning should be the basic principle for allocation and should be applied to different sectors over different timescales. Of the allowances to be auctioned, 90% will be distributed to member states in proportion to 2005 emissions and the remaining 0% will be distributed according to per-capita income. A percentage of the revenue from auctioning allowances should be used to reduce greenhouse gas emissions, to adapt to climate change, for measure to avoid deforestation and for addressing social impacts such as increases in electricity prices in lower and middle income homes.
The inclusion of CO2 emissions from the
petrochemical, ammonia and aluminium sectors reinforces industrial sector coverage under the EU ETS. Within Ireland, the aluminium sector is mainly engaged in refining bauxite to alumina, which does not cause PFC emissions, therefore this expansion of scope will not affect Ireland significantly8. Defining
8 US EPA data on PFC emissions from primary aluminium production. http://www.epa.gov/methane/excel/AppendixD9_ PFC_Primary_Aluminum_Tech_Adoption.xls
de minimis criteria will make it easier for small installations to opt out of the EU ETS but the criteria already in place in Ireland’s and the UK’s Phase II NAP mean that small installations within Ireland and Northern Ireland already had the option to be excluded from the EU ETS. Setting an EU wide cap within the directive and defining a linear decline of that value to 2020 sends a clear, long-term signal about the pressures that will be experienced by those sectors included within the EU ETS.
Establishing auctioning as the principle for allocation sets a precedent for allocation methodologies in trading schemes. Of equal importance is the proposal to recycle auction revenues to aid greenhouse gas abatement efforts but also to address potential social imbalances in the impacts of the EU ETS.
The decision not to include surface transport emissions in the EU ETS is important for the scope of a personal trading scheme because transport shows the most significant growth of any sector in Ireland, as is discussed in the following section.
Summary
•
The EU ETS is now operating Phase II of the scheme, which will continue to 202. The allocation of allowances to installations in Ireland and Northern Ireland covered by the EU ETS is detailed in the National Allocation Plans (NAPs) for Ireland and the UK (for Northern Ireland).•
In both Ireland and Northern Ireland, the power generation and cement manufacturing sectors account for 80% and 90% of the allocation of allowances, respectively.•
The review of EU ETS has presented recommendations for Phase III of the scheme. Some important proposals and their implications are:•
Expansion of scope to include more industrial emissions. The impacts of this extension may be small for Ireland and Northern Ireland emissions;•
Establishing an EU wide cap andpredictable, long-term reductions to 2020. The clear signal of a predictable cap will allow long-term abatement strategies to be implemented.
•
Surface transport is not to be included in the scheme. The review has recommended a detailed cost-benefit analysis to decide if the EU ETS is the most appropriate mechanism to deal with these emissions, leaving the scope open for another mechanism to cover this important sectoral emission source.•
Auctioning is to be established as the principle for allocation with auction revenues recycled to aid GHG abatement and to address equity concerns resulting from the introduction of the scheme. This proposal sets a precedent for addressing equity imbalances created by the scheme, for example increases in electricity prices in lower and middle income households.. Sectors outside the EU ETS
It can be seen from tables 2. and 2.2 that the EU ETS does not cover all sectors of the Irish economy equally. Those sectors not covered by the Community scheme are considered below.
..1 Republic of Ireland
In order to decide on the relative proportion of allowances allocated to each trading sector within Ireland’s Phase II NAP, modelling was carried out
to determine the share of national greenhouse gas emissions over the period 2008 to 2029. Ireland’s
GHG emissions reported in 2003 are compared against the forecast ‘base-case’ emissions from ICF and BOC (2006)0 in table 2.3. The ‘base case’
scenario takes into account the GHG emission reductions likely to be achieved by policies and measures already announced that directly and indirectly impact Ireland’s GHG emissions profile.
The energy sector, which accounts for the greatest proportion of the sectoral allocation of allowances in Ireland’s Phase II NAP, is forecast to be the most significant GHG emitting sector over the period 2008 – 202 and was comprised 24% of reported emissions in 2003. The largest magnitude increases in emissions are forecast to occur in the Industry/Commercial/ Services and the Energy sectors. However, the EU ETS covers many of the largest emitters in these two sectors and Ireland’s allocation of allowances (table 2.) represents 6% of the combined total of emissions from the Energy sector and the Industry/ Commercial/Services sector. Excluding these two sectors, the next largest change is predicted to occur in the Transport sector from which annual emissions are expected to be over ,000 Mt CO2-eq greater in
the period 2008 – 202 in comparison with 2003.
Forecast emissions from the Agricultural sector, which represented the largest source in 2003, are over 2.4 Mt CO2-eq lower in the 2008 – 202 period,
as a result of the full decoupling of subsidies from production. Within the agricultural sector, CH4 and
N2O are the key greenhouse gases in Ireland. Of
particular importance are enteric fermentation (CH4, with cattle being the largest source), manure
management (mostly CH4, with cattle again being
the largest source) and agricultural soils (N2O, where
direct emissions make the largest contribution)2.
9 ICF Consulting and Byrne O Cleirigh, Determining the Share of National Greenhouse Gas Emissions for Emissions Trading in Ireland 2008 – 2012, submitted to Department of Environment, Heritage, and Local Government, Heritage and Local
Government, Ireland, March 2006. 0 Ibid.
Ireland National Inventory Report 2006, EPA (Michael McGettigan, Paul Duffy, Niamh Connolly and Phillip O’Brien), http://coe.epa.ie/ghg/nirs/NIR_2006_IE.pdf
A Study in Personal Carbon Allocation: Cap and Share
It is not clear whether these emissions could be included in the scheme with the same standard of monitoring as CO2 emissions from combustion in
the transport sector, particularly since a top-down approach to emissions determination for the latter could not be applied to the former. In any case, the inclusion of agriculture would add a degree of complexity to the scheme, and given the projected fall in emissions in contrast to the rises expected from transport, it is by no means compelling that the inclusion of agriculture would be cost effective.
Table 2.: Breakdown of Ireland’s GHG emissions by sector1
Sector 200 2008 – 2012
Emissions (Mt CO
2
-eq)
Pr
oportion
of total Emissions (Mt CO
2
-eq)
Pr
oportion
of total Emission change (Mt CO
2
-eq)
Energy 6.30 24% 8.75 26% 2.45 Residential 6.6 0% 6.83 9% 0.22 Industry/
Commercial/
Services .27 7% 4.20 20% 2.93 Agriculture 20.08 29% 7.64 24% -2.43 Transport .85 7% 3.03 8% .8 Waste 2.08 3% .83 3% -0.25
Total 68.19 - 72.28 - 4.09
Based on this analysis, the transport sector
represents the fastest growing sector not covered by the EU ETS. Further evidence comes from the growth rate of the total primary energy requirement in the transport sector, which was 69% over the period 990 – 2006 (6.3% per annum), greater than any other sector of the Irish economy4. Provisional GHG
emissions reported for 2006 show transport sector emissions 65% higher than 990 values5.
3 ICF Consulting and BOC (2006).
4 Howley, M., O’Leary, F., and O’Gallachoir, B., Sustainable Energy Ireland, Energy Policy Statistical Support Unit, Energy in Ireland 990 – 2006, December 2007.
5 Environmental Protection Agency, Ireland’s Greenhouse Gas Emissions in 2006 (provisional), 2008. See: http://www.epa. ie/downloads/pubs/air/airemissions/ghg_provisional_2006.pdf
.. Northern Ireland
Recently reported greenhouse gas emissions for 2005 are lower, in total, than values for 990 by more than Mt CO2-eq6. Considering the sectoral
breakdown of emissions, it can be seen that as is the case in the Republic of Ireland, emissions from Agriculture and Power generation represent the largest proportion of the total emissions (table 2.4). Most notably however, emissions of GHGs in 2005 are reduced in all sectors except transport, compared with 990 levels. The transport sector showed an increase of around .6 Mt CO2-eq (44%).
Table 2.4: Breakdown of GHG emissions in Northern Ireland by sector17
Sector 1990 2005
Emissions
(Mt CO
2
-eq)
Pr
oportion of total Emissions
(Mt CO
2
-eq)
Pr
oportion of total Emission change
(Mt CO
2
-eq)
Energy Supply 5.49 25% 5.29 26% -0.2 Residential 3.52 6% 2.86 4% -0.65 Public 0.42 2% 0.3 % -0.29 Industrial
Process 0.72 3% 0.35 2% -0.37 Business 2.07 9% .63 8% -0.44 Agriculture 5.34 24% 5.04 24% -0.30 Transport 3.69 7% 5.32 26% .64 Waste
Management 0.67 3% 0.36 2% -0.3 Land Use
Change -0.05 0% -0.3 -% -0.26
Grand Total 21.88 - 20.68 - -1.20
Based on this analysis, it can be seen that in 2005, transport emissions, which are beyond the scope of the EU ETS, account for the same proportion of GHG emissions as the power generation sector. Further, transport is the only sector in Northern Ireland from which emissions rose over the period 990 to 2005.
. Other climate change
regulation
The previous discussion has focussed on the EU ETS, which covers installations in the Republic of Ireland and Northern Ireland. It is important to note that in the Republic of Ireland the EU ETS is the only extant trading scheme. However, in Northern Ireland legislation is also in place for the Climate Change Levy and is proposed for the Carbon Reduction Commitment. Any further trading scheme, such as the Cap and Share scheme, would have to interact with such pre-existing policies.
Since April 200, a climate change levy (CCL) has been applied to energy use in industry, commerce and the public sector. The levy applies specifically to gas, liquefied petroleum gas (LPG), electricity and other fossil fuels. However, it does not apply to fuels used by the domestic or transport sector, fuels used for the production of other forms of energy or fuels used for non-energy purposes. No levy is applied to oils and energy used by small firms, using domestic amounts of energy, are exempt. Special consideration is given to energy intensive sectors (the major energy intensive sectors are: aluminium, cement, ceramics, chemicals, food & drink, foundries, glass, non-ferrous metals, paper and steel) whereby agreements are negotiated with relevant sector trade associations on behalf of companies within the sectors concerned. Facilities identified within these agreements are eligible for an 80% discount on the Levy subject to progress against targets established by the Climate Change Agreements (CCAs).
Defra is in the process of developing the Carbon Reduction Commitment; a mandatory auction based cap and trade scheme in which participants will be required to purchase sufficient allowances either from the auction, the secondary market or through the safety valve to cover their annual energy use CO2 emissions. Organisations will be
covered by the CRC only if they have an electricity consumption from mandatory half hourly meters in excess of 6,000 MWh/year. Any half hourly metered electricity use will count towards the 6,000 MWh/
year inclusion threshold irrespective of whether this electricity use is covered by CCAs. The CRC aims to target both direct CO2 energy use emissions and
indirect CO2 emissions from electricity. However,
direct emissions included in the EU ETS and CCAs will not be covered by CRC and organisations with more than 25% of their emissions in CCAs will be completely exempt from CRC. The scheme is due to commence in January 200 preceded by a three-year introductory phase during which simple fixed-price sale of allowances will occur. Following this phase allowances will be auctioned.
Summary
•
Within Ireland, the EU ETS is the only significant trading scheme, with which other policies aiming to reduce GHG emissions would need to interface.•
In Northern Ireland, the situation in more complex, with the EU ETS, Climate Change Levy (hence also Climate Change Agreements) and the Carbon Reduction Commitment in place. A ‘whole-Ireland’ policy would need to take these existing measures into account in its design.•
Outside of the sectors already covered by the EU ETS, emissions from the transport sector represent the largest growing source of GHGs.•
Emissions from the transport sector are the fastest growing in both Ireland’s and Northern Ireland’s economies rising by 60% over the period 990 – 2005 in Ireland and by 44% in Northern Ireland over the same period.•
These factors suggest that transport should be the main focus of a new Cap and Share, or similar, policy.A Study in Personal Carbon Allocation: Cap and Share
However, the CRC in the UK sets a precedent for including electricity within a complementary scheme aimed at energy consumption.
•
Emissions from the agriculture sector are significant in both the Republic of Ireland and Northern Ireland, although whether the Cap and Share proposal is suited to addressing these requires further consideration, since emissions are falling and generally arise from non-CO2 sources that would require a differentmonitoring approach to CO2 emissions from
the transport sector.
. Lessons from the EU ETS
The EU ETS has been operating for over three years and recently its operation has been
comprehensively reviewed. Here we consider what lessons can be taken from the functioning of the EU ETS, in the context of implementing a personal carbon allocation scheme.
..1 Trial phase
Phase I of the EU ETS is regarded as a trial phase of the scheme, during which difficulties of the schemes operation and the impacts of the scheme on the economy were identified. The recent review of the EU ETS took these issues into account before recommending new regulations for the design of the scheme in Phase III.
The Carbon Reduction Commitment is also intending to commence with a trial phase during which it is hoped that problems will be identified and resolved to produce a more effective and efficient scheme.
Designing a trial period into the implementation of a new emissions trading scheme is seen as an important element of the scheme’s development and this should be taken into account when implementing a novel personal carbon allocation scheme.
.. Cap setting
In Phase I of the EU ETS, the total cap established was greater than that required under a business-as-usual scenario. Since there was a lack of scarcity, the allowance price fell close to zero and the scheme ultimately offered no incentive for abatement. The cause of this scenario can be attributed to the way the cap was determined:
•
National emission caps were generally determined independently by each Member State in accordance with business-as-usual emissions projections and without any reference to an overall EU cap. This Member State driven approach combined with inconsistencies in approaches to deal with key parameters or uncertainties for the projections contributed to the adoption of high baseline scenarios;•
Many Member States did not have good quality emissions baselines on which to base their allocations. Accordingly, national allocations tended to err on the side of caution rather than risk disadvantaging national industries in international markets;•
Lack of planning and familiarity with the scheme resulted in some Member States not having their NAPs approved before the start of the scheme... Investment opportunities
A criticism of the EU ETS has been that there has been insufficient certainty regarding the overall cap to make long-term investment decisions. Many sectors within the scheme have asset lives well in excess of 20 years and payback periods far longer than current EU ETS phase lengths. This was recognised in the proposal of COM(2008)6 to establish an early EU wide cap and forecast its rate of decline over the trading period 202 to 2020. The length of the cap is clearly an important consideration when designing a trading scheme.
.. Emissions reporting
The release of market sensitive information by Member States and the Commission can have a significant impact for participants in the scheme. For example, the release in 2005 of verified emissions data showed that emissions were generally lower than expected and as a consequence less abatement would be required. The market response was a fall in the carbon price, which is to be expected in a properly functioning market. However, the method of release meant that the information was not available to all interested parties at the same time. Consequently, some were more vulnerable to losses on the market than others, leading to criticism of the way the data was released. The Commission set up a revised process for emissions reporting in 2006 and the same problem did not occur. Taking such guidelines into account would be advisable for all new emissions trading schemes in which reporting of emissions takes place.
Summary
Drawing lessons from the EU ETS we can conclude:
•
There are benefits from operating a trial phase, or at least allowing flexibility on some design aspects during initial phases.•
The use of good quality baseline data is essential in determining a realistic cap and supporting a stable carbon market during early phases of a new scheme.•
There are benefits from setting a stable long term cap profile, since this provides greater certainty for the necessary investment in low carbon options to support reductions in all sectors.A Study in Personal Carbon Allocation: Cap and Share
Policy approach –
personal carbon
allocation options
Policymakers have a choice of policy instruments capable of achieving a reduction in carbon emissions. In Sections 3 and 4, we review the full range of available policy options that focus on changing individual behaviour and undertake a comparative assessment of the strengths, weaknesses, opportunities and threats of each scheme. Section 4 covers non-trading approaches to emission reduction and the present section covers the following personal carbon allocation schemes8.
•
Cap and Share•
Domestic Tradable Quotas/Tradable Energy Quotas•
Personal Carbon Rationing•
Rate All Products and Services•
Ayres Scheme•
Sky Trust(now commonly referred to as Cap and Dividend)
All the measures are assessed on the basis of the following criteria:
•
Economic Efficiency•
Environmental outcome•
Equity•
Simplicity•
Political and public acceptability•
Consistency with other mechanisms/regulationA brief definition of each is set out below.
8 The term “personal carbon allocation schemes” is used here rather than simply “personal carbon trading” to encompass those schemes (like Cap and Share) that do not require individuals to buy and sell allowances or surrender them in relation to the emissions associated with their purchases of energy or other goods and services.
Economic efficiency
The economic efficiency concerns the extent to which a given environmental outcome can be delivered at the least cost. The cost of achieving an outcome will be affected by where within the economy the reductions occur, be it reductions sought from all those covered by the mechanism or just those where the abatement costs are cheapest. Other concerns will include whether the mechanism rewards all abatement actions (for example
whether measures in the transport sector encourage more efficient vehicle development, biofuels and less travel, or just one or two of these). Departures from ideal conditions could also be detrimental, for example the extent to which free allocation in a trading scheme could lead to a compliance culture where reduction opportunities are ignored. The costs of administering and participating in a scheme must also be taken into account.
An additional element is that of public engagement. All the schemes covered in this Chapter are
mandatory. For that reason, the carbon emissions reductions they are designed to achieve should be guaranteed and not depend on public engagement. However, high levels of public engagement will ease the transition to a low carbon economy, as individuals will more likely be pro-active in seeking to reduce their own emissions, which may be cheaper than those to be made elsewhere in the economy. It will also decrease the administrative burden of ‘educating’ the public, a task which, to the extent it is not built into the scheme itself, would likely fall to Government at the expense of the taxpayers. On the whole, schemes which promote public engagement are preferable to those that do not, provided the associated costs are reasonable.
Environmental outcome
corresponding increase in those that are not) and whether the economic incentive is closely related to the environmental impact (the difference between a carbon tax and an energy tax for example).
Note that the criterion concerns the environmental outcome and does not cover environmental cost effectiveness (the quantity of emissions reductions achieved per unit of cost). This is considered as part of the overall economic efficiency of a measure.
Equity
The schemes and policies assessed in the present report are inherently equitable in that they apply the same approach to each individual (they do not, for example, target any particular sector to pay a disproportionate cost). However, since the introduction of a carbon policy will introduce new costs that certain sectors of society may not be able to afford, whilst others can, the review of each measure considers the extent to which, as a whole, the system compensates individuals for increased costs directly (as opposed to simply generating revenue for the exchequer). Lastly, Section 3.7 considers the generic issues relating to the distribution of costs and benefits.
Simplicity
In order for a measure to be effective simplicity must be a key concern. It must be easy for those participating to understand what is required of them and there should be minimal uncertainty over the benefit that will arise from carbon reducing activities.
Political/public acceptability
Measures that affect the general public directly and therefore demand a response from them will be particularly sensitive to how they are perceived. They will need to appear a just and effective way of meeting the environmental outcome, without creating perverse incentives or appearing to generate too much bureaucracy. In addition, public engagement promotes public acceptability, which in turn makes it more likely that a scheme will be politically acceptable in the long term.
Consistency with other mechanisms/
regulation
It is recognised that a coordinated approach to carbon policy is desirable and that carbon reductions need to be incentivised across the economy.
When coupled with regulation of activities for other purposes, both environmental and non-environmental, there is potential for a complex and inconsistent policy landscape. The degree to which a new measure can be integrated with others w