FORMULATION DESIGN AND EVALUATION OF CEPHALEXIN
CONTROLLED RELEASE MATRIX TABLETS
B. Basanta Kumar Reddy*1, Dr. K.E.V. Nagoji2 and Dr. Satyanarayan Sahoo3
*1Srinivasarao College of Pharmacy, P.M. Palem, Visakhapatnam-530041, Andhra Pradesh,
India.
2
Sri Venkateswara College of Pharmacy, Etcherla, Srikakulam-532410, Andhra Pradesh,
India.
3
P.G. Department of Chemistry, Berhampur University, Bhanja Bihar, Berhampur-760007,
Odisha, India.
ABSTRACT
The aim of the present work was to design controlled release matrix
tablets of Cephalexin by incorporating the drug in a matrix made up of
using combination of low concentration of hydrophobic polymer and
hydrophobic polymers, to study their release pattern and release
mechanism of the drug from matrix tablets upto 12 hours.
Hydrophobic polymer is the rate retardant material, but different
combinations with hydrophilic polymer increase the release rate to
establish intended drug release up to 12 hours. Matrix tablets were
formulated with the combination of hydrophobic to hydrophilic
polymers in the ratios of 1:1, 1:2, 1:3 and 1:4. F1 to F4 formulation
were prepared with ethylcellulose (EC) and hydroxypropyl methyl cellulose (HPMC K4M),
F5 to F8 were prepared with EC and HPMC K15M and F9 to F12 were prepared with EC and
HPMC K100M. Designed matrix tablets were evaluated for various pre-compression and
post-compression parameters. F4 is the optimized formulation, showed 100.34% release at
the end of 12 hours as it showed good release rate profile compared to all formulations. Drug
released pattern followed zero order with non-Fickian diffusion method.
KEYWORDS: Matrix former, Controlled release tablet, Release Kinetics, HPMC, Ethyl cellulose.
Volume 5, Issue 8, 1193-1204. Research Article ISSN 2277– 7105
*Corresponding Author
B. Basanta Kumar Reddy
Srinivasarao College of
Pharmacy, P.M. Palem,
Visakhapatnam-530041,
Andhra Pradesh, India. Article Received on 11 June 2016,
Revised on 01 July 2016, Accepted on 21 July 2016
INTRODUCTION
In developing countries, infectious diseases are very often. The infectious diseases are
precipitated by both gram positive and gram negative bacteria hence, the treatment is
necessary with broad spectrum of activity. All cephalosporin posses a wide range of
bactericidal activity. Cephalexin is an orally active first generation cephalosporin, which has
high activity against gram-positive bacteria, these act by inhibiting bacterial cell wall
synthesis.[1][2] Controlled release dosage forms have number of advantages over conventional
dosage forms, such as improved patience compliance due to decrease in dosing frequencies,
reduction in fluctuation in steady-state levels and therefore better control of disease,
maximum utilization of drug enabling reduction in total amount of dose administered.[3][4] In
the present work, an attempt has been made to design, formulate and evaluate in-vitro release
of cephalexin matrix tablets. As the effect of controlled release dosage form is relatively
more, incorporating the drug in the matrix tablet will prolong the drug release. These are
prepared by wet granulation method. The matrix tablets of cephalexin designed using
polymers such as ethylcellulose with hydroxypropyl methylcellulose (HPMC) K4M, HPMC
K15M, HPMC 100M in different proportions and evaluated for various precompression and
post compression parameters.[5][6] The effect of combination of polymers EC, HPMC K4M,
K15M, K100M, on response parameters such as drug release pattern, cumulative percent
release of the drug and drug release mechanism were studied.
MATERIALS AND METHODS
Cephalexin was a gift sample from Ranbaxy Pharma Ltd., Gurgaon, India., HPMC K4,
HPMC K15, HPMC K100, Ethyl cellulose, Dibasic calcium phosphate (DCP), Magnesium
stearate, Talc and all other ingredients used are of analytical grade.
Formulation of tablets
Required quantities of drug and all excipients were passed through the Sieve 44# and then
accurately weighed and blended properly (except lubricant and glidant) as per the formula
given in the Table 1. The wet damp mass was formed by slowly adding granulating liquid as
distilled water q.s (quantity sufficient). The cohesive material was sieved through 12# to form
wet granules. The wet granules were dried at 50ºC for 2 hr in a hot air oven (Universal Hot
Air Oven) and then passed through 22# mesh to get granules of uniform size; and then talc
punch-tableting machine (Shakti) with hardness of the tablets maintained between 5-6
kg/cm2.[7[[8][9][10]
Table-1: Formulation of cephalexin Controlled Release Matrix Tablet.
Ingredients F1 F2 F3 F4 F5 F6 F7 F8 F9 F10 F11 F12
Cephalexin 100 100 100 100 100 100 100 100 100 100 100 100
Ethyl cellulose 5 5 5 5 5 5 5 5 5 5 5 5
HPMC K4M 5 10 15 20 -- -- -- -- -- -- -- --
HPMC K15M -- -- -- -- 5 10 15 20 -- -- -- --
HPMC K100M -- --- -- -- -- -- -- -- 5 10 15 20
DCP 180 175 170 165 180 175 170 165 180 175 170 165
Talc 5 5 5 5 5 5 5 5 5 5 5 5
Magnesium
stearate 5 5 5 5 5 5 5 5 5 5 5 5
Distilled water
(in ml) q.s q.s q.s q.s q.s q.s q.s q.s q.s q.s q.s q.s
Total weight of
tablet (in mg) 300 300 300 300 300 300 300 300 300 300 300 300
RESULTS AND DISCUSSION
Calibration curve by UV spectral analysis
A series of standard solutions of cephalexin (2-10µg/ml) in 0.1N HCl were prepared and their
[image:3.595.153.453.468.658.2]absorbance were measured at 262 nm against 0.1N HCl as reagent blank (Figure 1).
Figure 1 : Calibration curve of cephalexin.
Drug Excipient compatibility studies
The compatibility of drug and formulation components is important prerequisite before
polymers and excipients under experimental conditions and affect the shelf life of product or
any other unwanted effects on the formulation.
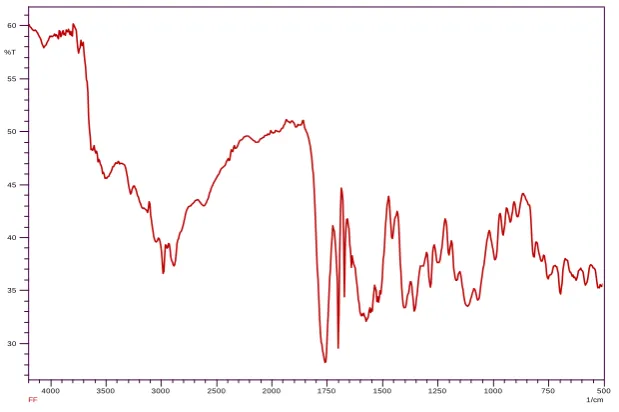
Fourier Transform Infrared (FTIR) spectroscopy
Pure drug, individual polymers and optimized formulation were subjected to FTIR study.
About 1-2mg of sample was mixed with dried potassium bromide of equal weight and
compressed to form a KBr pellet. The samples were scanned from 500 to 4000cm-1 (Figure
[image:4.595.133.462.248.483.2]2-5). 500 750 1000 1250 1500 1750 2000 2500 3000 3500 4000 1/cm 45 52.5 60 67.5 75 82.5 %T 3 4 4 5 .9 4 2 9 7 3 .3 7 2 3 5 9 .9 8 1 7 3 5 .0 3 1 6 9 8 .3 8 1 4 5 7 .2 7 1 3 7 4 .3 3 1 2 5 4 .7 4 1 1 6 8 .9 0 1 0 5 3 .1 7 9 9 5 .3 0 8 9 4 .0 4 6 6 9 .3 2 B5
Figure 2: FTIR Spectrum of pure cephalexin.
500 750 1000 1250 1500 1750 2000 2500 3000 3500 4000 1/cm 20 25 30 35 40 45 50 55 %T BB
500 750 1000 1250 1500 1750 2000 2500 3000 3500 4000
1/cm 30
35 40 45 50 55 60
%T
[image:5.595.146.456.73.279.2]FF
Figure 4: FTIR Spectrum of pure cephalexin, EC and HPMC K15M.
500 750 1000 1250 1500 1750 2000 2500 3000 3500 4000
1/cm 30
40 50 60 70 80 90 100
%T
EE
Figure 5: FTIR Spectrum of pure cephalexin, EC and HPMC K100M.
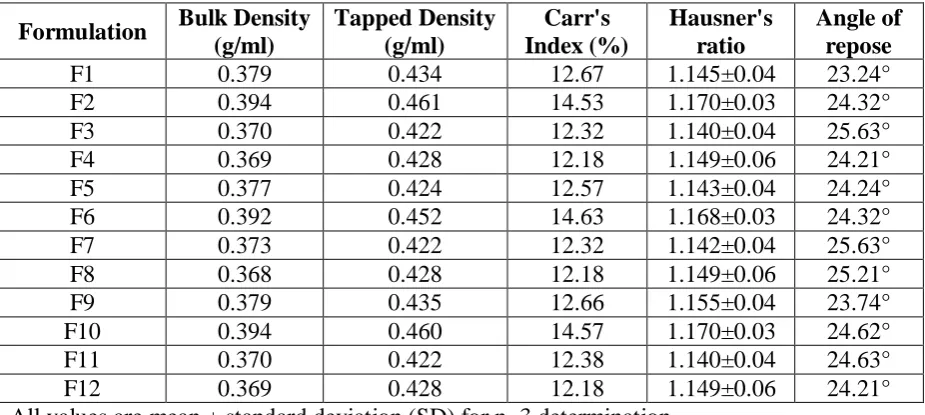
Evaluation of tablet blend Bulk Density
Apparent bulk density is determined by placing pre-sieved drug excipients blend in to a
graduated cylinder and measuring the volume and weight as it is.[11]
Tapped Density
Tapped density is determined by USP method II Tablet blend was filled in 100 ml graduated
cylinder of tap density tester which operates for fixed number of taps until the powder bed
[image:5.595.145.452.320.516.2]where, M =Weight of powder taken; Vt =tapped volume.
Angle of Repose
Angle of repose 'θ' is determined by using funnel method. Tablet blend is poured from funnel
that can be raised vertically until a maximum cone height 'h' is obtained. Diameter heap D,
was measured. The angle of repose is calculated by formula;
Compressibility Index and Hausner Ratio
This is measured for the property of a powder to be compressed; as such they are measured
for relative importance of interparticulate interactions. Compressibility index is calculated by
following equation;
where, ρt =tapped density; ρb =bulk density;
Hausner ratio is calculated by following equation[13];
Hausner Ratio = ρt / ρb
[image:6.595.67.530.495.702.2]where, ρt =tapped density and ρb =bulk density
Table 2: Bulk density, tapped density, angle of repose, Carr's index, Hausner's ratio of the granules of cephalexin formulation.
Formulation Bulk Density (g/ml)
Tapped Density (g/ml)
Carr's Index (%)
Hausner's ratio
Angle of repose
F1 0.379 0.434 12.67 1.145±0.04 23.24°
F2 0.394 0.461 14.53 1.170±0.03 24.32°
F3 0.370 0.422 12.32 1.140±0.04 25.63°
F4 0.369 0.428 12.18 1.149±0.06 24.21°
F5 0.377 0.424 12.57 1.143±0.04 24.24°
F6 0.392 0.452 14.63 1.168±0.03 24.32°
F7 0.373 0.422 12.32 1.142±0.04 25.63°
F8 0.368 0.428 12.18 1.149±0.06 25.21°
F9 0.379 0.435 12.66 1.155±0.04 23.74°
F10 0.394 0.460 14.57 1.170±0.03 24.62°
F11 0.370 0.422 12.38 1.140±0.04 24.63°
F12 0.369 0.428 12.18 1.149±0.06 24.21°
Evaluation of tablet Weight Variation
Twenty tablets are randomly selected from each batch individually weighed; the average
weight and standard deviation of 20 tablets are calculated.[14]
Thickness
The thickness of the tablet is measured by using digital vernier callipers, twenty tablets from
each batch are randomly selected and thickness are measured.[15]
Hardness
Hardness is measured using Pfizer hardness tester, for each batch three tablets are tested.[16]
Friability
Twenty tablets are weighed and placed in the Roche Friabilator and apparatus is rotated at 25
rpm for 4 min. After revolution the tablets are dusted weight.[17]
Drug Content Uniformity
Twenty tablets of each type of formulation are weighed and crushed in mortar and
powder equivalent to 100 mg of cephalexin is weighed and dissolved in 100 ml of 0.1N
HCl. From the stock solution 1 ml sample is withdrawn and diluted to 10 ml with 0.1N HCl.
The absorbance is measured at wavelength 262 nm using double beam UV-Visible
spectrophotometer.
Table 3: Hardness, friability and drug content of matrix tablets of cephalexin formulations.
Formulation Hardness (Kg/cm2) Friability (%) Drug content (%)
F1 5.62±0.36 0.77±0.01 99.18±0.25
F2 5.02±0.01 0.72±0.01 99.15±0.16
F3 5.53±0.36 0.66±0.01 99.30±0.41
F4 5.55±0.35 0.42±0.01 98.48±0.41
F5 5.52±0.36 0.59±0.01 98.64±0.06
F6 5.78±0.33 0.60±0.01 98.56±0.56
F7 5.58±0.32 0.49±0.01 98.81±0.58
F8 5.54±0.36 0.55±0.01 99.11±0.44
F9 5.54±0.36 0.61±0.01 99.11±0.44
F10 5.76±0.36 0.45±0.01 98.48±0.41
F11 5.88±0.33 0.59±0.01 99.10±0.49
F12 5.55±0.32 0.60±0.01 98.58±0.52
In-Vitro Dissolution Study
The study is carried out using 0.1N HCl for first 2 hours and in phosphate buffer pH 6.8 upto
12 hours using the USP apparatus types II, the dissolution medium 900 ml maintained at
37ºC ±0.5ºC, The absorbance was measured at 262 nm, the dissolution study are carried out
[image:8.595.17.578.212.597.2]for 12 hrs.[18]
Table 4: Comparative dissolution profile for formulations F1 – F12. Time
(hrs) F1 F2 F3 F4 F5 F6 F7 F8 F9 F10 F11 F12
0 0 0 0 0 0 0 0 0 0 0 0 0
0.5 16.68 10.06 16.9 10.35 19.31 22.15 19.74 15.65 15.65 15.74 16.04 12
1 18.66 16.08 21.11 15.48 25.11 26.7 25.24 21.03 20.77 20.25 20.6 15.09
1.5 26.32 20.98 22.7 22.02 27.82 28.64 27.74 24.94 23.01 22.79 23.01 17.93
2 29.33 26.19 27.18 25.33 28.21 28.9 28.47 26.75 24.55 24.34 26.1 20
3 56.02 43.25 45.55 39.05 49.65 49.61 54.87 56.94 52.41 52.41 54.25 60.11
4 57.48 54.63 53.29 40.26 51.98 55.01 59.24 66.13 59.26 58.61 63.44 70.47
5 59.37 60.46 60.73 56.89 57.23 57.19 63.47 70.05 62.76 63.14 70.29 76.45
6 60.54 64.4 69.33 65.84 60 59.53 68.87 76.05 63.49 63.57 76.13 83.45
7 65.79 69.8 75.17 73.96 60.59 63.05 71.64 78.38 65.39 64.45 77.73 86.63
8 69.44 72.57 75.46 79.16 65.26 67.99 74.85 81.74 65.68 64.6 78.61 89.87
9 71.92 74.61 77.65 82.95 70.22 71.63 79.37 83.49 63.2 65.18 78.75 90.3
10 78.19 79.27 79.98 91.65 73.28 78.78 85.06 85.13 66.7 66.35 79.19 90.89
11 86.07 83.95 82.9 96.47 83.78 84.47 87.25 86.84 65.83 66.49 79.48 91.33
[image:8.595.138.462.477.673.2]12 89.72 89.2 89.75 100.34 89.91 90.6 91.63 89.32 70.06 67.37 80.21 91.62
Figure 7: Dissolution plot for optimized formulation F-4.
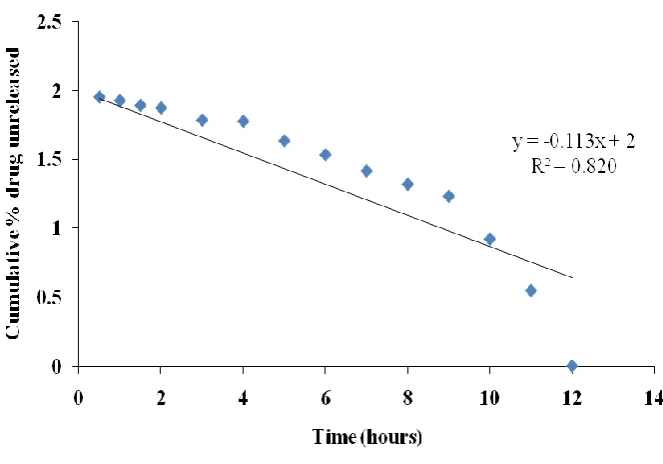
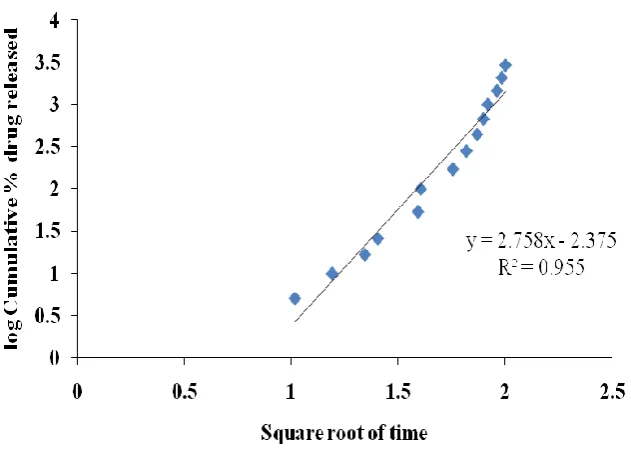
[image:9.595.132.464.349.581.2]Figure 9: Higuchi plot for optimized formulation F-4.
Table 5: Application of kinetics for dissolution profile of formulation F-4. Time
(hrs) %CDR Log %CDR
Log %drug unreleased
Square root
time Log time Slope 'n'
0.5 10.35 1.0149 1.9526 0.7071 -0.3010
0.7473
1 15.48 1.1898 1.9270 1.0000 0.0000
1.5 22.02 1.3428 1.8920 1.2247 0.1761
2 25.33 1.4036 1.8731 1.4142 0.3010
3 39.05 1.5916 1.7850 1.7321 0.4771
4 40.26 1.6049 1.7763 2.0000 0.6021
5 56.89 1.7550 1.6346 2.2361 0.6990
6 65.84 1.8185 1.5335 2.4495 0.7782
7 73.96 1.8690 1.4156 2.6458 0.8451
8 79.16 1.8985 1.3189 2.8284 0.9031
9 82.95 1.9188 1.2317 3.0000 0.9542
10 91.65 1.9621 0.9217 3.1623 1.0000
11 96.47 1.9844 0.5478 3.3166 1.0414
12 100.34 2.0015 -- 3.4641 1.0792
CDR: Cumulative drug release.
Inference
As per the above table the zero order regression value (0.9899) is more than first order
regression(-0.9545), it concluded the drug release follows zero order release mechanism. As
per Korsmeyer slope equation, slope value of F4 i.e., 0.7473 indicated drug release follows
[image:10.595.72.529.370.605.2]Stability studies
The accelerated stability study for the formulation at 40°C ± 2°C and 75% RH ± 5% RH was
conducted for the 3 months, which includes the testing of parameters like identification of
physical characters, identified by FTIR studies, dissolution profile and assay throughout
period.
The stability studies on optimized formulation of cephalexin matrix tablets were conducted
according to the ICH guidelines.
Table 6: Stability study of optimized formulation at 40°C ± 2°C and 75% RH ± 5% RH. Time (months) Physical change Percentage of drug in the
formulation
1 No 98.75
2 No 99.25
3 No 98.50
CONCLUSION
The market for drug delivery system has come a long way and will continue to grow at an
impressive rate. Today’s drug delivery technologies enable the incorporation of drug
molecules into a new delivery system, thus providing numerous therapeutic and commercial
advantages. Matrix tablet drug delivery systems provide several all the advantages including
greater flexibility and adaptability. It is evident from the results the that matrix tablets
prepared from HPMC along with ethyl cellulose a better system for twice-daily controlled
release matrix tablet of cephalexin. Formulation F-4 exhibited satisfactory drug release in the
initial hours and the total release pattern was very close to the 100% release profile. So, F-4
was the most successful, cost-effective and optimized formulation.
FINANCIAL SUPPORT AND SPONSORSHIP Nil.
REFERENCES
1. Tripathi KD. Essential of Medical Pharmacology. 7th ed. New Delhi: Jaypee Brothers
Medical Publishers, 2013.
2. Satoskar RS, Bhandarkar SD, Ainapure SS. Pharmacology and Pharmacotherapeutics.
16th ed. Mumbai: Popular Prakashan, 1999.
3. Chugh I, Seth N, Rana AC, Gupta S. Oral sustained release drug delivery systems: an
4. Gennaro AR, Remington: The Science and Practice of Pharmacy. 20th ed. Easton PA,
USA: Mac Publishing Company, 2001.
5. Chien YW. Novel Drug Delivery Systems. 2nd ed. New York: Marcel Dekker Inc; 1992.
6. Bhalla HL, Raj PC. Release controlling polymers. Indian Drugs, 1991; 28: 519-522.
7. Rezal MD, Qadir MA, Haider SS. Comparative evaluation of polymers as matrix for
controlled release drug delivery. J Pharm Pharmaceutical Sci, 2003; 6: 274-291.
8. Andreopopulas AG, Tarantilli PA. Xanthan gum as a carrier for controlled release of
drug. J. Biomater. App., 2001; 16: 35-38.
9. Parikh DM. Handbook of Pharmaceutical Granulation Technology. 2nd ed. Synthon
Pharmaceuticals Inc. North Carolina, USA, 2005; 191-192.
10.Reddy BBK, Nagoji KEV, Patnaik C. Studies on controlled release formulations of a
macrolide antibiotic drug: Influence of HPMC of different grades as matrix former.
World J Pharm Sci., 2015; 3: 2058-2068.
11.Basak SC, Shrinivasa R, Manavalan R, Rao P. Controlled release HPMC matrix tablet of
propranolol HCl. Indian J Pharm Sci., 2004; 66(6): 827-833.
12.Shabaraya AR, Narayanacharyulu R. Design and evaluation of chitason matrix of
metoprolol tartrate for sustained release. J Pharm Pharmaceutical Sci., 2008; 8(1):
231-236.
13.Shirwaikar AA, Jacob S, Grover V. Formulation and evaluation of sustained release
tablets using an insoluble rosin matrix system. Indian J Pharm Sci., 2005; 67(1): 80-83.
14.Krishanaiah YS, Lath K, Nageshwara L, Karthikeyan RS, Satyanarayana VBP.
Development of colon target oral guar gum matrix tablet of Albendazole for the treatment
of Helminthiasis. Indian J Pharm Sci., 2003; 65(4): 378-385.
15.The British Pharmacopoeia, department of health/by stationary office on behalf of the
medicine and health care product regulatory agency, crown copy right, 5th ED, 2005;
1303-1304, 2588-2589, A133.
16.The United State of Pharmacopoeia 24/ NF19 Asian Edition. The official compendia of
standard United States pharmacopoeial convection Inc. Rockville, 1995; 1015,1016,
1791.
17.Chaudhari PD. Formulation and Evaluation of fast dissolving tablet of famotidine. Indian
Drug, 2005; 42(10): 641-649.
18.Raparla DV, Murthy TE. Formulation and evaluation of oral controlled release