An Approach to National Manpower-Planning in Science
and Technology
R.H.W. JOHNSTON AND GENEVIEVE FRANKLIN
(Read before the Society, 9 January, 1975)
ABSTRACT
Data from the 1971 Census relating to the stock of graduates having degrees in science and
technology has been associated with the data on expenditure on research and development,
expenditure on higher education and measures of sectoral economic activity, to form a basis for
a national manpower planning model with potential use as a decision aid. It is suggested that
there is need for making available reorientation procedures for graduates with specialist degrees
in the natural sciences, who are being produced in considerable surplus.
INTRODUCTION
This paper outlines a method of approach whereby the hitherto assumed relationship between
science, technology and economic development may be examined quantitatively, as an aid in the
determination of $tate policy.
Interest in this relationship began to be expressed significantly by the State at the time of
publication of the OECD Report * Science and Irish Economics Development* (Stationery Office,
1966). This report was discussed at a symposium in the Statistical and Social Inquiry Society in
November 1966 to which D.I.D. Howie, T.E. Nevin and A.V. Vincent gave prepared contributions.
The stress in all these contributions was on the need for stronger links between the universities and
industry, if investment in research and development (R&D) is to be productive. The essential
connection between research and third-level teaching was also stressed.
Behind the OECD Report and the ensuing discussion lay an implicit model consisting of a
flow of trained technologists, their appetites for industrial problem-solving whetted by a spell of
training associated with relevant R & D, emerging from the third-level system into the industrial
system, transforming the latter by creative innovation. It is this implicit model that we propose
to try to quantify.
The first outcome of the OECD Report was the setting up of the National Science Council
(NSC) in December 1967. For the purpose of this study, the relevant actions of the NSC were
(a) the publication in 1967/69 and'71 of the series 'Research and Development in Ireland' (RDI)
by Dr. Diarmuid Murphy (b) the influencing of the Census of Population Division of the
Central Statistics Office towards introducing a question into the 1971 Census form relating to
qualifications in science and technology (S & T).
By the summer of 1972 the NSC was involved in helping the Census staff with the processing
of the completed forms containing S & T responses. The problem of how best to use the emerging
data posed itself.
At about the same time the Industrial Development Authority (IDA) produced.Part 1 of its Regional Industrial Plans 1973-77. This contained a'lot of relevant economic and social data, but little or nothing on the question of technologically trained manpower. The IDA was consciously beginning to develop a policy of upgrading the quality of the jobs generated by their activities, and was aware of this gap in the manpower planning area. There was therefore a positive response from the IDA to a request for support for the development of some quantitative niethodology linking up R & D, industrial output, the third-level education system and the existing S & T graduate stock as revealed by the Census for the first time. The system described in this paper is
the result. ' . . . .
-There is a mass of literature available on 'manpower planning models' in the abstract. Typical is an article in Management Science, Vol 18 no 12, August 1972, by Warren Balinsky and Arnold Reisrrran, which describes a*multi-level dynamic-programming system having a capability for optimising the combined- educational and manpower inventory costs. Anyone wishing to explore this field academically will find here a rich set of references. This we did not do, as the problem (as we saw it) lay in the adaptation .of a few elementary elements of a model to the data-structure as it was available to us, rather than to find inputs worthy of a sophisticated itiodel taken from the academic literature. •
An example of the potential utility of manpower models, in an area where there is good data available, is a book Qualified Manpower and Economic Performance published in 1971s (Allen
Lane the Penguin Press), reporting some research by a project team (P.R.G. Layard, J.D. Sargan, M.E. Ager and D.J. Jones) of the London School of Economics Higher Education Research,Unit. Thjs uses data gathered from the electrical industry and is aimed at the determatjon of .the .'right educational structure' for the labour force, measuring a'productivity' for qualified people. This is a micro-economic study, taking the factory as unit; by analysis of questionnaire material it establishes distributed measures of economically important parameters.
To summarise:
1. the Balinsky-Reisman model may be described as multi-level, single discipline, single sector, deterministic, optimising,'theoretical;
2. the LSE model may be described as multilevel, single-discipline, single sector, probabil-istic, optimising, pragmatic;
3. the present model is single-level, multi-discipline, multi-sector, deterministic, non-optim-ising, pragmatic.
Because of the way in which the structure of the present model was dominated by the availability and structure of the data (i.e. the'degree of pragmatism) we felt that it was more important to press on with the work than to spend time searching the literature. The above represents a token recognition of the existence of a body of established methodology.in this field; ii!as a result of this preliminary work some centre of continuity is set up, then it will become possible to make more effective use of the available international experience. To attempt to do so would be beyond the scope-of this paper.
The rest of this paper is dividedinto sections* as follows. First we describe the data sources; and how they influenced our aggregation decisions. Then we show howr using 1971 Census data, we were able to construct an estimate for the 1967 stock; arid how we established some measures of trends for the period 1967-71. • • *
' We then go on to describe a projection system which makes use of the data-and the trends as established in the period 1967;71.to estimate^ the supply and 4emand position in. 1975. and 1979, on a flexible set of assumptions. We carry out four projections, on three sets of growth assumptions supplemented by one 'changed R & D policy' set of assumption's, as an illustration of the possibilities presented by the; use of computer techniques in this field. We then finally present some conclusions, suggested some mechanisms for stimulating demand for graduates in disciplines which are in surplus.
DATA SOURCES
If the census were the only data-source, it would be possible to group the 342 industrial codes in any way we liked, likewise the 99 possible qualifications codes. However because the RDI studies already existed and had done some aggregation,it was decided to accept twenty-three industrial groupings, defined in the latter and listed in Table Is and the following four broad
groupings of disciplines: agriculture (including vets), engineering, medical (including dentistry) and natural sciences. Although social sciences were included in the RDI studies, and we would have liked to include them, they were not included in the census material.
We therefore worked with a 25 x 4 array of sectors and disciplines, the 25th sector being the special one of which the product is manpower. We kept the 24th sector as a spare.
In order to reduce the census material to the form of a 25 x 4 x 11 stock array (we used eleven four-year age-groupings covering the range 20 to 64) we developed a pre-processor which the staff of the Census of Population Division of the CSO ran for us on the State computer at Kilmainham. (We are indebted to them for this service). This pre-processor is flexibly designed and can accept any aggregation rules within wide constraints; it can run also on a regional basis if desired.
TABLE I
LIST OF SECTORS
Sectors
1 Central and Local Government 2 Agriculture and Associated Trade
3 Building and Construction (excluding electrical contracting) 4 Transport and Storage
5 Radio & Telecommunication 6 Health Services
7 State Planning & Research Bodies 8 Development Areas and Physical Planning
9 Miscellaneous financial, commercial and other services
10 Education other than 3rd level schools giving degrees in technology 11 Mining and Peat
12 Electrical Industry and Associated Commerce 13 Chemicals, Rubber, Plastic
14 Vehicle Production and Repair 15 Metal Products
16 Machinery
17 Textiles, Clothing, Footwear and Associated Commerce 18 Food, Drink, Tobacco
19 Wood, and Furniture 20 Paper, Printing 21 Glass, Clay, Cement 22 Utilities
23 Other Miscellaneous industries 24 Spare
25 Universities and Colleges of Technology
Similarly, the RDI aggregation of qualifications into broad disciplinary groups determined the structure of the data provided by the Higher Education Authority. This was prepared by the HE A staff; we are indebted to Mr. John L. Hayden for the graduate statistics (Table V).
The estimation of the breakdown of the cost data over the disciplines (Table VI) is our own (with the help of Rory Alkin, M.Sc, and HEA sources) and we are conscious of its crudity, in the absence of standard budgeting procedures on the part of the various colleges. Absolute measures of unit-costs by discipline are therefore to be taken cum grano saiis, until such time as good data are available derived from improved HEA statistical procedures. However in the projection
procedures we can normalise the graduate output to match the observed numerical situation in the unit-ratios, so that to have correct absolute unit-costs would be an added luxury, not essential to the argument.
As regards the economic background, the measures relating to the 23 industrial sectors were prepared by the Planning Division of the IDA in accordance with our instruction that they should be representative of total output (or total cost, if the sector is a State service) rather than value added.. We made this point because we are convinced that to restrict the measure to value added and ignore value of raw material would be to deny the importance of employing S & T manpower in the important field of quality control of industrial inputs. A firm processing high-value material and adding little high-value to it (e.g. a milk processing factory) is obliged to expend considerable S & T effort in input quality control.
It is not the function of this paper to argue the authenticity or otherwise of the measures of economic activity provided by the IDA. Suffice it to say that we have accepted these measures as a working hypothesis; the function of the system described here is to take these data sets (some more hypothetical than others) and fold them into an integrated information-processing system which will compute measures of their consequences.
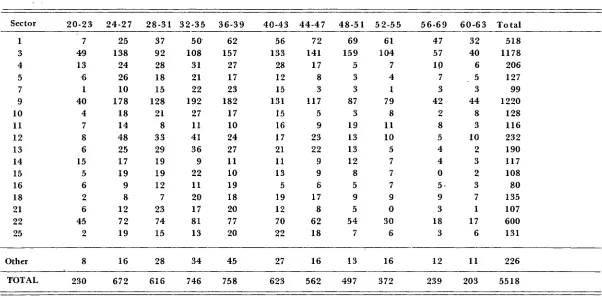
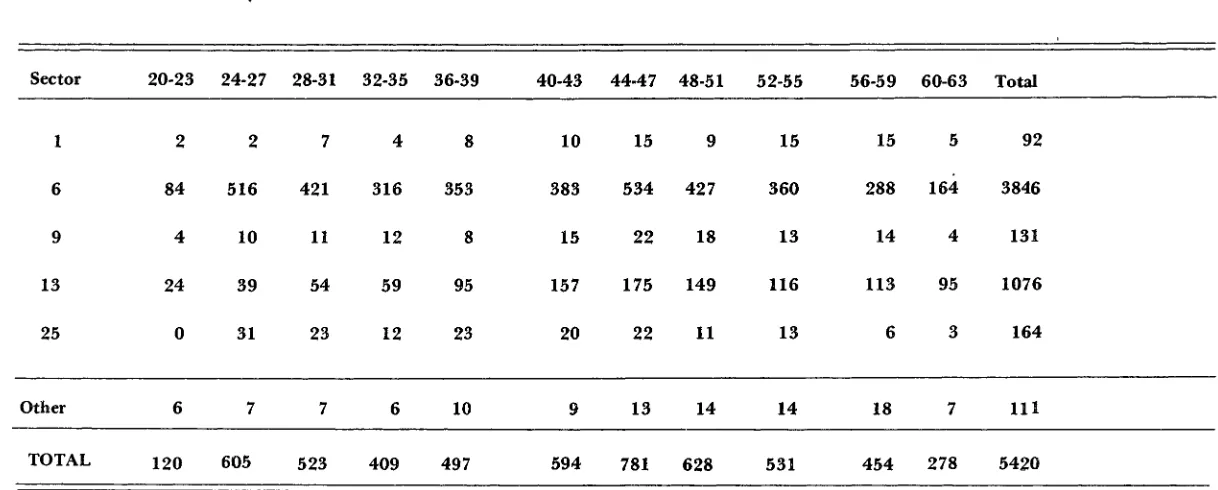
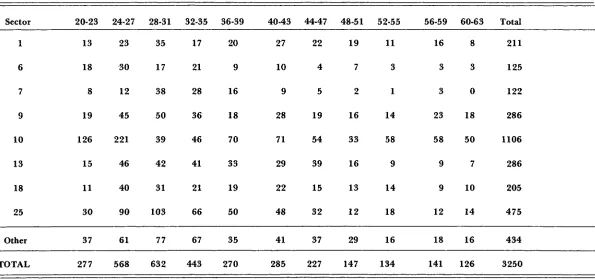
The Census head-count for 1971 is given in Table II (1-5). Note that this is not exactly comparable to the figures published by the Census of Population (Bulletin'No/40); thus of the 5,746 gainfully occupied engineers we have got only 5,518 due largely to exclusion of the under 20s and over 64s.
The volumes of gross output, as supplied by the IDA, are given by sector in Table III, along with the graduates employed. An astute reader will ask at this point how were the 1967 graduates employed determined. - This is outlined in the next section.
The expenditures and manpowers in graduate equivalents associated with industrial R & D activities, as given in.RDI, are displayed in Table IV. Where Dr. Murphy's categories have been aggregated we have brought out the original values, for ease of reference back.
The data as the higher education system, both from RDI and from HEA, are given in Tables V and VI.
THE BASE-PERIOD 1967-71
In this section we describe how we constructed an estimated graduate stock for 1967, without access to actual census data in that year. We then go on to outline how we determined the trends in the various ratios of interest; we also outline a procedure for taking care of 'wild* trends which derive from statistical fluctuations of small numbers.
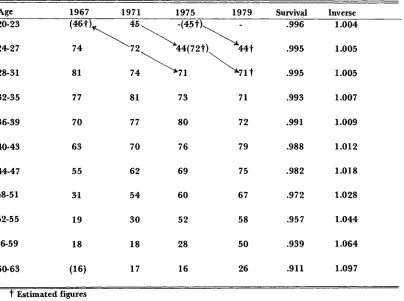
In Table VII we display.(for an example) the 1971 age-distribution for engineers working in utilities; we display beside it to the left the corresponding age distribution for the same stock as it was in 1967, and to tne,right „ of it the age distribution for the same stock as it will be in 1975. These we obtain by displacing the distribution one step upwards and downwards respectively, and operating on it respectively with inverse and straight survival factors. These latter are also displayed.
TABLE II (1)
1971 GRADUATE-COUNT BY DISCIPLINE BY SECTOR BY AGE-GROUP OF THE PRINCIPAL SECTORS
AGRICULTURAL SCIENTISTS
S ector 20-23 24-27 28-31 32-35 36-39 40-43 44-47 48-51 52-55 56-69 60-63 Total
1
2
7
9
10
18
25
25
25
3
19
17
42
6
139
72
111
88
60
119
15
149
60
22
91
39
90
16
175
49
36
107
27
119
25
115
50
28
85
21
83
12
91
36
15
90
11
57
11
131
34
16
61
16
73
9
121
23
11
67
10
60
7
89
24
4
34
11
50
8
55
21
4
16
8
28
4
35
13
0
15
11
21
3
1125
407
150
673
231
742
116
Other
TOTAL
3
140
18
522
19
486
21
559
20
414
12
323
11
351
20
319
11
231
5
141
0
98
140
[image:5.675.31.648.113.382.2]TABLE II (2)
1971 GRADUATE - COUNT BY DISCIPLINE BY SECTOR BY AGE-GROUP OF THE PRINCIPAL SECTORS
ENGINEERS
Sector
20-23 24-27 28-31 32-35 36-39 40-43 44-47 48-51 52-55
56-69 60-63 Total
[image:6.674.29.631.111.409.2]TABLE II (3)
1971 GRADUATE-COUNT BY DISCIPLINE BY SECTOR BY AGE-GROUP OF THE PRINCIPAL SECTORS
MEDICALS
Sector 20-23 24-27 28-31 32-35 36-39 40-43 44-47 48-51 52-55 56-59 60-63 Total
1
6
9
13 25
2
84
4
24
0
2
516 10 39 31
7
421 11 54 23
4
316
12 59
12
8
353
8
95 23
10 383 15 157 20
15 534
22 175
22
9
427 18 149 11
15 360 13
116 13
15 288 14 113
6
5
164
4
95
3
92
3846
131
1076
164
Other
T O T A L
6
120
7
605
7
523
6
409
10
497
9
594
13
781 14
628
14
531
18
454
7
278
111
[image:7.675.40.649.112.357.2]TABLE II (4)
1971 GRADUATE-COUNT BY DISCIPLINE BY SECTOR BY AGE-GROUP OF THE PRINCIPAL SECTORS
NATURAL SCIENTISTS
Sector 20-23 24-27 28-31 32-35 36-39 40-43 44-47 48-51 52-55 56-59 60-63 Total
[image:8.674.49.644.89.368.2]TABLE II (5)
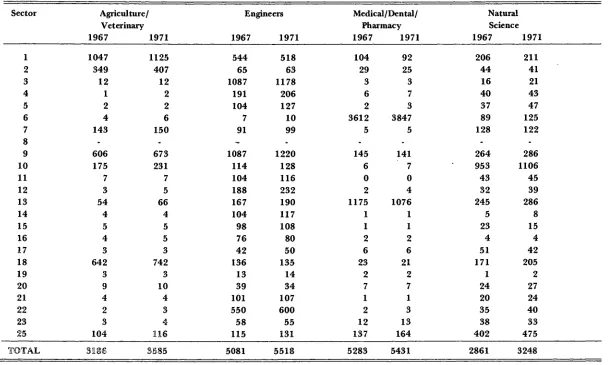
GRADUATES BY SECTOR BY DISCIPLINE
[image:9.676.42.650.77.442.2]TABLE III
GRADUATE EMPLOYMENT AND VOLUME OF GROSS OUTPUT BY SECTOR
1 2 3 4 5 6 7 8 9 10 11 12 13 14 15 16 17 18 19 20 21 22 23 25
Volume of
Output
1967
61.0
127.7
133.4
174.1
20.2
21.9
1242.8
118.7
92.0
34.9
229.0
29.9
204.0
47.4
34.2
7.9104.6
373.4
146.0
134.0
213.0
43.8
204.0
-1971
71.0
149.7
174.0
212.0
26.1
35.5
1476.0
282.5
134.0
49.9
330.0
35.2
268.0
55.8
40.4
9.3140.8
440.4
192.0
317.0
317.0
51.9
299.0
-Annual
andIncrease
3.9 4.1 6.8 5.0 6.612.7
4.424.2
9.9 9.1 9.6 4.2 7.1 4.2 4.3 4.2 7.7 4.2 7.124.0
10.5
4.310.0
-Graduates
Employed
1967
1901
4871118
238 1453712
330 372102
1248
154 2251641
114 117 86 102 972 19 79 126 589 111 75816411
1971
1946
5361214
258 1793988
376 02320
1472
168 2811618
130 129 911101
1103
21 78 136 646 105 88617782
-TABLE IV
R & D MANPOWER AND EXPENDITURE
Sector Expenditure 1967 1971 Manpower 1967 1971 Manpower/Expenditure 1967 1971
Trend in R & D numbers per unit
R & Dec
14 101.9 10.0 = 2240.1 119.9 3848.9 230.8 55.1 = 258.9
286.1
2.2 17.0 = 19.2
4 5 6 7 8 9 10 11 12 13 158.5
71.7 = 230.2
0.4 15.4 385.7 234.6 122.8 -122.0 236.1 346.8 189.5 395.8 558.3 211.3 = 585.3 39.6 74.0 1009.2 638.5 427.6 222.3 484.4 = 769.6 19.3 30.0 = 49.3
0.2 3.1 58.4 36.6 35.6 . 10.0 32.0 58.3 313.4 25.5
4.7 = 30.2
(a)
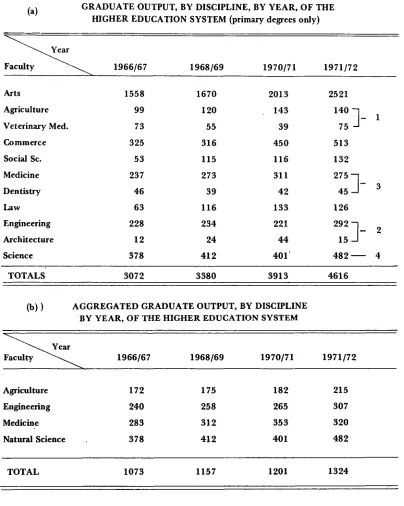
[image:12.472.24.428.41.547.2]TABLE V
GRADUATE OUTPUT, BY DISCIPLINE, BY YEAR, OF THE HIGHER EDUCATION SYSTEM (primary degrees only)
Year
Faculty 1966/67 1968/69 1970/71 1971/72
Arts
Agriculture
Veterinary Med.
Commerce
Social Sc.
Medicine
Dentistry
Law
Engineering
Architecture
Science
1558
99
73
325
53
237
46
63
228
12
378
1670
120
55
316
115
273
39
116
234
24
412
2013
143
39
450
116
311
42
133
221
44
401
2521
1 4 0
1 -
i
75 J513
132
275-1
45 J '
3 126292 " | _
1
5
J
482 4
TOTALS 3072 3380 3913 4616
(b)) AGGREGATED GRADUATE OUTPUT, BY DISCIPLINE BY YEAR, OF THE HIGHER EDUCATION SYSTEM
Faculty ^ \ ^ ^
Agriculture
Engineering
Medicine
Natural Science
TOTAL
1966/67
172
240
283
378
1073
1968/69
175
258
312
412
1157
1970/71
182
265
353
401
1201
1971/72
215
307
320
482
1324
TABLE VI
R & D NUMBERS, R & D COST, TOTAL EXPENDITURE AND GRADUATE OUTPUT IN HIGHER EDUCATION
1967
Total
fexpenditure
1971
R & D
Expenditure
(£000)
1972
1967
1971
Agricultural Sciences
Engineering & Technology
Medical Sciences
Natural Sciences
Agricultural Sciences
Engineering & Technology
Medical Sciences
Natural Sciences
713.3
516.0
632.5
1191.0
R&D
Manpower
1967
33.6
59.4
63,6
270.3
1510.0
1230.0
1570.0
2950.0
1971
51.8
75.5
92.2
307.8
1859.9
1538.8
1992.4
3768.0
92
125
194
498
Graduate output
1966/67
172
240
283
378
1971/72
215
307
320
482
167
183
360
681
Estimated accumul.
4-year output
761
TABLE VII
SECTION 22: ENGINEERS IN THE UTILITIES SECTOR
Age 1967 1971 1975 1979 Survival Inverse
20-23
24-27
28-31
32-35
74
81
77
45
^ 7 2
74
81
73-7lt
71
.996
.995
.995
.993
1.004
1.005
1.005
1.007
36-39 70 77 80 72 .991 1.009
40-43
44-47
48-51
52-55
56-59
63
55
31
19
18
70
62
54
30
18
76
69
60
52
28
79
75
67
58
50
.988
.982
.972
.957
.939
1.012
1.018
1.028
1.044
1.064
60-63 (16) 17 16 26 .911 1.097
t Estimated figures
The end-effects we take care of as follows.
Case 1 1967 age-group 20-23: preserve the ratio of the first two age groups.
Case 2 1967 age-group 60-63: relate to a smoothed tail-profile.
Case 3 1975 age-group 20-23: this is the gap into which the new cohort will come, in the model. We treat this in the next section, when we come to describe the projection procedure. At this point however we can usefully define the 'attrition coefficient' : the ratio of the year N+4 stock without the 20-23 age-group, as listed above, to the year N stock.
In order to get the attrition coefficients for projection step 2, we have to fill in estimates (t) of the 20-23 and 24-27 age groups of the 1975 distribution, conforming to the 1971
profile. In the case of 1979, the estimation extends up to the 28-31 group.
Thus the determination of the attrition coefficients is an approximate procedure; it is a device for abstracting from the details of age-distributions in the main projection programme, which deals in total stock by sector and discipline but not by age.
This approximation becomes worse the further one attempts to go into the future. The above calculations were carried out by the pre-processor, at the same time as the basic census data were aggregated. Any re-run with different aggregation rules would of course give revised attrition-arrays.
A block diagram of the pre-processor system is shown in Figure 1:
FIGURE 1:
All necessary measures for 1967 and 1971 being available, the calculation of trends for the various relevant ratios was a simple matter. We wrote a small utility programme to determine the annual percentage increase necessary to relate two measures and their ratio over a period of N years.
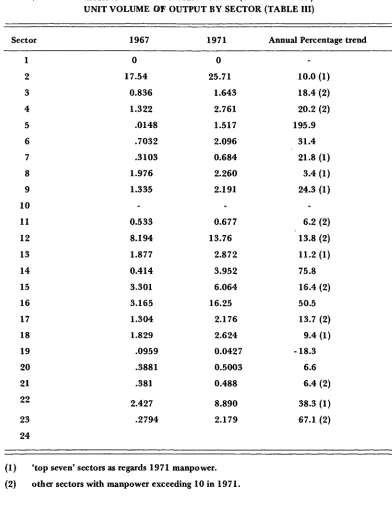
Tables VIII and IX show the remainder of the inputs necessary for the model, with the trends displayed explicitly. Other trends, such as graduates per unit gross output and R 8c D manpower per unit expenditure are included in Tables III and IV respectively.
It will be noted that we have adopted a procedure for concentrating attention where the numbers are large. Referring to Table III, the trends labelled (1) were treated individually: these were the top seven graduate-employing sectors. Those labelled (2) were folded into a background average trend; the unlabelled ones, being small-number based, were ignored.
Similarly the top seven R & D graduate employers were treated separately (trends subscripted (1) in Table IV) and the remainder labelled (2) were folded into a background.
We note in passing the following:
1. The following are in the 'top seven9 for both R & D manpower and graduate
man-power: finance &: commerce; chemicals, rubber, plastic; food, drink, tobacco.
The following are in the 'top seven' for graduate employment but not for R & D: central and local government, building and construction, health services, education other than 3rd level.
2.
3. The following are in the 'top seven' for R & D but not for general graduate employment: agriculture, state planning and research, development area, and physical planning and utilities.
We can also usefully consider the relationship between the output of graduates and the numbers employed in the 24-27 age-group, as it was in 1971. This age-group represents the cohort graduating in or about the period 1966-69.
TABLE VIII
R & D EXPENDITURE/TOTAL H.E. EXPENDITURE
Agricultural Science
Engineering & Technology
Medical Sciences
Natural Sciences
1967 1971 Annual percentage trend
0.1290
0.2422
0.3067
0.4181
0.1106
0.1488
0.2293
0.2308
-3.8
-11.5
-7.0
-13.8
Agricultural Sciences
Engineering & Technology
Medical Sciences
Natural Sciences
ACADEMIC STAFF/TOTAL H.E. EXPENDITURE
1967 1971 Annual percentage trend
0.1458
0.2229
0.2166
0.3375
0.0768
0.1065
0.1045
0.1610
-14.8
-16.9
-16.7
TABLE IX
RESEARCH AND DEVELOPMENT COSTS (SEE TABLE IV) PER UNIT VOLUME OF OUTPUT BY SECTOR (TABLE III)
Sector 1967 1971 Annual Percentage trend
1
2
3
4
5
6
7
8
9
10 11 12 13 14 15 16 17 18 19 20 21 22 23 24
0
17.54
0.836
1.322
.0148
.7032
.3103
1.976
1.335
0.533
8.194
1.877
0.414
3.301
3.165
1.304
1.829
.0959
.3881
.381
2.427
.2794
0
25.71
1.643
2.761
1.517
2.096
0.684
2.260
2.191
0.677
13.76
2.872
3.952
6.064
16.25
2.176
2.624
0.0427
0.5003
0.488
8.890
2.179
-10.0 (1)
18.4 (2)
20.2 (2)
195.9
31.4
21.8 (1)
3.4 (1)
24.3 (1)
6.2 (2)
13.8 (2)
11.2(1)
75.8
16.4 (2)
50.5
13.7 (2)
9.4 (1)
-18.3
6.6
6.4 (2)
38.3 (1)
67.1 (2)
(1) 'top seven' sectors as regards 1971 manpower.
(2) other sectors with manpower exceeding 10 in 1971.
Taking a mean between the graduate outputs for the academic years 1966/67 and 1968/69,
and expressing the four-year cohort as jobs per year, we get the results displayed in Table X.
TABLE X
1971 Jobs in 24-27
age-group
522
672
598
568
Jobs per year
131
168
150
142
Annual supply of
graduate in *66-'69
173
249
297
395
Agriculture
Engineering
Medicine
Natural Sciences
This shows a very considerable degree of under-consumption of science graduates, or
over production relative to effective demand. Engineers are more nearly in balance, as are
agriculturalists. Medicals are possibly inflated due to a strong foreign student component, by
tradition.
The existence of this imbalance makes the projection model, described in the next
section, of some interest, in that it can be used to evaluate how the degree of imbalance responds
to policy changes, particularly with regard to R 8c D.
CONSTRUCTION OF THE MODEL
In this section we define the elements of the system which we model, and specify the
manner in which it is hypothesised to interact with the environment. We suggest a short-list of
policy variables which may be regarded as subject to control by the State.
We describe the steps whereby supply and demand are projected, and suggest an
adjustment mechanism, without however going into the question of price. (By and large the
price may be regarded as externally determined, or at least influenced.)
The system falls naturally into two parts: a production/services segment, made up of
23 sectors, and a higher education segment, which may be regarded as a 24th sector having special
properties. This is not simply a 'demand' segment and a 'supply* segment: the 'demand' extends
into the higher education segment, which has to feed itself with recruits, as well as supplying the
production/services segment.
Consider first the definition of the system and its measures in the base-year.
We have in the production/services segment the following inputs:
(1) a graduate stock array, 23 sector by 4 disciplines.
(2) a gross output vector for 23 sectors.
(3) an 'R & D graduate equivalent' vector for 23 sectors.
(4) an
4R 8c D expenditure' vector for 23 sectors.
With these inputs we construct the following secondary variables:
(a) From (1) we construct a set of 'split-vectors': the fraction of graduates of each
discipline employed in each sector.
(b) Subtracting (3) from (1) and dividing by (2) we construct a vector for the 23 sectors which gives 'non-R 8c D graduates per unit of gross output*. This is hypothesised to measure the general graduate employment level, irrespective of the R & D effort, as a function of economic activity.
(c) Dividing (4) by (2) we get a vector 'R 8c D expenditure per unit gross output*.
(d) Dividing (3) by (4) we get a vector 'R & D graduate equivalent per unit R & D expenditure*.
Turning to the Higher Education segment, this constitutes a 24th sector but is treated in more detail, in that each of the measures is broken out over the four disciplines. We do not depend on a set of 'split-vectors* operating on an aggregated value, but keep the measures
disaggregated. We have the following inputs in the form of discipline-vectors (8 elements, of which we are using 4):
(5) graduate output (6) graduate staff
(7) higher education expenditure (8) R & D graduate equivalent (9) R 8c D expenditure
With the above inputs we construct the following secondary variables:
(e) Dividing (5) by (7) we get 'graduate output per unit of higher education (H. E.) expenditure*.
(f) Subtracting (8) from (6) and dividing by (7) we get 'teaching graduate equivalent per unit H.E. expenditure*.
(g) Dividing (9) by (7) we get 'R & D expenditure per unit H.E. expenditure*,
(h) Dividing (8) by (9) we get 'R & D graduates per unit R & D expenditure*.
The measures of the system and the environment in the base-year are now fully defined. The interaction between the system and the environment is defined by means of the hypotheses
(A) that there is a linear proportionality between economic activity as measured by gross output and non» R & D* graduate employment.
(B) that there is a linear proportionality between R & D expenditure and R 8c D graduate employment.
(C) that the coefficients in the above linear relationships are themselves subject back-ground trends reflecting environmental changes (e.g. productivity, inflation etc).
We are now in a position to define the projection procedure. We use a four-year increment. The steps are set out in block diagram form in Figures 2 and 3.
First we update those secondary variables (i.e. the coefficients in the assumed linear relationships) which are subject to background trends as follows:
(b) combined productivity and inflation;
(d) and (h) combined inflation and trend towards 'capital-intensiveness*: improved equipment etc;
PRODfJC FION / SERVICES SERVICES
GRADUATE STOCK (1 BY SECTOR
DISCIP-LINE
GROSS OUTPUT (2) BY SECTOR
T~ZI
'SPLIT-VECTORS' % (a) IN EACH DISCIPLINE %
BY SECTOR
1 ATTENUATORS
NON-R & D GRADUATES PER UNIT GROSS OUT-PUT BY SECTOR
UPDATED (2') GROSS OUTPUT
BY SECTOR
_JL
R & D EXPENDI1URE PER UNIT GROSS OUTPUT,
BY SECTOR
UPDATED NON-R & D (b') GRADUATE PER UNIT
GROSS OUTPUT
J
UPDATED R & D (c') EXPENDITURE PRESENT
GROSS OUTPUT
UFDATED NON- (lb')
R& DGRADUATES
BY SECTOR
UPDATED R & D ( 4 ) EXPENDITURE
UPDATED TOTAL (1) GRADUATE REQUIRE-MENT BY SECTOR/
UPDA1ED TOTAL (lb' 3') GRADUATE REQUIREMENTS K
BY SECTOR
UPDATED MODIFIED (1") GRADUATE STOCK BY
DISCIPLINE SECTOR
<r-S3IORTF\LL= INTAKE (SI)
3Y SECTOR/DISCIPLINE UPDATED
'SPLIT VECTOR'
a'^
R & D GRADU^TFS (d) PER UNIT R & D
J-XPEND-2TURE BY SECTOR
UPDATED R & D (d') GRADUATES PER UNIT
HIGHER EDUCATION SEGMENT
GRADUATE OUTPUT BY DISCIPLINE
(5) GRADUATE STAFF (6) BY DISCIPLINE
GRADUATE OUTPUT (e) PER UNIT OF H E
EXPENDITURE
/ATTENUATOR) V ARRAY
UPDATED (e') GRADUATE OUTPUT PER UNIT H E
EXPENDITURE
HIGHER EDUCATION (7) EXPENDITURE BY
DISCIPLINE
TEACHING (f) GRADUATES PER UNIT
EXPENDITURE
ATTENUATED (6a') GRADUATE STAFF
UPDATED (5') GRADUATE OUTPUT
BY DISCIPLINE
UPDATED TEACHING (f') 1RADUATES PER UNIT
H E EXPENDITURE
R & D GRADUATES (8) BY DISCIPLINE
R&r D FXPFNDHURM9 BY DISC IPLINF
R 8c D EXPENDIT- (g) URE PER UNIT H.E.
EXPENDITURE
R&: DGRADUATFS (h) PER UNIT R & D
FXPENDITURF
UPDATED H.E. (7') EXPENDITURE
UPDATED TEACHING (6f) GRADUATES BY DISCIPLINE
SHORTFALL BY (S2) DISCIPLINE- INTAKE
UPDATED R & D ( EXP. PER UNIT H.E
EXPENDITURE
UPDATFDR&I) (h) C.RADUATFS PI R UNII
R & DfXPFNDIIURI
UPDATED R 8c D (9') EXPENDITURE
UPDATFDR&D (8) GRADUATFS BY DISCIPLINF ~
UPDATED TOTAL GRADUATES (6F,8') IN H E BY DISCIPLINE
SURPLUS/SHORTFALL BY (S) DISCIPLINE
ALLOCATION OR SURPLUS BY DISCIPLINE/SECTOR
('Plug-in' algorithm)
UPDATED AND MODIFIED (1") GRADUATE STOCK IN H E
(e) and (f) mainly inflation.
Then we update those coefficients which are subject to state policy;
(c) and (g): both these can be influenced by tax rebates, grants and other incentives by bodies such as the NSC (or now the National Board for Science and Technology).
Finally we update the basic economic background variables (2) and the H.E. expenditure (7).
We are now in a position to update the graduate demand. Denoting henceforth the updated variables by 'prime', we go through the following steps (see Figure 2).
(2*) x (b*) —>cnon R & D graduates by sector' (lb')
We now have (lb,3) which is the updated graduate requirements by sector, but not by discipline. To bring in the disciplines we operate on it with the * split-vectors' (a) and end up with
(1/) which is an updated graduate stock demand array.
We are assuming that there is short-term stability in the 'split-vectors' (a): We do, however, subsequently modify (a) in the light of a proposed adjustment mechanism, so that it does in the end act as a slow dependent variable, with a one-period lag.
The updated total demand (V) will be satisfied by two sources: the old stock attenuated by death and retirement and by new recruits.
We construct an attenuated stock array (la*) by operating on the base-year stock array (1) with the attenuator array, which has been read in as input. (It will be remembered that one of the tasks of the pre-processor was to abstract the age-distributions into survival factors for each discipline and sector; see Figure !•)
Subtracting (la') from (I1) gives SI, the recruitment necessary by sector and discipline.
This is available for comparison with the graduate output given by the Higher Education segment. We now consider the higher education sector and compute the demand for the graduates necessary for its maintenance, as well as the supply of graduates which it produces.
Referring to Figure 3, we go through the following steps:
(7') x (f1) —^'teaching graduate equivalent by discipline' (6F)
(7') x (e<) -*(5«)
(6F, 8')
We now have the updated graduate requirements by discipline, for teaching and research, in the H.E. sector. This will be satisfied by the attenuated old stock (6a') and new recruits; the latter are given by
( 6 f , 8 » ) - (6a')-»(S2)
We are now in a position to establish an overall graduate balance:
In the context of contemporary Ireland this in all cases is a positive surplus, so that in the present model we have not had to introduce a mechanism for dealing with deficiencies. To do so would not present a problem, as regards the subsequent computational steps.
In order to take care of the surplus, we have introduced a hypothesis which we call the 'soak process*. We assume that a certain fraction of the surplus of each discipline is absorbed into the updated graduate stock, and that the 'soak1 from each discipline spreads itself across the sectors
in proportion as it is already there.
The fraction of surplus thus *soaked up' we estimate using an arbitrary algorithm which quantifies the following hypothesis: if an emigration tradition exists it will tend to persist; if the tradition is not to emigrate, the surplus graduate will stay and be soaked up. Thus the greater the surplus is, the smaller its tendency to be soaked up.
The parameters of this hypothesis are a proper subject for sociological studies on graduate emigration. In the present study, we acknowledge that it is an arbitrary ad hoc assumption.
It is by no means essential to the model that this particular hypothesis be adopted. It constitutes a 'plug-in' module of the programme which could in a subsequent run be replaced by some alternative hypothesis.
We felt,however,that we needed to introduce some such mechanism, in order to avoid the criticism that the 'split-vectors' ((a), Figure 2) were invariant, and that this was artificial. We needed a mechanism for introducing slow change, under the influence of the 'push' of the output from the H.E. system. We submit that, however arbitrary this assumption seems, it would be even less defensible to impose the strait-jacket of invariant discipline-mixes in all sectors.
The final step in the cycle is therefore to adjust the updated graduate stock (1') with the 'soak' fraction of the surplus (S), giving the 'modified stock' (1"), which is then used to establish an updated set of 'split-vectors' (a') for use in the next cycle.
The cycle is then repeated, for as many steps as one likes. In practice, we doubt if more than 3 or 4 steps would be meaningful, in view of the approximations in the determination of the attenuation-array. However 12-16 years seems a reasonable planning horizon for this type of exercise.
PROJECTIONS TO 1979
Before carrying out a projection, it is useful to validate the model by applying it to the period 1967-71. This is a non-trivial step, in that it is useful to check that the approximations which we have made (e.g. separate trends for the 'top seven' sectors against an averaged background, etc) are not too sweeping.
It is also useful to be able to 'fine-tune' the model using those trends of which the value is least well known as 'fitting parameters'.
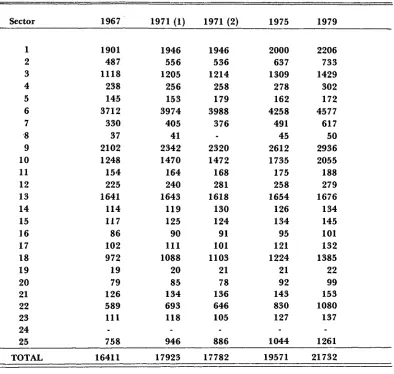
This we have done, and the result is displayed in Table XI (1). It will be seen that the projected and actual versions as the 1971 stock are in reasonable agreement.
We allowed the model to run on, on present trends. The surplus pattern which emerged is shown in Table XI (2). We refer on this as Run (a).
Then we started to amend the inputs. In this study we have not explored fully the many combinations possible. We confined ourselves to three alternative 'scenarios', as follows:
Run (b) : 2.6 percentage points reduction in annual growth of volume of output, across all sectors, after 1971.
Run (c) : as for (b) but with 20 percentage points increase in trend in R & D expenditures per unit volume of output on all but three already well-developed sectors.
Run (c) : 5.3 percentage points reduction in annual growth of volume of output, across all sectors, after 1971,
If these runs seem pessimistic, may we say that their strategy was decided at the height of the oil crisis.
TABLE XI (1) Run (a)
PROJECTED GRADUATE STOCK AT WORK, BY SECTOR, PRESENT TRENDS
Sector 1
2
3 4 5 6 7 8 9 10 11 12 13 14 15 16 17 18 19 20 21 22 23 24 25 T O T A L1967 1901 487 1118 238 145 3712 330 37 2102 1248 154 225 1641 114 117 86 102 972 19 79 126 589 111 -758 16411 1971 (1) 1946 556 1205 256 153 3974 405 41 2342 1470 164 240 1643 119 125 90 111 1088 20 85 134 693 118 -946 17923 1971 (2) 1946 536 1214 258 179 3988 376 -2320 1472 168 281 1618 130 124 91 101 1103 21 78 136 646 105 -886 17782 1975 2000 637 1309 278 162 4258 491 45 2612 1735 175 258 1654 126 134 95 121 1224 21 92 143 830 127 -1044 19571 1979 2206 733 1429 302 172 4577 617 50 2936 2055 188 279 1676 134 145 101 132 1385
22
99 153 1080 137 -1261 21732(1) output from model derived from 1967 base-year (2) actual census output.
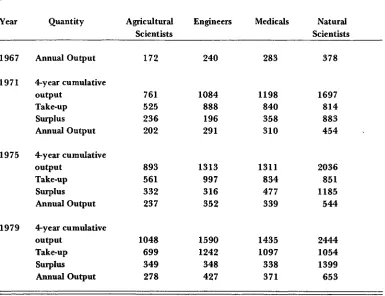
[image:24.474.31.425.73.447.2]TABLE XI (2) Run (a)
GRADUATE OUTPUT, TAKE-UP AND EMIGRATION
Year
1967
1971
1975
1979
Quantity
Annual Output
4-year cumulative output
Take-up Surplus Annual Output
4-year cumulative output
Take-up Surplus Annual Output
4-year cumulative output
Take-up Surplus Annual Output
Agricultural Scientists
172
761 525 236 202
893 561 332 237
1048 699 349 278
Engineers
240
1084 888 196 291
1313 997 316 352
1590 1242 348 427
Medicals
283
1198 840 358 310
1311 834 477 339
1435 1097 338 371
Natural Scientists
378
1697 814 883 454
2036 851 1185 544
2444 1054 1399 653
[image:25.471.59.444.73.369.2]TABLE XII (1) Run (b)
PROJECTED GRADUATE STOCK AT WORK, ASSUMING 2.6 PERCENTAGE POINTS REDUCTION ON TREND IN VOLUME OF OUTPUT ACROSS ALL
SECTORS, AFTER 1971
[image:26.470.31.424.94.489.2]It is useful however to be able to compare projections (b) and (c): it looks as if the development of a more agressive R & D policy would have an appreciable impact on the graduate surplus. It is not outside the reach of the State to allow R &: D expenditure to double over four years, thereby arriving at a figure of over 20 per cent of graduates in industry engaged in R Sc D, compared with the current 10 per cent. The figure for the UK is reputed currently to be of the order of 30 per cent.
Since we are already in 1975, one step of the model's progress away from the base-year 1971, it is useful to look at the Graduate Placement Report of the Association of Irish University Careers and Appointments Services.
In 1973, of the 414 science graduates 352 were traceable, and of these 85 were in employment. The remainder were mostly in one or another kind of further study, mainly teacher training (120).
Of the 275 engineers, 245 responded and 136 were in employment, only 30 being in further study.
Thus although there is not an exact reconciliation between the figures, the picture emerges of a pool of unemployed science graduates, hoping by research to obtain an entry into the academic system, into which the annual intake might be of the order of 20 or 30, if the age-distribution for sector 25 given in Table II (4) is anything to go by.
No statistics are available for the flows of higher-degree students. The indication of this study is that the majority of them emigrate.
DISCUSSION AND CONCLUSIONS
Given that the problem is basically one of relative over-production of specialist scientists, there are various courses of action open to a Government concerned with optimal allocation of national resources.
(1) To run down expenditure on the Higher Education System selectively until the output matches the present input needs of industry.
This would be a reasonable course of action if it could be demonstrated that the present level of scientific technology in industry was in some way optimal. The general concensus (cf the Cooper-Whelan report * Science, Technology and Industry in Ireland', published by the National Science Council, January 1973) is that this is far from being the case.
(2) To encourage by subsidy or other device the ingestion of the present graduate output into industry. This, however, might be counter-productive if, for example, the 'cultural gap' between the surplus science graduates and the current problem areas in industrial technology was such as to block mutual understanding. There is some evidence, at the level of case-histories known to us, thus this is so.
(3) To develop a re-orientation programme for specialist graduates such as to familiarise them with practical industrial problems. These re-orientation programmes could be aimed at:
(a) young graduates;
(b) mature specialists in State research institutes who wish to generalise themselves towards management.
TABLE XII (2)
GRADUATE OUTPUT, TAKE-UP AND EMIGRATION Fun (b)
Year Quantity Agricultural Engineers Medicals Natural Scientists Scientists
1967
1971
1975
1979
Annual Output
4-year cumulative output
Take-up Surplus Annual
4-year cumulative output
Take-up Surplus Annual Output
4-year cumulative output
Take-up Surplus Annual Output
172
761 525 236 202
893 17 876 237
1048 120 928 278
240
1084 888 196 291
1313 238 1075 352
1590 395 1195 427
283
1198 840 358 310
1311 22 1289 339
1435 320 1115 371
378
1697 814 883 454
2036 372 1664 544
2444 442 2002 653
[image:28.470.33.426.59.371.2]TABLE XIII (1) Run (c)
PROJECTED GRADUATE STOCK AT WORK, ASSUMING 2.6 PERCENTAGE POINTS REDUCTION ON TREND IN VOLUME OF OUTPUT ACROSS ALL SECTORS AFTER 1971, WITH 20 PERCENTAGE POINTS INCREASE IN TREND IN R & D EXPENDITURE PER UNIT VOLUME OF OUTPUT ON ALL BUT THREE
ALREADY WELL DEVELOPED SECTORS
Sector 1 2 3 4 5 6 7 8 9 10 11 12 13 14 15 16 17 18 19 20 21 22 23 25 T O T A L
[image:29.476.53.442.70.489.2]The first option is unacceptable, because if there is a decline in the quality of the basic science teaching and research in the universities, in the long run the teaching of engineers will degenerate to text-book procedures, producing rapidly obsolescent engineers.
' The second option on its own, as explained above, would be counter-productive.
If the second option were to be supplemented by the third, however, there could be a dramatic increase in the level of technological understanding available to Irish industry, in quite a short time.
We now attempt to define this re-orientation process.
In the case of the Agricultural and Engineering graduates, absorption into economic life is limited by the 'permanent and pensionable job' psychology associated with large State and semi-State establishments. (See age-distributions, Table II).
This problem could be resolved by tackling the promotion-blocking middle age-groups in these bodies.
If there were to be arranged a 'a controlled leak' of experienced agriculturalists and engineers from these age-groups into economic life in an entrepreneurial or management capacity, the way would be cleared for a dynamic flow of energetic young people into (and after say 10-15 years, out of) the State and semi-State systems.
Such a flow exists to some extent in the case of Aer Lingus.
What is needed is the development of 'mature graduate re-orientation schemes'; the possibility for a man in the age-bracket 35-45 to take a year off and do a course in business studies, industrial engineering or other such management oriented discipline. He would then be on the market for management or entrepreneurial talent, possibly with some capital. He should keep his pension rights with his ex-employer in full. This possibly requires legislation.
In the case of the agriculturalists, there is the potential for developing an expanding market for agricultural scientific talent, combined with management ability, in the management of farm business systems.
Starting modestly, it should be possible to re-train say 50 per annum mature specialists from each of these two disciplines at cost to the state not exceeding £300,000. This seems a relatively cheap way of introducing some dynamics into the agricultural and engineering scene.
We leave aside the medicals, as they are not really within the scope of this study. In the case of the natural scientists, it is necessary to adopt a different approach. There exists a belief that there are direct, cause-effect relationships between science, technology and industry. No such direct relationships exist a priori: they have to be generated. The science graduate, as such, is of little use to industry in Ireland at this point in time.
The science graduate is, however, of great potential use, both in management and in industrial technology, because of his quantitative grasp of the complexities of interacting systems. This potential can be taken up by a re-orientation procedure. It is in the interest of those responsible for the survival and development of Irish industry to finance this re-orientation.
It is necessary to provide re-orientation for about 300 science graduates per annum. This would cost, if an adequate grant scheme were provided, a further £300,000 per annum in
maintenance.
The type of re-orientation course which would attract them, and produce an employable output, would be in the form of an M.Sc, oriented towards a particular area of technology, with a strong scientific base.
Suitable labels for a 'scientific technology M.Sc.' might be: food, marine, environmental, transportation, petro-chemical etc.
Existing masters-degree courses in dairy science, computer science, industrial engineering, operational research and statistics etc. are pointers.
TABLE XIII (2)
GRADUATE OUTPUT, TAKE-UP AND EMIGRATION Run (c)
Year Quantity Agricultural Engineers Medicals Natural
Scientists Scientists
1967 Annual Output
172 240 283 3781971
1975
1979
4-year cumulative
output
Take-up
Surplus
Annual Output
4-year cumulative
Output
Take-up
Surplus
Annual Output
4-year cumulative
output
Take-up
Surplus
Annual Output
761 525 236 202
893 161 732 237
1048
128 920 278
1084
888 196 291
1313
662 651 352
1590
455
1135
427
1198
840 358 310
1311
166
1145
339
1435
365
1070
371
1697
814 883 454
2036
500
1536
544
2444
475
1969
653
[image:31.472.45.434.51.376.2]TABLE XIV (1) Run (d)
PROJECTED GRADUATE STOCK AT WORK, ASSUMING 5.3 PERCENTAGE POINTS REDUCTION IN GROWTH-RATE OF VOLUME OF OUTPUT
Sector
1975 1979
Projection This Projection Projection This Projection
1
2
3
4
5
6
7
8
9
10
11
12
13
14
15
16
17
18
19
20
21
22
23
25
2000631
1309278
162
4258491
45
2612 1735175
258
1654126
134
95
121
122421
92
143
830
121
1044 1459445
915
195
113
2900350
32
1843 125£123
180
111387
93
66
85
897
14
54
99
588
89
1105 2065733
1429304
172
4577617
50
2936 2055188
279
1676134
145
101
132
138522
99
153
1080137
1261 1133374
725
155
86
2263329
26
1513 108895
141
808
67
73
51
67
761
11
50
77
582
69
1287T O T A L 19571 14114 21732 11831
[image:32.472.34.434.78.460.2]TABLE XIV (2) Run (d)
GRADUATE OUTPUT, TAKE-UP AND EMIGRATION (Projection (d))
Year Quantity Agricultural Engineers Medicals Natural Scientists Scientists
1967 Annual Output 172 240 283 378
1971
1975
1979
4-year cumulative output
Take-up Surplus Annual Output
4-year cumulative output
Take-up Surplus Annual Output
4-year cumulative output
Take-up Surplus Annual Output
761 525 236 202
893 - 4 9 0 * 1383
237
1048 - 2 6 4 * 1312
278
1084 888 196 291
1313 - 7 4 3 * 2056
352
1590 -365* 1955
427
1198 840 358 310
1313 -1025*
2336 334
1435 - 3 9 3 * 1827
371
1697 814 883 454
2036 - 8 7 * 2123
544
2444 6* 2438
653
i
This implies that in a declining growth situation the market contracts, throwing people out of jobs, as well as blocking intake.
[image:33.471.59.445.64.386.2]TABLE XV
GRADUATE TAKE-UP AND EMIGRATION IN THE VARIOUS
PROJECTIONS, PERIOD 1971-1975, 1975-1979 (SUMMARY OF
TABLES XII- XIV)
Period
Discipline
4-year cumulative
output
Ag
893
1971-1975
Eng Med
1313
1311
NS
2036
Ag
1048
1975-1979
Eng Med
1590 1435
NS
2444
Projection (a) 5.3% background growth per annum
Take-up 561 997 834 851 699 1242 1097 1045
Surplus 332 316 477 1185 349 348 338 1399
Projection (b) 2.6% background growth per annum
Take-up 17 238 22 372 120 395 320 442
Surplus 876 1075 1289 1664 928 1195 1115 2002
Projection (c) expanded growth in 'R & D Sector' relative to (b)
Take-up 161 662 166 550 128 455 365 475
Surplus 732 651 1145 1536 920 1135 1070 1969
Projection (d) 'zero growth' situation
Take-up -490 -734 -1025 -87 -264 -365 -393 6
Surplus 1383 2056 2336 2123 1312 1955 1827 2438
N.B. All growth refer to 'background'; the 'top seven' industries have growth which are
treated separately as regards differential from the background.
However, there is more to this than 'course work'. The existing academic staff is not adapted to cope with industrial-oriented M.Sc. work, especially if practical project work is involved.
It will be necessary to encourage the development, among the academic staff, of the type of industrial consultancy expertise which would enable them to supervise the M.Sc. project work, and ensure that it fulfils a genuine need on the part of the industrial sponsor.
A positive role can be played in this development by the 'industrial liaison officers'; these posts, financed by the NSC, occupy key 'triple points' between those colleges which have taken them up, the Applied Research Institutes and industry.
To fix ideas, a typical one-year industrial sponsored project in the field of operations research and statistics involves financial support of about £2,000, takes up 50 per cent of the time of three students, and about one-fifth of a man-year of staff consultancy time. The latter is crucial to the industrial success of the project.
To provide effective practical projects for such re-orientation, it would be necessary to look for industrial sponsorship money for 100 such projects per year (assuming an average of three students per group-project). This amounts to a further £200,000. It would also involve 100 university staff members one day per v/eek in consultancy/supervision work.
In 1972/73 the Institute for Industrial Research and Standards received fees for research work of £293,000. Thus we are talking of nearly doubling the money spent by Irish industry on contract or sponsored research. This is perhaps not realistic, especially as the academic staff concerned are somewhat inexperienced in their approach to industry in the majority of cases.
A better method of approach would be for the State (through the IDA or directly) to provide an earmarked subsidy to the IIRS, AFT, Foras Forbartha etc., equivalent to what they draw from the sponsored research market, and for the state applied-research body to handle the injection of project problems into the third-level system. These would be related to current work, but more long-term, possibly involving the development of a new technology ultimately to replace, or improve, the short-term solution being worked on currently by the applied research body staff.
The outcome of these sponsored group projects should ideally be the injection of one of the students concerned into the state research body (with the new developing technology) and the other two into industry, including the firm most closely related to the sponsorship.
It might be necessary to ease this process with a wage-subsidy for a year or two. Thus the 'graduate surplus' problem appears to be soluble for less than £lmper annum in the short-run. In the long-run, it should disappear in proportion as a dynamic of technological consciousness develops in the business world, based on a web of personal contacts among those engaged in management, research and development who share common scientific experience.
There is another possible road to generating wealth with the graduate surplus. It is complementary to the one outlined above. It consists in generalising the medical experience and consciously orientating the Higher Education System to cater for the 3rd-world market.
This expansion need not be confined to undergraduate level. It could cater for the same type of post-graduate re-orientation demand as is needed on the home market.
If the 300 M.Sc. per year rate were expanded to say 400, we could take 100 graduates from abroad and train them in problem-oriented technology (oriented towards industry, agriculture or services). This process would qualify for UN or other appropriate support, and would bring in foreign exchange. It would also generate more wealth-producing jobs in the Irish 3rd-level education system.
The mutual confidence network derived from this would lead to the generation of a market in export consultancy in the countries from which the guest-students had come. There are precedents for this type of know-how export business: for example Aer Lingus, does maintenance training work in Libya, Algeria and elsewhere.
ACKNOWLEDGEMENTS
We wish to thank the IDA which sponsored the project and provided some of the input data; Professor Gordon Foster of the Department of Statistics, Trinity College, Dublin, for his encouragement, also Rory Alkin and David O'Brien who contributed to a preliminary run of this project in the course of their M.Sc. in Statistics and Operations Research.
We also wish to thank the staffs of the National Science Council, the Higher Education Authority and the Census division of the Central Statistics Office for their assistance in the supply of data.
Finally we wish to thank Mrs. Patricia Fitzpatrick and Miss Denise Jones for their help with the preparation of the typescript.
DISCUSSION
Dr Derek A. Scholefield: We have to thank the authors for their detailed quantitative approach in an
area of investigation which is of great importance but frought with difficulties.
We are a small country, committed to a programme of expansion of higher level education at a time in our history when we are experiencing all the pangs of a minor industrial revolution. We have the processes of growth and contraction occurring simultaneously and, super-imposed upon our own internal development, we have all the pressures of the world-wide economy which is itself being subjected to massive strains. Indeed, we are surrounded by uncertainty and our systems of education, and those being educated, inevitably must share the load.
We have to remember as we pore over the tables of statistics and follow the logic of the arguments presented by the authors that we are not dealing with items of plant, equipment or machinery, but with people, with individuals, each with his or her own life aspirations and not a mere chequer on a board to be moved at will at some late stage in the educational game without an early warning system.
You will gather from these opening words that it is not my intention to attempt any analysis of the statistical approach adopted by the authors, if indeed I felt qualified to do so. Rather do I intend to concentrate by contribution on their discussion and conclusions.
The results of this statistical approach do not really surprise me, neither would I expect them to surprise any of my colleagues who work within the Careers and Appointments Services of the Universities. The authors have generously made reference to the Graduate Placement Report of the Association of Irish University Careers and Appointments Services, the only available documentation on the Further Study or Training or Employment taken up by men and women who have qualified recently for full-time first degrees. Perhaps I could quote from my own Annual Report for the year ending 31st December 1973, in respect of graduates from University College, Dublin.
LK OR FURTHER EMPLOYMENT DY (IRELAND) IN IRELAND
13.0 25.2 52.3 71.0 72.4 85.3
56 FACULTY
Arts Science Agriculture Social Science Commerce Engineering
TEACHER TRAINING
% 68.0 42.9
-13.1 17.8
-RESEARCH' ACADEMIC !
Quite clearly, the Science graduate appears low in the ranks of those undertaking direct employment in Ireland, though by no means as low as the Arts graduate. I have had to extend my view to include the Arts graduate because the authors say in their discussion that the problem is basically one of relative over-production of specialist scientists. Their conclusion may not be so accurate when we look at the whole pattern of third level education and remember the need for the injection into Irish industry and commerce of graduates from a wide range of academic disciplines. Clearly it is highly desirable that there should be a dramatic increase in the level of technological understanding available to Irish industry but we should need to ensure that this reaches the main stream of policy and decision-making. I am not so sure that the availability of a wider range of M.Sc. courses, even based on project work, would necessarily achieve this objective. I have to confess that some of my doubts are compounded by the proposed titles for such courses.
I think the issues involved are much wider than this paper suggests, for nowhere is reference made to the overall pattern of graduate recruitment into Irish industry and commerce and the many practical issues involved. There are problems t