Aspects of labour supply and demand with
special reference to the employment of
women in Ireland*
By BRENDAN M. WALSH (Read before the Society, 7th May 1971)
There has been a resurgence of interest among economists in the theoretical and empirical aspects of labour supply and demand. On the one hand, fluctuations in labour force participation (or activity) rates from year to year or between geographical areas have come to be seen as a very important aspect of the operation of the labour market and hence worthy of intensive statistical study [3, 4, 5]; on the other hand the broader theoretical and philosophical issues regarding the welfare implications of various combinations of time devoted to work, leisure and consumption have been explored in two stimulating theoretical contributions [2, 12]. Additionally, the present widespread interest in the position of woman in society naturally focusses attention on her role in the economy, and creates a demand for information regarding the relevance of sex as a variable in studies of the labour market. The present study is intended to provide some information on these topics in an Irish context. The coverage is selective, due to limitations of time, space and data.
THE DEMAND FOR FEMALE LABOUR
It has often been remarked that the overall participation rate of the female population in the labour force is low in Ireland [16]. This is generally taken as a reflection of the very small proportion of married women recorded as "gainfully occupied", combined with the importance of family farming in the total employment structure. In addition to these forces, an endemically high unemployment rate would be expected to discourage women from entering the labour market. It is also possible that negative attitudes and institutional factors have held down female participation rates.
It is natural to inquire whether these aspects of female labour supply have affected the sex-ratio of employment in Ireland. It is relevant to point out that although occupations are generally fairly specifically sex-labelled (an employment opportunity for a typist is almost equivalent to an employ-ment opportunity for a woman), occupations are not generally reserved for married women, so that low participation rates among married women
89
could be offset by a high proportion of unmarried women in the popula-tion—a phenomenon for which Ireland was, until recently, renowned. Additionally, it is possible that the country's structure of employment opportunities is biased towards males, so that the low labour force participation of women might be a consequence of the industrial structure rather than an independent variable.
A crude comparison with the United Kingdom (1965) reveals that 35*7 per cent of its labour force was female, compared with only 25-9 per cent in Ireland. If however, as in Table 1, this comparison is extended and refined, the Irish case no longer appears exceptional, lying as it does mid-way between the British and Dutch. The contrast between Ireland and the U.K. in the overall picture is largely due to the importance of "family workers" in Ireland and the low proportion of females among Irish family farm workers (11 per cent, as compared with 46 in U.K., 33 in Holland). Obviously, Census classification procedures must have a great impact on this figure and hence international comparisons are largely meaningless.1 Examination of the columns of Table 1 relating to the non-family labour force does not suggest that Ireland's low participation rate for married women has led to a noticeable distortion of the sex ratio of employment. As will be discussed below, there is also no evidence that an overall shortage of female workers has led to an unusually male-orientated industrial structure.
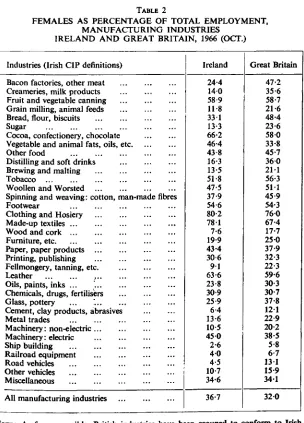
Looking more closely at the structure of Irish manufacturing industry from the viewpoint of the demand for female labour a detailed comparison with Britain can be made with the data in Table 2. (The choice of Britain is determined by data availability, etc. rather than because its position is considered normal; m is clear from Table 1, the U.K. is significantly different from Holland in these matters.) There is generally a very close concordance between Ireland and Britain, industry by industry, with regard to the sex ratio of employment (the correlation coefficient between the two columns of Table 2 is +0-93). Difficulties of grouping or definition largely account for the obvious discrepancies (e.g. glass and pottery).
1 There were 1101 thousand married male farmers in Ireland in 1966, but only 2-3
TABLE 1
FEMALES AS PERCENTAGE OF TOTAL EMPLOYMENT IN THREE EMPLOYMENT STATUSES AND TEN OCCUPATIONAL GROUPS, IRELAND (1966), UNITED KINGDOM (1966) AND THE NETHERLANDS (1960)
Occupation
Professional technical etc. Administrative, executive, managerial Clerical workers Sales workers Farmers, fishermen, hunters
Miners, quarrymen, etc. Transport and
Com-munications workers Craftsmen, Production
process workers n.e.s. Service, sports,
recrea-tion workers Total (incl. armed forces
and those not classified by occupation)
Employers and Workers on Own A/C
Ireland 191 — — 28-2 11-4 11 6 0 50-3 14-2 U.K. 181 — 34-1 101 3-2 9-8 39-8 22-4 Nether-lands 24-5 — — 110 2-4 __ 0-6 5 1 22-9 7-8 Salaried Employers and Wage Earners
Ireland 53-3 5-7 61-8 381 11 0-3 5-2 191 69-4 32-7 U.K. 396 7-5 66-8 50-5 10-3 0-7 11-2 20-4 73*7 36-2 Nether-lands 408 3-9 35-6 46-5 2-7 0-3 5-3 9*7 69-4 23-6 Family Workers Ireland — — 45-3 111 — 6 0 13-6 U.K. — — 86-1 45-7 — _ 340 74-3 Nether-lands — 80-9 32-7 — — 9 1 47-5 Total (including unemployed) Ireland 50-6 5-7 61-9 35-3 9-5 0-2 4*7 17-3 681 25-9 U.K. 38-3 7-5 67-3 48-3 12-1 0 1 110 201 710 35-7 Nether-lands 39-2 4 1 35-8 370 8-7 0-3 5-8 9-3 64-7 22-3 * .
**—"indicates category in which total numbers employed are trivial in relation to total employment.
91
TABLE 2
FEMALES AS PERCENTAGE OF TOTAL EMPLOYMENT, MANUFACTURING INDUSTRIES
IRELAND AND GREAT BRITAIN, 1966 (OCT.)
Industries (Irish CIP definitions) Bacon factories, other meat Creameries, milk products Fruit and vegetable canning Grain milling, animal feeds Bread, flour, biscuits Sugar
Cocoa, confectionery, chocolate Vegetable and animal fats, oils, etc Other food
Distilling and soft drinks Brewing and malting Tobacco
Woollen and Worsted
Spinning and weaving: cotton, man-made fibres Footwear
Clothing and Hosiery Made-up textiles ... Wood and cork Furniture, etc Paper, paper products Printing, publishing Fellmongery, tanning, etc. Leather
Oils, paints, inks ... Chemicals, drugs, fertilisers Glass, pottery
Cement, clay products, abrasives Metal trades
Machinery: non-electric Machinery: electric Shipbuilding Railroad equipment Road vehicles Other vehicles Miscellaneous
All manufacturing industries
Ireland 24-4 140 58-9 11 8 331 13-3 66-2 46-4 43-8 16-3 13-5 51-8 47-5 37-9 54-6 80-2 781 7-6 19-9 43-4 30-6 9 1 63-6 23-8 30-9 25-9 6-4 13-6 10-5 45 0 2-6 4 0 4-5 10-7 34-6
36-7
Great Britain 47-2 35-6 58-7 21-6 48-4 23-6 58 0 33-8 45-7 360 211 56-3 511 45-9 54-3 760 67-4 17-7 25 0 37-9 32-3 22-3 59-6 30-3 30-7 37-8 121 22-9 20-2 38-5 5-8 6-7 131 15-9 341
320
NOTE: AS far as possible, British industries have been grouped to conform to Irish single or grouped industry categories.
SOURCES: Ireland, Annual Census of Industrial Production, 1966. Britain, Ministry of Labour Gazette, Dec. 1967, pp. 978-9.
The orthogonal regression of the two sets of data in Table 2 is
92
An industry-mix-standardized sex ratio can be calculated for Irish manufacturing industry by expressing the number of female employees in Britain expected on the basis of the Irish sex ratio by industry as a pro-portion of total actual G.B. employment, i.e.
n
2 fJRL EGB Standardized rate = i=1 x 100
n
L E|GB i = l
where fi=females as % of total employment in the itb industry Ei=total employment in ith industry
IRL, GB superscripts to Ireland and Great Britain
This standardized rate is 27*5 per cent, over a quarter lower than the crude rate of 36-7, showing that Ireland's manufacturing industrial structure is fairly heavily biased towards industries with a high sex ratio. This reflects the absence of large-scale heavy engineering and the con-sequent prominance of textile, clothing and food industries.
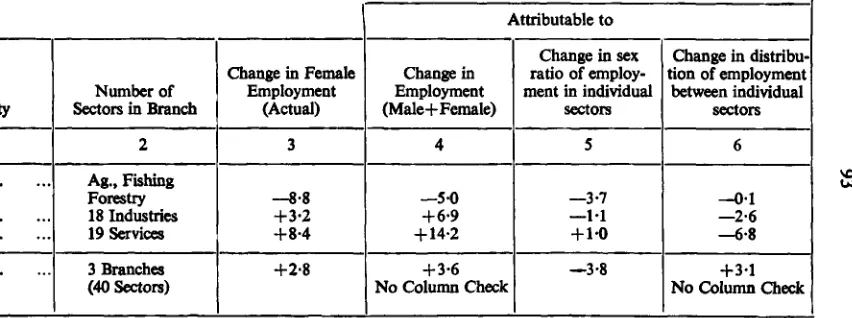
A related topic is the impact of the growth and changing composition of the Irish economy on the sex ratio of employment opportunities. A detailed comparison of 1961 and 1966 Census of Population data sheds some light on this question.2 Between 1961 and 1966, the number of
females at work recorded in the Census rose from 278-0 to 280-8 thousand. In order to examine in detail the forces that led to this overall change, the total may be broken down into the following components:
a. Change due to growth (or decline) df total employment (assuming no change in sex ratio).
b. Change due to changing distribution of employment between sectors (assuming the sex ratio of each sector's employment remains constant). c. Change due to the rise or fall of the sex ratios of employment in
individual sectors.3
These components of change are shown in detail in Table 3, both for the economy as a whole and for the three major branches (industry, agriculture, services).
1 The use of Census of Population to study the sex ratio of employment is subject to
some reservations, as is discussed in an Appendix to this Paper.
1 Let F1, F°=females at work in 1966, 1961 respectively.
n
F1=ZFj i =sectors of the economy
i » 1 n=number of sectors in group
E\ E°=total (male plus female) at work, 1966, 1961,
then W-F*
TABLE 3
CHANGE IN FEMALE EMPLOYMENT, 1961-66, ANALYSED BY CAUSE; CENSUS OF POPULATION DATA (THOUSANDS)
Branch of Economic Activity
1
Agricultural
Manufacturing Industry Commercial, Service Total Employment
Number of Sectors in Branch
2
Ag., Fishing Forestry 18 Industries 19 Services 3 Branches (40 Sectors)
Change in Female Employment
(Actual)
3
—8-8
+3-2 +8-4 +2-8
Attributable to
Change in Employment (Male+Female)
4
—5-0 +6-9 + 14-2
+ 3 - 6 N o Column Check
Change in sex ratio of employ-ment in individual
sectors
5
—3-7 — M + 10
—3-8
Change in distribu-tion of employment between individual
sectors
6
^ 0 1 —2-6 —6-8
+3-1 No Column Check
DATA SOURCE: Census of Population, 1966 Vol. m , Table 3. Along each Row, Col. 3=Col. 4 + C o l . 5+Col. 6.
94
It is evident that the single most important factor in the increase in female employment between the two dates was the rise in total employment in "commerce, services", which on its own would have led to a rise of 14*2 thousand in female employment. However, within this branch of the economy, a substantial decline in domestic service employment partially offset the expansion in female employment that would otherwise have occurred. It is also noteworthy that the female-intensity of the structure of manufacturing industry as a whole declined, as well as which there was on balance a decline in the proportion female in the individual industries. Of course the continuing decline in the importance of agriculture as a source of employment was sufficient to ensure that the national employ-ment structure became more female-intensive.
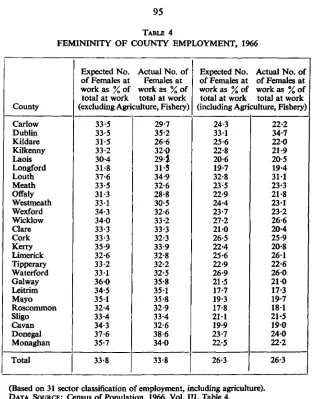
A final aspect of the demand for female labour can be illustrated by examining county employment patterns in 1966. Suppose the sex ratio of employment found nationally in each sector of the economy obtained also in each county, what would be the proportions of females in each county's labour force? This hypothetical sex ratio may be used as an index of the female-intensity (or femininity) of the county's employment structure. Using a similar notation to that developed above,
2 fj Ey i=seetors, (n) industry-mix variable, = i = l j = counties, (k)
k k
fi= 2 Fij/ Z Eij, (national % F in ith industry) j l j l
95
TABLE 4
FEMININITY OF COUNTY EMPLOYMENT, 1966
County Carlow Dublin Kildare Kilkenny Laois Longford Louth Meath Offaly Westmeath Wexford Wicklow Clare Cork Kerry Limerick Tipperary Waterford Galway Leitrim Mayo Roscommon Sligo Cavan Donegal Monaghan Total Expected No. of Females at work as % of total at work
Actual No. of Females at work as % of
total at work (excluding Agriculture, Fishery)
33-5 33-5 31-5 33-2 30-4 31-8 37-6 33-5 31-3 331 34-3 340 33-3 33-3 35-9 32-6 33-2 331 360 34-5 351 32-4 33-4 34-3 37-6 35-7 33-8 29-7 35-2 26-6 320 29-| 31-5 34-9 32-6 28-8 30-5 32-6 33-2 33-3 32-3 33-9 32-8 32-2 32-5 35-8 35-1 35-8 32-9 33-4 32-6 38-6 340 33-8 Expected No. of Females at work as % of total at work
Actual No. of of Females at work as % of total at work (including Agriculture, Fishery)
24-3 33-1 25-6 22-8 20-6 19-7 32-8 23-5 22-9 24-4 23-7 27-2 21 0 26-5 22-4 25-6 22-9 26-9 21-5 17-7 19-3 17-8 211 19-9 23-7 22-5 26-3 22-2 34-7 220 21-9 20-5 19-4 311 23-3 21-8 23-1 23-2 26-6 20-4 25-9 20-8 26-1 22-6 260 210 17-3 19-7 181 21-5 190 240 22-2 26-3
(Based on 31 sector classification of employment, including agriculture). DATA SOURCE: Census of Population, 1966, Vol. Ill, Table 4.
96
TABLE 5
MEASURES OF SEX SEGREGATION OF EMPLOYMENT: IRELAND, 1966
Females as Percentage of Total Gainfully
Occupied in Occupations
90% and over 70% and over 50% and over
Males as Percentage of Total Gainfully Occupied in Occupations
90% and over 70% and over 50% and over
Females in those occupations as Percentage of All Females Gainfully
Occupied 25-2 42-9 75-2
Males in these occupations as Percentage of All Males Gainfully Occupied
791 84-8 88-9
Total (Male and Female) in these occupations as percentages of total
Gainfully occupied 6-7 12-8 27-7 Total (Male and Female) in these occupations as Percentage of Total Gainfully Occupied
62-2 67-4 72-4
DATA SOURCE: Census of Population, 1966, Vol. IV, Table 3.
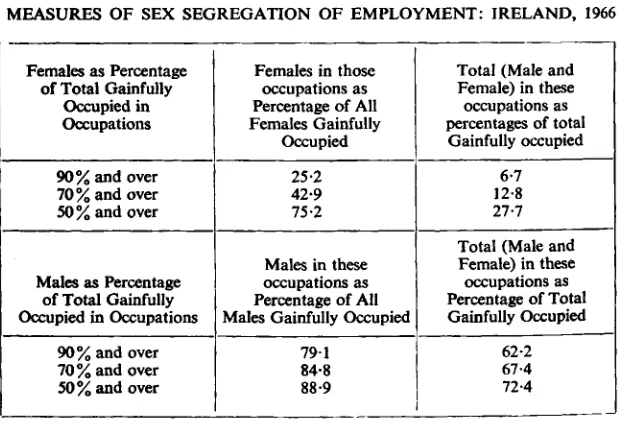
The contrast between columns 2 and 3 in Table 5 is greater for females than for males, since females form a smaller proportion of the total labour force. The data for males and females are really alternative ways of describing the same phenomenon. It is beyond the scope of the present study to inquire whether such occupational segregation is rational, whether females really tend to have a comparative advantage in the traditionally female occupations and if so whether this reflects innate or acquired characteristics. One interesting point that is related to this question may be illustrated by considering the occupation "Clerk" (which is, of course, separate from "Typist" in the Census occupational classifica-tion). This might be called an epicene occupation, since males and females are found in it with almost equal frequency in the aggregate (34 thousand males, 38 thousand females in 1966). However, for example, only 31 per cent of the Clerks in the Dairying Industry were female, compared with 75 per cent in the Outer Clothing Industry (Census of Population, Vol. HI, Table 8). In fact, if we regress female clerks as a percentage of all clerks in the i*h industry (Y|) on females in "non-clerk" occupations as a percentage of all "non-clerks" in the i*h industry (xi), for the 65 manu-facturing industries of the Census tables, the following result is obtained (f=ratio in parentheses):
Y=36-38+0-58X R2=0-64 (10-59)
97
rise in the sex-ratio of "clerk" employment.4 No doubt the nature of the work performed by "clerks" in various industries varies, being more attractive to females in industries where total employment is predominantly female, but nonetheless this result does suggest a highly important non-economic factor at work in determining the sex ratio of employment. At the risk of exaggerating the importance of this finding it may be pointed out that if the lowest sex ratio for the occupation "clerk" (22-8 in Turf Production) applied in all industries the number of female clerks employed in industry would fall from its level of 7*6 thousand to 3*3 thousand.
FACTORS AFFECTING SUPPLY
The major determinants of labour supply in the long run are demo-graphic in nature. Migration, both internal and external, is an important adjustment mechanism between labour supply and demand in a given area.5 The sex ratio of the migrant stream varies considerably between the different Irish counties, and those variations are probably partly due to economic and partly to social (especially, marriage-related) factors [17]. The very much lower labour force participation rates for married as compared with either single or widowed females implies that changes in the proportion of females in a given age group that is married will have a major impact on the supply of female workers. This source of change in the sex ratio of the labour supply is obviously very important in Ireland today, as the marriage rate climbs from the very low level that prevailed until the second world war. Finally, of course, changes in social and economic circumstances may produce fairly dramatic shifts in participa-tion rates: a notable feature of many countries' post war experience has been the strong rise in married women's labour force participation [3,6], a trend that may seem paradoxical in view of the simultaneous increase in average family income and the presumably declining marginal utility of income (or, conversely, rising marginal utility of leisure). These wider issues underlying the changing pattern of labour supply by women in industrial countries have been raised by writers such as Galbraith, Linder and Mishan [7, 12, 14], and apart from this passing reference we shall not explore this area.
Alternative attempts to measure the sex ratio of the labour supply in Ireland, 1961-1966, are presented in Table 6. By all the measures shown here, the relative scarcity of women available for work has risen between these two dates. The major part of this increased scarcity of females is of course attributable to the continuing rise in marriage rates. A secondary influence has been the decline in agricultural employment which, as far as
4 The data on which this is based are not reproduced here, but may be obtained on
request from the author. It is possible that both X and Y are jointly influenced by a third variable (e.g. the supply of females on a regional basis), but this is not very likely in the Irish case.
the measured labour force is concerned, "releases" far more males than females for non-agricultural employment. These forces acting on the supply side, combined with the relatively stable sex-ratio of the demand for labour, (as far as these demand factors have been isolated in Table 3), are sufficient to account for the general impression of a scarcity of females available for non-agricultural work in Ireland in recent years.
TABLE 6
CHANGES IN SEX RATIO OF LABOUR "SUPPLY", 1961-1966
(1) Total Population Aged 14 and over (2) Total Aged 15-64 (3)-(2) excluding
married females (4)=(3) excluding those
in agricultural occupations (5)=(4) excluding those
at school, etc. ...
Numbers ('000) Females
1961
1,001 1 807-6 385-4
360-2 321-8
1966
1,0210 820-9 381-2
361-2 312-5
Males 1961
997-5 818-5 818-5
524-6 483-3
1966
1,017-9 839-7 839-7
579-4 526-3
Females per 1 000
Males 1961
1,004 987 471
687 666
1966
1,003 978 454
623 594
DATA SOURCE: Census of Population, 1961 and 1966, Vol. V, Tables 2 and 5.
Some quantification of the impact of rising marriage rates on female labour supply is attempted in Chart I, which contrasts the 1946 and 1961 situations.6 By "projected" experience is meant the outcome that would be expected on the basis of the 1946-51 and 1961-66 emigration, marriage and death rates. The decline in the years spent as "unmarried, not gainfully occupied" between the two periods is dramatic. Of course, the rising marriage rate has been partly offset by a falling emigration rate, so that the total of woman years spent "gainfully occupied" (per 1,000 women) has not altered very much. However, since the male labour supply has been increased due to falling emigration, and is virtually unaffected by the rising marriage rate, the sex ratio of the labour supply has obviously been dramatically reduced by these developments.
C H A R T I
PROJECTED FUTURE EXPERIENCE OF UOOO WOMEN AGED 14 IN 1961 ON BASIS OF MIGRATION, M A R R I A G E A N D PARTICIPATION RATES I96I-6C. JOOO
a 00
6 0 0
4 0 0
2 0 0
AGE* l 4 ( 7 ( 9 22 24 27 29 32 34 37 39 42 4 4
(G.O.-Gainfully Occupied)
PROJECTED FUTURE EXPERIENCE OF ipOO WOMEN AGED 14 IN 1946 ON BASIS OF 1946-51 MIGRATION MARRIAGE AND PARTICIPATION RATES* IOOOn
8OO
• O O
iiii
//UNMARRIED 'A 2? NOT G.O. VB
km
m
NET EMIGRATION
B l m MARRIED .NOT G.O.
^ D E A T H S
¥///////$< "
•-H|tt
37 19 42 44 (G GtttnfeilyOcciipJa*)
100
On a regional basis, the measurement of the sex ratio of labour supply is less meaningful than it is over time, since the sex ratio of a country's adult population is strongly influenced by the sex ratio of its employment opportunities. Migration of men and women to areas where they can find suitable jobs is overwhelmingly more likely, in Ireland at least, than that the locational patterns of industries is strongly influenced by regional variations in the sex ratio of the labour supply. Table 7 displays one measure of the sex ratio of the counties' non-agricultural labour supplies. A significant positive correlation exists between this variable and the industry-mix (excluding agriculture) variable of Table 4 (r=0*63); this correlation is not tautological since the county values in Table 4 (Column 1) were calculated from the expected, rather than actual, sex ratio of county employment opportunities. In as much as this correlation may have a causal basis, it is reasonable to assume that the sex ratio of the net emigration stream is influenced by the sex ratio of local employment opportunities. The relative abundance of females (according to the present rather specialized definition) in Mayo orLeitrim,and the scarcity in Dublin, is easily understood in the light of the female-intensiveness of the various service-type activities that, as Baker noted [1, p. 20], tend to predominate in the non-agricultural employment structure of the poorer counties.
TABLE 7
SEX RATIO OF REGIONAL LABOUR "SUPPLY": UNMARRIED FEMALES AGED 15-64 PER 1,000 MALES AGED 15-64, EXCLUDING
THOSE OCCUPIED IN AGRICULTURAL OCCUPATIONS, 1966
Carlow Dublin Kildare Kilkenny Laois Longford Louth Meath Offaly Westmeath Wexford Wicklow
606 569 493 655 603 690 817 491 551 606 691 589
Clare Cork Kerry Limerick Tipperary Waterford Galway Leitrim Mayo Roscommon Sligo
676 608 693 617 643 595 750 817 827 759 718
Cavan Donegal Monaghan Ireland
111 161 709 623
DATA SOURCE: Census of Population, 1966, Vol. V, Tables 3, 5.
NOTE: There is some inaccuracy on the county level, since occupational data by age and marital status are unavailable; hence some 2,000 married women aged 15-64 gainfully occupied in agricultural occupations cannot be exactly allocated by county.
101
major influence on short-run fluctuations in labour supply in the post-war experience of the United States [5]. The notion that the "secondary labour force" is not recorded in official employment statistics in periods of high general unemployment has been termed the "discouraged worker" hypothesis, and has found considerable support from the empirical evidence. The alternative notion—that special population groups are likely to enter the labour force when overall unemployment rates rise ("the additional worker" hypothesis)—has found less support, although it may be relevant to the tendency of low income married women to seek work consequent on their husband's unemployment.
Measuring labour force participation presupposes the availability of very detailed and accurate data on the labour force status of various population groups. In Ireland, the only relevant information is contained in the Census of Population. In an Appendix to this paper the reliability of the employment data contained in the Census of Population is discussed at length, but at this stage it should be noted that for both sexes the Census provides no data on hours worked, and simply classifies the population into "gainfully occupied" or "not gainfully occupied" (with a break-down of the former category between "at work" or "not at work"). Thus the respondents' account of their situation in a week in April is our only firm information on labour force participation.7 The Census emphasis on "principal occupation", and the absence of data on hours worked, is far more likely to affect the data on female (especially married female) participation rates than male rates.
Our only solid evidence on the behaviour of Irish participation rates over time is derived from inter-censal comparisons. The 1961-66 experience is summarized in Table 8, which is a completion of Table 17 in Walsh [16]. The strong rise in participation among single females is notable, indicating that a substantial labour pool outside the measured labour force existed in this population group in 1961. This pool of not gainfully occupied women and girls was sufficient to allow for a rise in labour force participa-tion rates as well as a rise in school (post primary )participaparticipa-tion. The fall in labour force participation among young males no doubt reflects the rise in post-primary school attendance. The declines in participation in the older age groups are probably due to the fall in agricultural employment. In order to gain more insight into the determinants of participation in the Irish context it is necessary to concentrate on cross section analysis.8 For males, only four age groups have been analysed: 14-19, 20-24, 55-64, and 65 and over: participation rates for males aged between 24 and 55
7 It should, however, be pointed out that the Current Population Survey data that
have formed the basis of the major U.S. time series studies have recently been criticised as too flimsy a basis to support the elaborate statistical tests that have been performed [16].
102
TABLE 8
CHANGES IN NUMBERS GAINFULLY OCCUPIED, 1961-66, ATTRIBUTABLE TO CHANGES IN AGE- AND MARITAL-STATUS
SPECIFIC PARTICIPATION RATES (THOUSANDS)
Age
14-24 25-64 65 and over All ages
Males Single
-4-775 + 1-582 -0-735 -3-928
Married - 0 0 1 5 +0-556 -3-763 -3-222
Widowed 0 +0032 -1-479 -1-447
Females Single
+ 2 020 +6-214
0 + 8-234
Married +0-222 +0056 - 0 0 4 2 +0-236
Widowed - 0 0 1 3 -1-394 -3-204 -4-701
Both Sexes Total -2-561 +7046 -9-313 -4-828
DATA SOURCE: Census of Population, 1961 and 1966, Vol V.
NOTE: The underlying calculations have been performed for each of the eleven age groups distinguished in the Census.
The total change in the number gainfully occupied, 1961-66, may be decomposed into the following categories:
due to increase in population =+22-3 due to change in population structure = —7-4 due to changes in participation rates = —4-8 Total change in number gainfully occupied = + 101 Cf. Walsh, [16], pp. 34 ff.
are very stable, and whatever variations do occur are most probably a reflection of the importance of institutions (hospitals and jails, for example) in an area. For males, no distinction is made between the marital statuses, since there is generally only a small variation between married and unmarried males in regard to labour force participation.9
For females, all seven age groups distinguished in the census have been studied. In order to take account of the impact of the varying proportions married in the different counties, a "marital status standardized" participa-tion rate has been constructed for each female age group. This rate is obtained by applying national age and marital status specific participation rates to the county population, thereby obtaining an expected number gainfully occupied. The actual/expected ratio is then multiplied by the national age-specific participation rate to yield the standardized rate. The crude and standardized rates for females and crude rates for males are displayed in Table 9. The standardization procedure somewhat reduces the inter-county variation in participation rates among females. For example, some counties have high crude rates in the younger age groups due to the presence of a high proportion of unmarried females. The use of standardized rates of this type is clearly a second best choice: it would be
103
far more interesting to study separate rates for each marital status in each age group, but the census tables do not provide the necessary data, and, in any event, the actual numbers in many cells would be extremely small. The use of standardized rates implies that we are unable to test hypotheses relevant only to one material status (e.g. the effect of average family size on labour force entry by married women) and this is a serious limitation of the results presented here.
It would also be desirable to have county data on (female) wages, in order to test the impact of the wage rates on labour supply (as reflected in participation rates), but there are no such data for Ireland. Consequently the regressions performed with the participation rate as dependent variable concentrated on the following as explanatory variables:
Variable
Whether Age Expected Sign for Specific Coefficient Female Unemployment Rate10
Male Unemployment Rate
Males, Females, G.O. in Ag. as % of Total Males, Females G.O.
Industry mix \ incl. Ag. Variable (expected % F) /excl. Ag. Supply of females/males
Male Net Emigration Rate, 1961-66 Female Net Emigration, Rate, 1961-66
No No
Yes No
No
Negative (for females only)
Negative for males, Positive for females Varies with age Negative for males Positive for females Negative (for females
only)
No (15-64) Negative (for males only)
No (15-64) Negative for females only)
The unemployment and net emigration rates test the discouraged worker hypothesis for the participation rates of the same sex; the inclusion of the male unemployment in the female regression tests the additional worker hypothesis. The county's employment structure is expected to influence participation, and this influence can be specified in two manners: either by including the percentage G.O. in agriculture along with the industry-mix (excl. agriculture) variable, or by using the industry-industry-mix (incl. agriculture) variable on its own. The former emphasizes the classification bias introduced by the farm situation, the latter stresses the availability of suitable employment opportunities for the sex in question: presumably, for example, if a county is heavily endowed with female intensive industries, the search for a suitable job will be easier for a woman (other things, especially the unemployment rate, being equal). The supply variable (F/M) would be expected to measure a similar influence from the other side of the market: given the industrial structure, any one woman's chances
104
of obtaining a suitable job should vary inversely with the relative abundance of women in the labour supply.
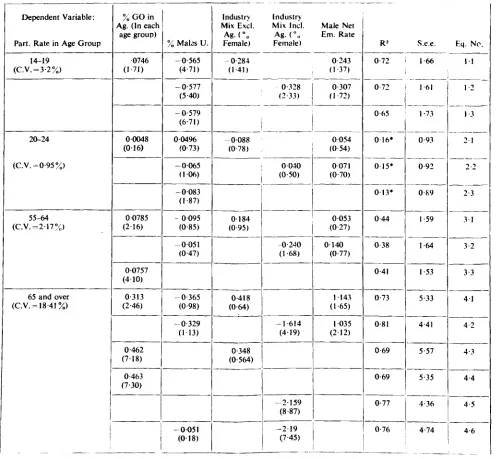
The results for male participation rates may be presented briefly. Table 10 records some of the more interesting estimated equations. In these results, as well as for females, the population "at school, students" has been excluded from the denominator in all age groups where this is relevant (chiefly, the two youngest). It is clear that there is very little variation to account for in the 20-24 age group, and the low R2 is not surprising here. In all cases the unemployment rate has the expected negative coefficient: in the first age group this coefficient is highly signifi-cant, and this variable is obviously the most important influence on participation—a significant number of school leavers, presumably, being "not yet at work" in areas where unemployment is high. The net emigra-tion rate does not help significantly in these equaemigra-tions. The "industry-mix (incl. Ag.)" variable generally performs better than the combination of " % G.O. in Ag." and "industry-mix" (excl. Ag.)". This interesting finding is clearest in the case of the oldest age group, where the male participation rises strongly in counties with a male intensive employment base—perhaps reflecting both the tendency for old farmers to remain in the labour force, and the fact that if the employment structure is male orientated it is easier for men to get jobs after retirement from their normal work. It is somewhat surprising to see that for the 55-64 age group, however, the " % G.O. in Ag." exercises a highly significant influence on participation, although the estimated coefficient is very small.
The inter-county variation in participation (male) is large enough to be regarded as evidence of fairly large reserves of labour supply (as far as the measured labour force is concerned, at least); if the highest county rate (found in Dublin and Kildare, respectively) applied nationally for the 14-19 and 20-24 groups, the national labour force would rise by 2-9 and 0-9 thousands in these age groups respectively. At the older end of the age structure, if Roscommon's rate for males 65 and over applied nationally, the labour force in this age group would jump by 27-9 thousand: this last figure may not, in fact, indicate any large available labour pool, but it does highlight the impact of definitional considerations on our labour force statistics.
TABLE 9
LABOUR FORCE PARTICIPATION RATES, 1966, BY COUNTY, A G E A N D SEX, (Gainfully occupied as Percentage of Population)
County Carlow Dublin Kildare Kilkenny Laois Longford Louth Meath Offaly Westmeath Wexford Wicklow Cork Clare Kerry Limerick ... Tipperary Waterford Galway Leitrim Mayo Roseommon Sligo Cavan Donegal Monaghan Males 14-19* 88 0 91 9
9 0 0
89-5
8 7 1
84-2
8 7 0
90-1
9 0 1
85-4
88-9
89-8
9 0 7
87-6
8 5 1
88-5 86-8 90 I 87-5 84-8 87-7
9 0 0
88-5
88 0
78 0
9 0 8
20-24* 98-4 98-4 98-9 97-8 95-3 98 6 97-4 98-8
9 9 0
96-9
98-3
9 9 0
98 1
97-9
96-8
97-6
9 8 1
98-8 96-7 97-9 97-3 98-4 96-7 98-5 96-4 98-2 55-64 88-6 89 0 90-3 89-2 88-2 92-4
9 0 2
92 1 90-3 87-4 89-3 88-6 88-3 90-6 88-8 88-7 89-7 88-3 91 4 93-5 93-5 94-9 92-2 92-5 91-4 90-6 1 65 and over 49-8 32-8 46 0 50-3 48-9 59-5 37-9 49.9
5 0 5
48-9
43-9
42-3
40-9
53-5
4 5 1
42-3
49-5
4 0 0
65-5 66-4 66-1 67 0 58-5 60 1
5 5 1
57-5 14^19* 72-8 (72-2) 90-2 (90-4) 78-4 (77-2) 74-5 (73-5) 74-3 (73-3) 69-2 (68-8) 90-3 (90-5) 82-5 (82-3) 78-4 (82-3) 741 (73-4) 731 (721) 84 1 (83-6) 82-3 (831) 77-1 (771) 69-9 (701) 81-2 (804) 75-3 (74-9) 84-2 (83 3)
6 9 6 (701) 68-3 (68-8) 63 1 (63-7) 69-3 (69-6) 72-1 (72-6) 71 9 (72-5) 70-7 (710)
8 0 2 (80-6) i Females 20-24* 66-9 (62-4) 74-6 (74-9) 66-6 (59-6) 64-4 (63-2) 63-2 (611) 62-5 (64-7)
7 5 0 (73-6) 69 1 (65-9) 67-9 (63-7) 64-4 (62-2) 61 8 (59 1) 69-5 (64-8) 68 0 (68-2) 67 0 (67-4) 60-9 (63-6) 68-3 (67-4) 64-2 (62-9) 71-4 (65 0) 65-4 (68-9)
6 4 0 (69-3) 63 0 (65-6) 65 2 (69-7) 67-3 (68-9) 63-4 (66-1) 65-4 (68 0) ! 68 0 ! (677) ^marital—status—standardised)-^ 25^34* 25-2 (23-9) 32-5 (32-6) 25-9 (21 5) 25-5 (26-8) 23-6 (23-3) 24-2 (26-2) 331 (321) 26-8 (24-6) 27-2 (23-4) 26-5 (25-9) 24 0 (221)
3 0 0 (27-3) 27-6 (280) 27-6 (28-9) 25-2 (27-6) 28 1 (27-8) 25-3 (24-8) 28-6 (261) 26-7 (29-3) 25 0 (27-4) 25-7 (271)
2 6 0 (27-8) 27-3 (28-9) 27-3 (27-3) 27-4 (303) 27-4 ! (290) 35-M* 161 (15 2) 23 1 (24-7) 15-7 (129) 15-8 (15 2) 13-5 (12-5)
1 4 0 (12-9) 21 9 (230) 18 3 (14-3) 15-5 (13-6) 14-8 (13 9) 15 5 (15-5) 192 (18 1) 17-7 (17 9) 15 4 (14-4) 13 6 (13 3) 16 4 (16 3) 16 3 (148) 17-8 (18 1) 159 (15*2)
1 4 0 (12 5) 151 (13 9) 14-6 (13 4) 15-6 (148) 145 (139) 1 156 (170) 15 1 (15-3) 45-54 17-3 (17-2) 25-9 (280) 17-2 (15-7) 16 7 (160) 151 (151) 17-7 (161) 22-7 (23-5) 17-8 (16-4) 17-7 (17 2) 17-3 (17 2) 16 5 (161) 21 6 (209) 19-2 (19-8) 17 8 (160) 149 (13-5) 18 9 (18 5) 18 3 (181) 191 (20 1) 171 (15 6) 17 6 (15 4)
1 8 0 (161) 17-7 (15 8) 17 3 (16-8) 16 5 (15 1) 16-8 (17-2) 166 (171) 55-64 17-9 (171) 25-5 (26-9) 18 6 (171) 20-5 (20-5)
2 0 0 (19-9) 20-4 (19-8) 21 3 (21-9) 21-3 (20-5) 21-7 (20-8) 19-8 (19-4) 20 1 (20-3) 21 9 (20-7) 20 1 (207) 18 8 17 6) 19 2 (18 4) 20 1 (199) 21 0 (20-5) 18 9 (198) 21 1 (19 8) 21 6 (18-5) 21 9 (20-2) 22-6 (20-7) 22-2 (22-3) 21-7 i (21-2) 18-2 (18 3) 20-9 (21 3) 65 and over 16 2 (16-4) 9-8 (10 3) 15 2 (14 7) 15 1 (151) 18-6 (18-3) 14-4 (13-7) 12 8 (130) 18-5 (18-2) 17-2 (16 7) 15-5 (160)
1 6 2 (16 5) 12-7 (12 5) 11-3 (11-4) 12-8 (120) 11-8 (109) 13 5 (13-5) 15-7 (15 9) 12 8 (13 5) 17-2 (16-2) 164 (14-5) 161 (14-8)
1 7 0 (15 7) 14 1 (139) 15 7 (14-6) 13 2 ! (13 7)
1 16 0 1 (16-3) ^ Crude rates in brackets. *Non-student population in denominator.
DATA SOURCE: Census of Population, 1966, Vol V.
TABLE 10
MALE PARTICIPATION RATES REGRESSION RESULTS
Dependent Variable:
Part. Rate in Age Group 14-19
(C.V. = 3-2%)
20-24
(C.V.=0-95%)
55-64 (C.V.=2-17%)
65 and over (C.V.-18-41%)
% GO in Ag. (In each
age group) •0746 (1-71) 00048 (016) 00785 (2-16) 00757 (410) 0313 (2-46) 0462 (7-18) 0-463 (7-30)
% Mates U. - 0 5 6 5
(4-71) -0-577 (5-40) -0-579 (6-71) 00496 (0-73) - 0 0 6 5 (106) - 0 0 8 3 (1-87) - 0095 (0-85) 0 051 (0-47) -0-365 (0-98) -0-329 (113)
- 0 0 5 1 (018) Industry Mix Excl. Ag.(°o Female) -0-284 (1 41) Industry Mix Incl.
Ag. <°o Female)
0-328 : (2-33)
- 0 0 8 8 (0-78) 0 184 (0-95) 0-418 (0-64) 0-348 (0-564) 0040 (0-50) 0240 (1 68) -1 614 (4-19) 2*159 (8-87) -2 19 (7-45) Male Net Em. Rate 0243 (I 37) 0 307 (I 72) 0054 (054) 0 071 (0-70) 0053 (0-27) 0 140 (0-77) 1 143 (1-65) 1035 (212) R*
0 7 2
0 7 2
0 6 5
0 16*
0 15*
0 13*
0 44
0 3 8
041
0-73
0-81
0 6 9
0-69 0-77 0-76 S.e.e. 1 66 1 61 1-73 0 93
0 9 2
0 8 9
I 59 1-64 1 53 5-33 4-41 5-57 5-35 4-36 4-74 Eg. No. 11 1-2 1 3 2 1 2-2 2-3 3 1 3-2 3-3 4 1 4-2 4-3 4-4 4-5 4-6
105
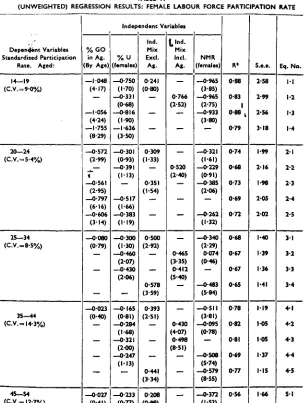
TABLE I I
(UNWEIGHTED) REGRESSION RESULTS: FEMALE LABOUR FORCE PARTICIPATION RATE
Dependent Variables Standardised Participation Rate. Aged: 14—19 (C.V.=90%) 20—24 (CV. = 5-4%)
25—34 (C.V.=8-5%) 35—44 (C.V.»14-3%) 45—54 <C.V.-12*7%) 55—64 (C.V.-7-8%)
65 and over (CV.-I5H>%)
% G O in Ag. (By Age) —1048 (417) — —1056 (4-24) —1-755 (8-29) —0-572 (2-99) i —0-561 (295) —0-797 (6'I6) —0-606 (3* 14) —0080 (0-79) — —0023 (0-40) . — —0027 (0-41) — —0117 (3-92) 0*016 (0-33) 0-098 (S-40) Indep %u (females) —0-750 (1-70) —0-331 (0-68) —0-816 (1-90) — 1-636 (350) —0-301 (093) —0-391 (1-13) — —0-517 (1-66) —0-383 (119) —0-300 (1-30) —0-460 (207) —0-430 (206) — —0165 (0-81) —0-284 (1-68) —0-321 (200) —0-247 (1-13) _ —0-233 (0-77) —0-270 (112) —0-308 (1*35) —0-508 (206) —0-515 (1-99) —0-501 (201) —0-504 (2-34) endent Va Ind. Mix Excl. Ag. 0-241 (0-80) 0-309 (1*33) 0-351 d-54) — 0-500 (2-92) — 0-578 (3-59) 0-393 (2-51) — 0-441 (3-34) 0-208 (0-98) — — —0050 (0-26) Hables Jjnd. Mix Ind. Ag. 0-766 (2-52) 0-520 (2-40) — — 0-465 (335) 0-412 (5-40) ___ 0-430 (407) 0-498 (8-51) — 0-355 (2-35) 0-422 (508) — —0047 (0-30) NMR (females) —0-965 (3-85) —0-965 (2-75) —0-933 (380) —0-321 d-61) —0-229 (0-91) —0-385 (2-06) —0-262 (1-32) —0-340 (229) 0074 (0-46) —0-483 (5-84) —0-511 (381) —0095 (0-78) — —0-508 (5-74) —0-579 (8*55) —0-372 (1-52) —0-938 (0-54) — —
- 0 0 5 0 (0-25) —0045 (025) — R« 0-88 0-83 1
0-88 k
0-79 0-74 0-68 0-73 0-69 0-72 0-68 0-67 0-67 0-65 0-78 0-82 0-81 0-69 0-77 0-56 0-62 — 0 51 0-20 • 0-19* 0-19 0-55 S.e.e. 2-58 2-99 2-56 3-18 1-99 2-16 1*98 205 202 1-40 1-39 i-36 1-41 119 105 105 1-37 1*15 1-66 1-51 — 168 1-59 1-55 1-49 1-53 Eq. No. I I 1-2 1-3 1-4 2-1 2-2 2-3 2-4 2-5 31 3-2 3-3 3-4 4*1 4-2 4-3 4-4 4*5 5 1 5-2 — 5-4 6*1 6-2 6 3 7-1
[image:20.356.11.317.38.441.2]106
group. On the other hand the industry-mix (including agriculture) variable exercises a strong, positive influence in the middle age groups, and a weaker, less significant influence for the very young and the elderly. The unemploy-ment and emigration rates always have the "right" sign, and the emigra-tion rate is significant in many of the younger age group equaemigra-tions. This suggests that the unemployment rate on its own is not sufficiently sensitive as a measure of the tightness of the labour market for females. If, how-ever, the results for the unemployment and emigration rates are considered together, there is ample support for the operation of the discouraged worker hypothesis. In labour markets where there is an excess supply of females, the percentage of the female population that is in the labour force is lower than in areas with a scarcity of women workers. For women aged 25-44 it is also evident that, given the tightness of the labour market, the structure of available employment opportunities (even if agriculture is excluded from consideration) is an important factor in determining labour force entry: in areas with a high female-intensity of employment structure, it may be supposed that women who wish to work will find it easier to get a "suitable" job than is the case in areas of low female-intensity. Obviously, it would be very important to study these effects by marital status, but as mentioned above data limitations prevent this.
The main interest of these regressions is that they reveal a pattern in the county participation rates, and they show some responsiveness on the part of the female labour supply (as measured in Census data) to labour market conditions: over a surprisingly wide age interval, the entry or exit from the labour force does respond to the tightness of the labour market (as reflected in unemployment and emigration rates) and the sex ratio of employment opportunities (even where agriculture is left out of the calculations).
The labour pool availabe among females may be judged at a point in time by applying the highest county rate (marital status standardized) to the national population. These highest rates are found in the following counties (the seven age groups, in ascending order): Louth, Louth, Louth, Dublin, Dublin, Dublin, Laois: and would increase the national labour force by the following numbers (thousands): 7-8, 4-7, 6-0, 7 4 , 9-2, 4-9, 9*2. Ignoring the oldest age group (since high rates here are largely a farm phenomenon) there are some substantial gains apparent, especially in the youngest, and in the 35-44 and 45-54, age groups.
107
substantial rises in participation rates among women [15, Chapter 5]. The evidence of the regression results presented here does suggest that supply wtfl partially adjust to rising relative scarcity, but also underlines the need for policy t o anticipate the scarcity and to attempt to alleviate it either by changing the sex ratio of new employment or by positively encouraging greater participation by women, especially married women, in the labour force. Obviously the extent to which the sex ratio of new employment can be controlled is limited and the main adjustment is likely to come through a rise in participation rates. (Large scale changes in the sex ratio of certain occupations should not be entirely ruled out, but are not likely to have a major impact on the general situation).
An attempt was made to explain the 1961-66 change in participation rates by county. Attention was confined to the two youngest age groups, males and females (the female rates were marital status standardized). The largest increases in participation rates occurred in the following counties:
County Percentage Rise in Rate Males, 14-19 Monaghan 6-4 (non-school)
Males, 20-24 Roscommon 1-9 (non-school)
(Standardized) Females, 14-19 Clare 14-7 (non-school)
(Standardized) Females, 20-24 Roscommon 6-8 (non-school)
The general tendency was for intercounty variation to fall over the period, since the largest rises were concentrated in counties with low rates to start with. In Louth and Dublin, the female rate, 20-24, actually declined between the two dates. O n the whole, the female changes were highly correlated with the change in the importance of agriculture, the simple correlations between the percentage change in participation rates in these two age groups, a n d the percentage change in the proportion of the corresponding labour forces in agriculture were —0*63 and —0-61 respectively. N o significant correlations emerged for males. More elaborate tests, such as the application of the coefficients estimated with 1966 data to "prediction" of the 1961 situation, have not been performed.
TIME SERIES RESULTS
108
equations for the period 1951-69 are presented in Table 12, the data in Appendix 3. Similar equations appeared for an earlier period in [16]. Implicitly this relationship deals with participation rates, since reductions in unemployment are shown to be considerably lower than increases in employment (or emigration). If the intercept of these equations is taken as indicating the growth of unemployment as a result of the natural increase of the non-agricultural labour force in the absence of growth in employ-ment or of emigration, the coefficients of the employemploy-ment and emigration, variables do suggest, for example, that a fair proportion of and increase in employment comes from men and women who were not in the labour force. This suggests considerable short-term sensitivity by the participa-tion rate to changes in the level of unemployment: the measured rise (or fall) in unemployment thus tells only part of the actual change in unemploy-ment, the remainder being hidden in entry to, or exit from, the labour force. This is consistent with our cross-section results, but unfortunately no detailed comparisons of the two sets of findings is feasible due to the very aggregate nature of the time-series data. The choice of dependent variable for the regressions of Table 12 is largely arbitrary, since all three variables are "jointly determined". Alternative results have been presented using net emigration as the dependent variable, and it may be seen that the same general conclusions are warranted from this set of results.
TABLE 12
TIME SERIES ANALYSIS 1951-69 (MID-APRIL) OF THE RELATIONSHIP BETWEEN CHANGES IN NON-AGRICULTURAL UNEMPLOYMENT, CHANGES IN NON-AGRICULTURAL EMPLOYMENT, AND NET
EMIGRATION (THOUSANDS)
"Dependent" Variable A Non-Ag.
Unemploy-ment
Net Emigration Net Emigration Net Emigration
Intercept A 1815
B 15-82 C 15-20 33-44 33-83 3400
A Non. Ag.
Employ--0-699 (6-34) -0-588 (6-71) -0-578 (6-88) -1-21 (10-34) -1-20 (10-90) -1-22 (1100)
A Non. Ag.
Unemploy-ment
—
-1-33 (A) (611) -1-61 (B)
(6-60) -1-68 (C)
(659)
Net
Emigra-tion
-0-537 (612) -0-461 (6-60) -0-442 (6-59)
Ra •75
•77 •77 •88 •90 •90
S.e.e. 3-33
2-65 2-54 508 4-81 4-81
Non. Ag. Unemployment: Definition A: Total Live Register less Agriculture. Definition B: A less "Other Construction"
Definition C: B less Fishing, Private Domestic Service. DATA SOURCES: The Trend of Employment and Unemployment, Statistical Abstract,
109 CONCLUSION
This paper has touched on a number of topics relating to the employ-ment of women in Ireland. The structure of total employemploy-ment opportunities was shown to be biased towards male employment due to the importance of family fanning in the economy, and the tendency for women living on farms not to be counted in the labour force. The structure of manufacturing industry, on the other hand, was seen to be biased towards female employ-ment due to the unimportance of heavy engineering in our economy. There is no evidence that Ireland's low participation rate among married women had, as of 1966, distorted either the economy's industrial structure or the sex ratio of employment in individual sectors of the economy. However, a situation is now being faced in which the rise in the proportion of young adult females who are married is gradually, but significantly, altering the sex ratio of the population available (by conventional Irish norms) for work. Virtually all of the growth of the female population is now occurring among married females, who traditionally contribute very little to the labour force as it is measured by our Census of Population. On the other hand, there is every reason to expect the demand for female labour to continue to expand, especially in the commercial and service sectors of the economy.
In Ireland, as elsewhere, there is a very high degree of sex segregation of occupations—with over one quarter of all working women employed in occupations that are at least 90 per cent female—and some, no doubt, of this process of occupational sex-labelling is discriminatory and irra-tional from an economic viewpoint. Implementation of equal pay might significantly reduce this type of segregation, but on the whole changes in the sex ratio of occupations are likely to occur only slowly, so that not much relief from the prospective shortage of women workers can be expected from this source.
A rise in labour force participation especially among married women, is the most likely labour market adjustment to the situation now facing Ireland. No doubt much of the work contributed by married women will be qn a part-time basis, as is now the case in many European countries with higher participation rates. This will call for adjustments on the part of employers to the special needs of married female workers, as well as the development of appropriate community services to facilitate those married women who are anxious to take advantage of the employment oppor-tunities that will be increasingly open to them. Several European countries (both western and eastern) and the U.S.A. have experienced fairly sharp rises in participation by married women since the second world war. Thus, we can anticipate the problems we shall face, and learn from the experience of others.11
Our study of the inter-county variations in Irish participation rates established a definite—if not very dramatic—tendency for women to be
110
attracted into the labour force in tight (female) labour market situations. To a limited extent, at least, demand creates its own supply. It is not possible to state the upper limit to this process, but one may suspect that it would be fairly quickly reached in Ireland in the absence of some major changes in the basic social, cultural and institutional influences on employ-ment of married women.12
The questions, whether or not it is desirable that married women should work, and if so, how this should best be organized, are obviously too important and far-reaching to be left to economists to decide. We need, however, a more widespread appreciation of the fact that major issues of this nature are now being posed to us by the course of demographic and economic events.
I l l
APPENDIX 1
COMPARISON OF CENSUS OF POPULATION AND CENSUS OF INDUSTRIAL PRODUCTION DATA ON NUMBERS AT WORK IN
IRISH MANUFACTURING INDUSTRY
Throughout this paper, considerable use has been made of the labour force statistics given in the Census of Population (CP). It must be recalled that the CP asks the "principal occupation or calling" of each person aged 14 and over. In general it seems likely that married women will return "housewife" or "home duties" unless they are full-time gainfully occupied. This would tend to bias our female labour force statistics downward, and may be part of the reason for the very small proportion of our married women who are classified gainfully occupied.1
Our only check on the CP labour force data is based on Census of Industrial Production (CIP) data for employment in the industrial sector. The CIP data are based on returns filled out by all employers, and given, for a week in October, details of the labour force by sex. A detailed com-parison of the CP and CIP data is presented in Table A l .
A similar comparison, not decomposed by sex, was published in the General Report of the CP 1946 & 1951 (CSO, 1958) Table 75. The general commentary to that Table is relevant here:
"The CIP extends only to businesses with three or more persons (including working proprietors) engaged. In consequence the difference between the two sets of figures should give an indication of the numbers employed in the one—and two—man concerns not covered by the CIP. The difference in inflated by its including those concerns in which three or more persons are engaged but who fail to send in CIP returns" (p. 94). A further complication arises from the treatment of "outside piece-workers" : data are collected for these in the CIP labour force statistics, but separate statistics are given for them, so that it is possible to calculate a total including or excluding outside workers. Since most of these workers are women, and over three-fourths of them are in the Hosiery industry, the emphasis should be placed on the total excluding outside workers.2 However, when the totals (excluding outside workers) are compared, a striking difference between males and females appears: for males the CP total exceeds the CIP total by 16-6 thousand or 14 per cent, whereas for females the CIP exceeds the CP total by 2.1 thousand or 3-5 per cent. The male shortfall in the CIP (compared with the CP) is expected (although its size is surprisingly high); the female shortfall on the CP (compared with
1 The contrast with the U.S. questionnaire is instructive. The person filling out the
Census Form is asked in respect of all persons "Did this person work at any time last week? (excluding housework)". If "yes", "How many hours did he (she) work last week (at all jobs)?" Thus, the U.S. labour force includes all those who did any work during the Census week, regardless of how few hours.
1 Even more important is the evidence (from the wage statistics) that such workers
TABLE Al
EMPLOYMENT BY MANUFACTURING INDUSTRY—COMPARISON C.P. (APRIL) AND CLP. (MID-OCTOBER) DATA, 1966
(Outside piece workers, C.I.P., in Parentheses)
OF
Industry
Grain milling and animal feed ... Bread and flour confectionary,
biscuits ... Milk Products ... Jams, etc. ... Cocoa, chocolate, etc. Sugar
Bacon factories Canned Meat, etc.
Qther food (incl. margarine) halting
Brewing Soft Drinks Distilling Tobacco
Woollen and Worsted (incl. carpets) Linen and Cotton
Jute etc., Cordage Rayon, etc. ... Hosiery
Other Textile goods Footwear (factories) Clothing (excl. handicraft) Tanning
Leather, etc Wood and Cork ...
Furniture and brooms, brushes Paper, paper products Printing and Publishing Fertilisers ...
Oils, paints, inks and polishes ... Soap etc. . . . .
Chemicals, drugs, etc.
Glass, pottery, china, glasswear Clay products, etc., cement Metal trades Non-electrical machinery Electrical machinery Shipbuilding Railroad equipment Road vehicles Other vehicles Miscellaneous, "other" Total Females CLP.* 582 3,297 802 2,263 3,831 280 1,320 657 573 32 748 265 119 1,180 3,241 (342) 1,266 (8) 1,559 4,895 (3,440) 554 3,324 {3 1) 12,892 (496) 144 479 (\£\ 284 786 f1A\ (14) 2,308 2,929 (10) 215 328 331 1,389 789 312 1,481 (1) 262 3,859 34 92 293 170 2,734 (87) 62,899 (4,461)
C P . 533 2,625 1,070 1,196 2,415 317 1,500 362 588 31 637 372 189 1,113 3,040 1,525 1,267 5,187 829 3,271 12,725 148 536 252 737 1,894 3,787 188 276 390 1,768 837 263 1,457 494 3,342 40 58 437 98 3,024 60,818 Ma CLP.* 4,344 6,666 4,928 1,577 1,960 1,826 3,477 2,639 729 742 4,271 1,368 607 1,097 3,860 (102) 2,419 2,225 2,283 155 2,791 3,073 (13) 1,436 211 (6) 3,460 3,215 (f\ 3,010 6,521 C155} 2,388 1,050 367 1,199 2,258 4,601 9,218 (160) 2,229 4,717 1,278 2,199 6,260 1,425 5,571 115,716 (441) les CP. 4,610 5,549 5,896 1,099 2,057 1,894 3,749 1,759 1,016 631 4,512 2,381 825 1,092 3,821 2,360 1,903 2,255 754 2,970 3,497 1,281 596 6,041 4,950 2,714 8,392 2,404 1,307 461 2,630 2,597 5,550 1,587 4,317 5,610 1,328 1,806 6,338 1286 6,528 132,353
113
the CIP) occurs when our expectation is for the CP figure to exceed the CIP. Thus, there may be significant underenumeration of the female labour force in the CP, due presumably to the bias towards returning "home duties" or "housewife" inherent in the census question. The extra women appear in the CIP in certain food industries (confectionery, etc., cocoa, chocolate, etc., Jams) and in Paper and Paper products. The discrepancies between the two Census for Linen and Cotton, Woollen and Worsted, Jute, etc., appear to reflect classification problems: if the total of these industries is considered the discrepancy is greatly reduced.
The statistics on hours worked by females in those industries where the CIP total is high do not suggest that many of these workers are part-time. For example, average hours worked by females aged 18 and over in Cocoa, Chocolate etc. in October 1966 was 36-7. The fact that the CIP data relate to October, the CP to April could account for some of the discrepancy, but quarterly estimates of persons engaged (CIP) show little evidence of a rise in the third or fourth quarters in any of the industries where the CIP records an excess of females over the CP figure, except for Jams.
If in fact there is serious underestimation of the female industrial labour force in the CP, the problem is likely to be greater in the service and commercial sectors of the economy where part-time work (especially among married women) is probably more common and almost certain to increase due to the scarcity of young single women.
It may be noted that the contrast between CIP and CP returns (as between males and females) mentioned in this Appendix parallels the comparison of CP and Live Register statistics of unemployment provided by R. C. Geary and J. G. Hughes in Appendix A of Certain Aspects of Non-Agricultural Unemployment in Ireland (ESRI, 1970). This source shows considerably higher female unemployment in the Live Register returns for the Food, Textiles, Clothing, Paper industries than is recorded in the CP returns.
114
APPENDIX 2
THE PROBLEM O F HETEROVARIANCE
The use of the 26 counties of the Republic in a cross-section analysis implies including units of greatly varying size as observations in the regressions. It is true that all the variables included in our analysis are expressed as rates or ratios, so that the absolute size of the county is not apparent from the data. Nevertheless, serious risk of heterovariance is introduced in a situation like this. Stated simply, the county participation rates may be regarded as sample means, and the variance of a sample mean is inversely proportional to the sample size. More formally the 2nd moment of a parameter estimate about the population value, i.e. N A
£ (0-0)2
i = l N is inversely proportional to sample size. 0 the true population value of the
A
parameter, will be unbiasedly estimated by the sample mean, 0, so the variance and 2nd moment about population value happen to coincide when an unbiased estimator is used.
Let, h i = a + b Wi+e4
where hi=hours worked by the ith individual.
Wi=a market variable such as the wage paid to the ith worker e=stochastic error term.
If we wish to obtain estimates of a, b the necessary conditions under which ordinary least squares will yield unbiased and best (minimum variance) estimates are:
E(ei ej)=O, i # k = 02, i - k
If however we take note of the fact that worker i lives in area s and that our observations are by area, namely county average participation, wage rates etc., then it is arguable that we are dealing with the following situation
Ps
S hi s Ps J P* J = a + b E Wi£+p§ £ els
or
Y,=a+bW.+=-i:ei. r
then
= J _ P , E(esek)= 1 o2 for s = k
115
Hence the variance of the error term of the county regressions is inversely proportional to the county population. If this is the case, the estimates of a and b obtained from ordinary least squares regressions on the original observations are not minimum variance estimates, nor are the estimated standard errors of these estimated parameters unbised estimates of the true standard errors. An alternative procedure is to obtain the following weighted regression:
Yj V P j = a V P j + b (Wj VPj)+Uj
Uj may be seen to have the desired properties for minimum variance estimates if the assumptions of the model just outlined are valid (that is, homovariance at the individual observation level). Intuitively, it is appeal-ing that the larger counties receive a weight proportional to the square root of their population, since it seems that the Dublin observation contains far more information than that of Leitrim, for example.* Most of the regression results presented in this paper have been estimated in their weighted and unweighted forms. The weighted regressions in all cases utilized the square root of the county population (in the relevant sex, age-group) as the weight for all variables, and the intercept was obtained as the coefficient of the weight itself (the normal intercept term being suppressed). For ease of presentation, and because more trials were per-formed in the unweighted specification, the main discussion has been confined to these results. However, it is of methodological interest to present a comparison of the two types of regressions, and this is done for selected equations in Table A2. Note that this table does not record any R2 or S.e.e.: these are meaningless for comparisons of unweighted results, since the dependent variable is not the same and since in the weighted regressions all the variables (dependent and independent) have been multiplied by a common variable, hence R2 is always extremely high in our weighted results but this indicates nothing as to the superiority of the weighted equations. If the assumptions regarding error variance spelled out above are valid, the weighted results may be taken as a more efficient estimate of the parameters, and the Mests for the weighted results should be more reliable than the unweighted.
By far the more striking feature of Table A2 is the consistency of the two sets of results, and this consistency was noticeable in virtually all the comparable equations that were estimated. There is some tendency for the weighted regression results to be more significant (by the r-test on the individual coefficients), but this was not universally true. The values of the coefficients remained remarkably stable between weighted and un-weighted results, even in the cases where these coefficients were subject to very large standard errors. Thus, little if any difference in the overall
TABLE A2
COMPARISON OP WEIGHTED AND UNWEIGHTED REGRESSION RESULTS SELECTED EQUATIONS: DEPENDENT VARIABLE LABOUR FORCE PARTICIPATION RATE IN SPECIFIED POPULATION GROUPS: REGRESSION COEFFICIENTS WITH t-RATIOt IN PARENTHESES
Untmploy-IIMfll RltC
% « O I n A f . Occupttions
Industry Hix (•xcl. Ag.)
Industry Mix (!ncl.A|.) N « Em. Rat*
MALE
Un-Weigh-
weigh-ted weigh-ted 14-19
- 0 - 5 0 9 (4-44) 0070 —0-418 (1*2) — —0316 (1-82) —0-565 (4-71) 0075 0-71) —0-284 (1-41) — —0-243 (1-37) Un-Weigh- weigh-ted weigh-ted 14-19 —0*555 (5-45) — —0-376 (247) —0-404 (2-41) —0-577 (5-40) — — —0-328 (233) —0-307 (1-72) Un-Weigh- weigh-ted ttd 14-19 —0-710 (127) —1099 (4*33) 0058 (018) — —0-852 (3-96) —0-750 d-70) —1048 (4-17) 0-241 (0-80) — 0-965 (3-85) Un-Weigh- wtigh-c«d ted 20-24 —0-393 (114) —0-728 (4-43) 0-322 (1-52) — —0-329 (2-35) —0-301 (0-931) —0-572 (2-99) 0-309 d-33) — —0-321 (1-61) Un-W«ifh- weifh-t«d ttd 25-34 —0-228 (0-80) —0-173 (1-57) 0-524-(2-87) __
- 4 - 3 7 0 (2-79)
—0-300
d-31)
- 0 0 8 0 (0-79)
0-500 (2-92)
—
- 4 - 3 4 0 (2-29) FEMALE Un-W«igh- wtigh-ted wtigh-ted 35-44 -4J-372 ( I ' W )
—
—
0-494 (4-20)
— 0 - l i l (0-97) —0-284 (1*68) — — 0-430 (407) 0-095 — (0-78) Un-Wtigh- weigh-ted weigh-ted 45-54 —0-233 (0-77) —0027 (041) 0-208 (0-98) — —0-372 (1-52) —0-276 (0-64) 0002 (0-02) 0-301 d-13) —
- 0 6 7 8 (242) Un-Weigh- weigh-ted weigh-ted 55-64 —0-515 d-36) —0013 (0-18) 0-061 (0-23) — —0-204 (0-84) —0-515 d-99) 0-016 (0-33) —0050 (0-26) — —0050 (0-85) Un-Weigh- weigh-ted weigh-ted 65 and over
—0-193 (0-61) 0-110 (293) —0-278 (1-33) — —0-048 (0-24)
—0-054 ^ * (023) -0133 (3-97) —0-325 d-92) — - 0 1 8 3
117
118
APPENDIX 3
DATA USED IN REGRESSION OF TABLE 12
Year
Year 1951-52 ... 1952-53 1953-54 1954-55 1955-56 1956-57 1957-58 1958-59 1959-60 1960-61 1961-62 1962-63 1963-64 1964-65 1965-66 1966-67 1967-68 1968-69
Change in Non-Ag. Unemployment
A 11-5
7-4 - 8 - 9 - 2 - 8 - 2 - 2 11*7 - 5 - 0 - 4 - 6 - 5 - 8 - 6 - 3 1 0 3-6 - 2 - 6 0-8 2-6 4 0 4-4 - 4 - 2
B 1 0 9
3-4 - 4 - 9 - 2 - 6 - 2 - 5 10-8 - 4 - 5 - 3 - 4 - 4 . 7 - 5 0 1-4 3-4 - 2 - 2 1 1 2-7 3-9 4 1 - 3 - 5
C 10-8
3-8 - 5 - 3 - 1 - 9 - 2 1 10-8 - 4 - 2 - 3 - 5 - 4 - 2 - 5 0 1-6 2-8 - 1 - 5 1 0 2-6 3-6 3 0 - 3 - 1
Net Emigration
3 5 0 33 0 3 6 0 45 0 48 0 41 0 58 0 3 2 0 4 1 0 4 0 0 1 5 0 9 0 1 7 0 1 9 0 21-2 13-9 17-7 17-3
, Change in Non-Ag.
Employ-ment
- 7 - 9 - 5 0 3 0 - 7 0 - 9 0 - 2 5 0
9 0 1 0 3 0 8 0 1 6 0 1 4 0 1 4 0 1 2 0 3-5 8-5 1 1 0 1 6 0
119 DISCUSSION
Mr, Jan Finlay, proposed a vote of thanks to Dr. Walsh. I congratulate him on a very interesting and stimulating paper which would require extremely close study to enable its full value to be appreciated.
I would like to refer to the manpower surveys of Drogheda, Waterford and Galway which had been published by the Department of Labour and point out that these surveys tended to confirm the "discouraged worker" hypothesis referred to by Dr. Walsh. In all three areas substantial pools of potential employees had been revealed whose presence was not shown by official statistics. Most of these people were in the categories of recent school-leavers and married women interested in employment. The surveys had suggested, however, that many of the school-leavers had not the qualifications for, or interest in, the type of employment (mainly in industry) likely to be available. Most of the married women had family responsibilities which would make it difficult for them to accept employ-ment.
The Department of Labour research indicated the need for caution in examining labour supply and demand on a purely statistical basis. Many local factors are frequently of importance, such as attitudes of potential employers and employees, and these could only be ascertained by on the spot enquiries.
I would also like to refer to a study by the E.S.R.I. which had been commissioned by the Department of Labour on the Labour Force Status of Women. The purpose of the study was (a) to measure participation rates of women workers in Ireland; (b) to isolate reasons for the apparent low participation rates; and (c) consider if manpower policies can change the participation situation and to attempt to assess the costs and benefits involved. The Commission on the Status of Women under Dr. Beere's chairmanship, were also interested in this study and would use the results of the research in their work.
One of Dr. Walsh's conclusions is that a rise in labour force participa-tion by married women was the main labour market adjustment facing Ireland. He has also pointed out that employment in Irish industry already has a female bias. Most of the complaints about shortages of female workers came from manufacturing industry. If, in fact, our industry moved further towards female employment our general employment situation would become even more unbalanced. The I.D.A. were, of course, concentrating on attracting industries with male employment and perhaps even greater efforts in this direction would be necessary.