Analysis and Insights from the
PARSEME Shared Task dataset
Alfredo Maldonado
ADAPT Centre, Trinity College Dublin
Behrang QasemiZadeh
University of Düsseldorf
The PARSEME Shared Task on the automatic identification of verbal multiword expressions (VMWEs) was the first collaborative study on the subject to cover a wide and diverse range of languages. One observation that emerged from the offi-cial results is that participating systems performed similarly on each language but differently across languages. That is, intra-language evaluation scores are relatively similar whereas inter-language scores are quite different. We hypothesise that this pattern cannot be attributed solely to the intrinsic linguistic properties in each lan-guage corpus, but also to more practical aspects such as the evaluation framework, characteristics of the test and training sets as well as metrics used for measuring performance. This chapter takes a close look at the shared task dataset and the sys-tems’ output to explain this pattern. In this process, we produce evaluation results for the systems on VMWEs that only appear in the test set and contrast them with the official evaluation results, which include VMWEs that also occur in the training set. Additionally, we conduct an analysis aimed at estimating the relative difficulty of VMWE detection for each language. This analysis consists of a) assessing the impact on performance of the ability, or lack-thereof, of systems to handle discon-tinuous and overlapped VMWEs, b) measuring the relative sparsity of sentences with at least one VMWE, and c) interpreting the performance of each system with respect to two baseline systems: a system that simply tags every verb as a VMWE, and a dictionary lookup system. Based on our data analysis, we assess the suit-ability of the official evaluation methods, specifically the token-based method, and propose to use Cohen’s kappa score as an additional evaluation method.
1 Introduction
Multiword expressions (MWEs) have been studied extensively due to the fact that many natural language processing (NLP) pipelines depend on their correct identification and processing (Sag et al. 2002). However, there has been
rela-tively little work on Verbal MWEs (VMWEs). The PARSEME1 Shared Task on
VMWEs (Savary et al. 2017) was the first initiative focusing on the problem of identifying VMWEs for a relatively large number of languages, 18 in total. This initiative produced an array of annotated training and test sets for each language. Using these training sets, shared task participants developed and trained VMWE-identification systems, which were then evaluated on separate test sets also pro-duced by PARSEME.
Several patterns have emerged from the evaluation results in this pioneer-ing shared task. One is that individual systems tend to perform very differently across languages (inter-language performance) and yet different systems per-formed similarly in most languages (intra-language performance). In particular, participating systems scored highest on Farsi, Romanian, Czech and Polish, and lowest on Swedish, Hebrew, Lithuanian and Maltese, whilst ranging somewhere in between for the rest of the languages. It has been observed that the inter-language performance is positively correlated with the proportion of VMWEs shared by the training and test sets in each language (Maldonado et al. 2017). This observation suggests that the reported systems’ performance and ranking could potentially be dependent on the proportion of shared VMWEs across lan-guages. At the very least, it is clear that inter-language performance differences cannot be attributed to linguistic differences among languages alone, but to par-ticularities of the dataset that interplay with these linguistic differences.
This chapter conducts a detailed data analysis of the PARSEME dataset and the official systems’ submissions in order to try to understand how these particular-ities impact systems’ performance and to propose possible modifications to the dataset in order to balance out said particularities among the language corpora. To this end, we start our discussion in §2 by computing statistics for each language to get a sense of their differences. We then measure the relative diffi-culty in identifying VMWEs in each language corpus by focusing on three fac-tors that could potentially pose challenges to the systems: 1) the relative sparsity of VMWEs in each language corpus (by measuring the proportion of sentences with and without VMWEs); 2) the prevalence and significance of discontinuous VMWEs and embedded (or overlapped) VMWEs; and 3) corpus similarity and
homogeneity measures between the training and test portions for each language section. We observe that the importance of these factors varies across languages: while some are inherent to each language’s linguistic properties (e.g., proportion of continuous vs discontinuous VMWEs or the dominant category of VMWEs in a language), others (e.g., relative sparsity of VMWEs) can be controlled by al-tering the size of the training and test sets, the proportion of shared VMWEs between these two sets, and, in general, the homogeneity of the distribution of VMWEs in these sets for each of the languages.
We then turn our attention to the shared task official evaluation scores on the participating systems in §3 and §4. In §3, we focus on the effect of the proportion of shared VMWEs between the training and test sets in each language corpus. We evaluate the systems on shared VMWEs and on VMWEs occurring exclusively in the test set. We also introduce two baseline systems (a system that simply tags every verb as a VMWE and a simple dictionary look-up system) and observe that the performance of the participating systems follows trends that the performance of these baselines shows.
In §4, we concentrate on the evaluation metrics used in the shared task: one that measures the ability of retrieving full VMWEs (MWE-based evaluation) and another that gives credit to systems on partially identified VMWEs (Token-based evaluation). We observe that the Token-based evaluation measure gives more weight to long VMWEs and, in addition, can be exploited by a system that simply detects verbs. Lastly, we use Cohen’s κ inter-annotator agreement measure as an evaluation metric based on the intuition that it provides a ‘chance-corrected’ degree of similarity between a system output and a gold standard.
In §5, we conclude that the PARSEME VMWE dataset is a valuable resource for evaluating VMWE identification systems as long as certain variables are con-trolled for and purpose-specific evaluation frameworks are considered. We also propose avenues for future work.
2 Shared task dataset
This section explores several numerical properties of the dataset developed for the shared task in order to gain an insight into differences among languages and
to identify potentialdifficulty factorsin the corpora. We consider difficulty
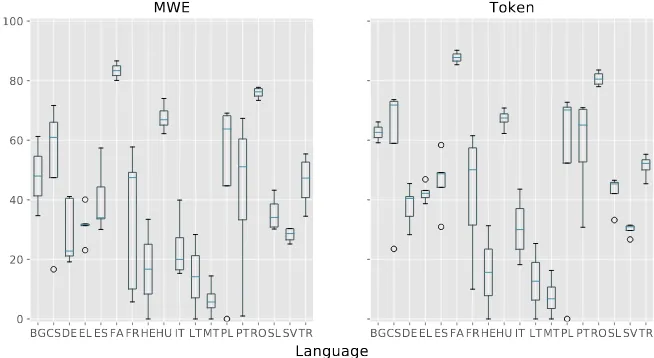
fac-tors to be corpus-specific characteristics (such as corpus size, sparsity of VMWEs or corpus heterogeneity) that could potentially hinder an algorithm’s ability to identify VMWEs. We assess a factor’s degree of difficulty by observing the over-all systems’ performance on languages that present the factor in question, in comparison to languages that do not present that factor. The performance of the systems is measured by the official shared task evaluation F1 scores, shown in Table 1. That table also contains the averages all systems’ scores for a given
language (avg column) and the ranks of the languages according to these
aver-ages (rnk column). Recall that two evaluation modalities were measured in the
shared task: MWE-based evaluation, which counts as a success the matching of a full VMWE, and Token-based evaluation, which gives partial credit to partially matched VMWEs. Figure 1 summarises these scores per language as box plots.
BGCSDEELESFAFRHEHU IT LTMTPL PTROSLSVTR 0
20 40 60 80
100
MWE
BGCSDEELESFAFRHEHU IT LTMTPL PTROSLSVTR
Token
Language
[image:4.482.92.419.320.499.2]F1 Score
Table 1: F1 evaluation scores by language and system with averages (avg), rank (rnk) in Token-based, MWE-based and Cohen’s κ evalua-tions. Baselines: dictionary look-up (BD) and verb detection (BV).
ADAPT LATL LIF MUMULS RACAI SZEGED TRANSITION avg rnk BD BV BG Token-based 59.16 66.15 62.66 4 47.44
MWE-based 34.68 61.27 47.98 6 34.67
Cohen’s κ 21.36 53.57 37.47 6 21.27
CS Token-based 72.86 23.52 70.76 73.65 60.20 5 64.34 20.41
MWE-based 57.72 16.67 64.18 71.67 52.56 4 51.91 0
Cohen’s κ 46.49 8.82 55.04 64.36 43.68 5 37.87 -18.54
DE Token-based 40.48 34.45 28.30 45.45 41.09 37.95 13 40.70 28.52
MWE-based 22.80 21.14 19.17 40.53 41.10 28.95 13 41.34 9.22
Cohen’s κ 5.86 5.01 5.82 24.97 26.44 13.62 16 26.42 -15.49
EL Token-based 43.14 42.17 38.71 40.75 46.88 42.33 12 34.16 9.14
MWE-based 31.34 23.08 31.74 31.88 40.07 31.62 12 21.81 0.02
Cohen’s κ 23.28 12.46 25.2 22.9 31.57 23.08 11 9.46 -7.41
ES Token-based 49.17 48.75 30.93 44.18 58.39 46.28 9 50.97 15.56
MWE-based 44.33 33.62 30.06 33.99 57.39 39.88 9 44.22 0
Cohen’s κ 35.84 21.18 23.41 17.81 48.83 30.91 9 32.7 -13.41
FA Token-based 85.36 90.20 87.78 1 65.75 47.73
MWE-based 80.08 86.64 83.36 1 55.92 0
Cohen’s κ 63.13 74.77 68.95 2 22.71 -50.01
FR Token-based 61.52 54.61 10.00 29.40 50.09 33.64 60.28 42.79 10 45.73 18.28
MWE-based 50.88 47.46 10.82 9.29 47.55 5.73 57.74 32.78 11 38.42 0.21
Cohen’s κ 40.12 33.77 7.98 -4.75 38.74 -14.42 48.98 21.49 13 24.19 -15.99
HE Token-based 0.00 31.30 15.65 16 33.80
MWE-based 0.00 33.44 16.72 16 37.44
Cohen’s κ 0.00 27.74 13.87 14 32.69
HU Token-based 66.10 68.86 62.26 70.81 67.47 67.10 3 68.13 12.49
MWE-based 66.89 62.21 65.08 74.01 69.87 67.61 3 68.09 2.44
Cohen’s κ 50.6 42.13 49.45 60.04 52.03 50.85 3 49.01 -35.81
IT Token-based 25.11 18.24 34.90 43.57 30.46 14 37.85 14.4
MWE-based 23.09 16.90 15.31 39.90 23.80 15 29.03 0
Cohen’s κ 14.26 10.01 -10.01 25.33 9.9 17 8.27 -14.44
LT Token-based 0.00 25.33 12.67 17 28.85
MWE-based 0.00 28.35 14.18 17 30.08
Cohen’s κ 0.00 27.25 13.62 15 28.82
MT Token-based 8.87 0.00 4.69 16.29 7.46 18 11.42 6.79
MWE-based 6.41 0.00 5.00 14.44 6.46 18 6.75 0.02
Cohen’s κ 3.5 0.00 2.99 6.6 3.27 18 -5.25 -5.74
PL Token-based 72.74 69.77 0.00 70.56 53.27 7 74.40 18.33
MWE-based 67.95 59.61 0.00 69.09 49.16 5 69.98 0
Cohen’s κ 61.53 51.33 0.00 62.72 43.9 4 63.46 -15.01
PT Token-based 70.18 60.01 30.79 70.94 57.98 6 59.97 14.32
MWE-based 58.14 44.05 0.99 67.33 42.63 8 54.49 0
Cohen’s κ 51.35 35.98 -11.52 62.03 34.46 7 46.35 -11.86
RO Token-based 81.90 83.58 77.99 79.12 80.65 2 63.76 11.51
MWE-based 73.38 77.21 77.75 75.31 75.91 2 57.74 0
Cohen’s κ 71.28 75.35 76.12 73.18 73.98 1 53.75 -7.32
SL Token-based 45.06 45.62 33.20 46.55 42.61 11 28.47 0.08
MWE-based 37.08 31.08 30.19 43.22 35.39 10 21.65 0
Cohen’s κ 29 20.49 23.45 33.17 26.53 10 5.23 -0.07
SV Token-based 31.49 26.69 31.19 30.70 30.02 15 8.94 13.23
MWE-based 30.32 25.17 27.03 30.36 28.22 14 7.32 0
Cohen’s κ 24.44 20.78 16.56 24.75 21.63 12 -5.62 -10.29
TR Token-based 52.85 45.40 51.59 55.28 51.28 8 16.60 10.45
MWE-based 42.83 34.49 51.76 55.40 46.12 7 5.95 0
Cohen’s κ 25.88 19.05 38.88 42.14 31.49 8 -8.57 -17.81
avg Token-based 53.79 54.61 10.00 40.71 41.12 36.86 54.10 43.40 16.08
MWE-based 46.22 47.46 10.82 29.81 38.71 25.50 52.37 37.60 0.79
2.1 Corpora sizes, VMWE sparsity and frequency distributions
We start by discussing the sizes of the training and test portions in each language corpus, depicted in Figure 2. Sizes are measured in terms of the total number of sentences. Traditionally, corpora sizes are discussed in terms of number of words, rather than number of sentences. We use number of sentences instead for a variety of reasons: 1) Each language corpus in the dataset consists of a collection of individual sentences. So the sentence is a natural unit to describe the dataset. 2) A sentence is expected to have a single main verb. On average, we can expect to have a little more than one verb per sentence. However, we would
like to know what this average is for the case ofverbalMWEs (VMWEs). That is,
we would like to know how sparse VMWEs are in a given language corpus, and what impact this sparsity may have. 3) Measures such as the rate of VMWEs per
𝑛 tokens could also be used, but are less linguistically motivated. Finally, 4) the
training-to-test size ratios in terms of number of words are largely the same in this dataset as in terms of number of sentences.
Notice that Romanian and Czech have by far the largest training sets, dwarf-ing corpora of all other languages. This seems to work in favour of these two languages as, on average, Romanian ranked 2nd place in both evaluation modali-ties and Czech ranked at 4th and 5th places in the MWE-based and Token-based modalities, respectively. Swedish is the language with the smallest training set (only 200 sentences). The average F1 score of systems participating in Swedish is around 30% for both evaluation modalities. Indeed, the size of the training set is somewhat positively correlated with the average system evaluation scores for each language. The Pearson correlation coefficients for MWE-based and Token-based evaluations are 0.33 and 0.35, respectively.
The size of the test set relative to its corresponding training set varies widely across languages. The test-to-training proportions vary from 8% to 60% for most languages, except for Maltese (79%), Spanish (85%) and most notably, Swedish,
with a test set about 8 times larger than its training set.2Although both Maltese
and Swedish performed rather poorly (Maltese actually ranked last), there is no clear pattern between the test-to-training proportion of a language corpus and the performance of systems. In fact, Spanish ranked exactly in the middle at 9th place. These proportions were found to be mildly negatively correlated against MWE-based and Token-based evaluations: -0.20 and -0.23, respectively (Pearson correlation coefficients).
2200 training sentences vs. 1600 test sentences, making the proportion of the training set almost
BG CS DE EL ES FA FR HE HU IT LT MT PL PT RO SL SV TR
Language 0
10000 20000 30000 40000 50000
Number of sentences
[image:7.482.90.362.109.285.2]Portion TRN TST
Figure 2: Relative sizes (in sentences) of the training and test portions of each language corpus.
BG CS DE EL ES FA FR HE HU IT LT MT PL PT RO SL SV TR
Language 0
20 40 60 80 100
Percentage of sentences with VMWEs
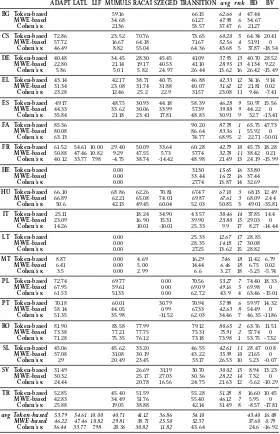
Portion TRN TST
[image:7.482.96.362.364.547.2]Figure 3 shows how sparse VMWEs are in the language corpora. VMWE spar-sity can be understood as the inverse of the proportion of sentences that have at least one VMWE. The figure shows the proportion of VMWEs within each set (training and test) using percentages. The graphs show that language corpora differ widely in their VWME sparsity. The overall proportion average (depicted by the two horizontal lines in the figure) is 24% and 23% for the training and test sets, respectively. Only Farsi and Hungarian are well above this average, and German is slightly above. For most languages, the vast majority of sentences do not contain a single VMWE. Whilst sentences without VMWE examples are indeed needed by machine learning algorithms, too few examples could hinder learning processes due to class imbalance. Indeed, there is a strong positive corre-lation between the proportion of sentences with VMWEs and the average system evaluation scores: 0.58 Pearson correlation coefficient against MWE-based eval-uation and 0.56 against Token-based evaleval-uation. Lithuanian and Maltese are the two lowest scoring languages in both evaluation modalities (see Table 1 and Fig-ure 1). They are two of the three languages with the highest VMWE sparsity. The third language is Romanian, which turns out to be the second highest scoring language. Romanian is, as previously mentioned, the language with the largest amount of training data. The Romanian corpus’ large volume seems to outweigh its high VMWE sparsity in systems’ performance.
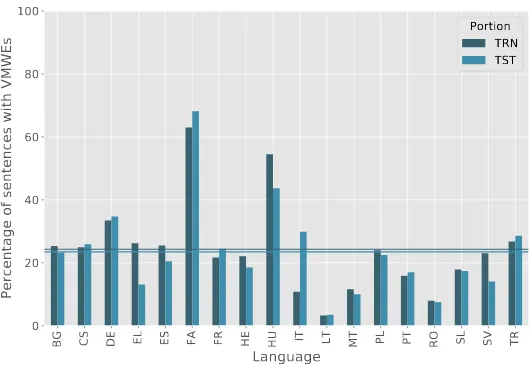
Another feature which seems to help systems perform well in the Romanian corpus is the frequency distribution of its VMWEs, as shown in Figure 4. This figure shows how many VMWE types occur at each VMWE frequency and how many of those VMWEs are successfully retrieved by the systems on the test por-tion of each language corpus. The grey bars on each chart show the total number
of VMWE types occurring at each frequency inscribed on the𝑥axis. The coloured
bars count the number of VMWE types at each frequency that were fully detected
by each system. This figure shows that Romanian VMWEs arewell distributed:
1 2 3 4 5 6 13 19
0 100 200
300 BG Total
MUMULS TRANSITION
1 2 3 4 5 6 7 8 9 10 11 12 13 14 15 17 18 26 57
0 200 400 600 CS Total ADAPT MUMULS RACAI TRANSITION
1 2 3 4 18
0 100 200 300
400 DE Total
ADAPT MUMULS RACAI SZEGED TRANSITION
1 2 3 4 5 6 7 9
0 100 200 300 EL Total ADAPT MUMULS RACAI SZEGED TRANSITION
1 2 3 4 5 6 8 10 14 21
0 50 100 150 200
250 ES Total
ADAPT MUMULS RACAI SZEGED TRANSITION
1 2 3 4 5 7 12
0 50 100 150 200 250 FA Total ADAPT TRANSITION
1 2 3 4 5 7 8 10 13 18
0 50 100 150 200 FR Total ADAPT LATL LIF MUMULS RACAI SZEGED TRANSITION
1 2 3 4 5 6 9
0 100 200 300 HE Total MUMULS TRANSITION
1 2 3 4 5 6 7 11 12 15 16 19 22 23 65
0 20 40 60 80 100 HU Total ADAPT MUMULS RACAI SZEGED TRANSITION
1 2 3 4 5 6 7 8 11
0 100 200 300 IT Total ADAPT RACAI SZEGED TRANSITION 1 2 0 20 40 60 80 LT Total MUMULS TRANSITION
1 2 3 4 5 9
0 100 200 300
400 MT Total
ADAPT MUMULS RACAI TRANSITION
1 2 3 4 5 6 8 9 10 13
0 50 100 150 200 250 PL Total ADAPT MUMULS SZEGED TRANSITION
1 2 3 4 5
0 100 200 300 PT Total ADAPT MUMULS SZEGED TRANSITION
1 2 3 4 5 6 7 8 9 13 17 18 26 31
0 50 100 150
200 RO Total
ADAPT MUMULS RACAI TRANSITION
1 2 3 4 5 7 8 10 19
0 100 200 300 SL Total ADAPT MUMULS RACAI TRANSITION
1 2 3 4 5
0 50 100 150 SV Total ADAPT RACAI SZEGED TRANSITION
1 2 3 4 5 14
0 100 200
300 TR Total
ADAPT MUMULS RACAI TRANSITION
MWE Frequency
[image:9.482.65.407.80.568.2]MWE types of each Freq., Total (grey) and Detected by systems (colours)
As an aside, the grey bars in Figure 4 show, for most languages, that the ma-jority of VMWEs are hapax legomena and that the number of VMWEs occurring more frequently decreases dramatically as their frequency increases. This is the hallmark of the Zipfian distribution, which is something to be expected with lex-ical phenomena (Manning & Schütze 1999: pp. 22–6). This is not the usual way in which this distribution is traditionally plotted from data. However, it can be seen that most charts follow it approximately.
The issue offrequency distribution is important. Hungarian and Spanish are
modest in size in comparison with Lithuanian and Maltese (see Figure 2), and yet the systems perform better in the former languages (especially in Hungarian) than in the latter languages. Figure 4 reveals that both Hungarian and Spanish are well distributed by frequency. Hungarian, despite having a smaller test set, is in fact even better distributed by frequency and has a lower VMWE sparsity (Figure 3) than Spanish. It obtains a 67 average F1 score whereas Spanish gets
an F1 score average of 40–46, in both evaluation modalities (seeavg column in
Table 1).
From these observations, we can point out that language corpora with small amounts of training data, especially when combined with high VMWE sparsity and a poor frequency distribution, tend to obtain low scores in most systems. So increasing the size of training and test data is definitely a recommendation to fol-low. VMWE sparsity can be reduced by simply trying to balance out sentences with VMWEs against sentences without VMWEs. However, corpus designers should be cautious of doing this, as it could lead to a corpus that does not re-flect the real distribution of VMWEs in the language and/or domain in question. Perhaps, it should be the task of system developers to design systems capable
of coping with the natural VMWE imbalance/sparsity in a language corpus.3
Im-proving the VMWE frequency distribution in language corpora could also help systems. Ensuring that several examples of each VMWE type are included in the training data will be a challenge, however, due to the natural Zipfian tendency of a majority of VMWEs to appear only once in any given corpus. We propose offsetting this tendency by aiming to compile a corpus where the total frequency
of VMWE types that occurfrequently enoughoutnumber the total frequency of
VMWE types that occurless frequently. That is, if𝜃 is the minimum frequency a
VMWE needs to have in order to be considered to haveenough frequency,4 then
we could ensure that the language corpus satisfies the condition:
3Systems could, for example, run a classifier to distinguish sentences that contain VMWEs from
sentences that do not, and train/run their VMWE extractors only on sentences that do.
4𝜃, a minimum desirable frequency, is a parameter to be set empirically, with𝜃 = 2a reasonable
(1) ∑
𝑣𝑖∈{𝑓 (𝑣𝑗)≥𝜃}
𝑓 (𝑣𝑖) > ∑
𝑣𝑘∈{𝑓 (𝑣𝑗)<𝜃}
𝑓 (𝑣𝑘)
where𝑓 (𝑣)is the frequency of VMWE𝑣in the corpus. Note that a corpus with
a good VMWE frequency distribution cannot be created by simply increasing the size of the corpus, but by better selecting sentences that are good examples of as many VMWEs as possible.
2.2 VMWEs shared between the training and test sets
Maldonado et al. (2017) noticed that the proportion of VMWEs shared between the training set and the test set of a language corpus is strongly positively cor-related with the performance scores achieved by participating systems on that language test set (see also Savary et al. 2018 [this volume] §6.3). The most likely explanation is that when evaluated on the test set, machine learning systems would tend to perform better on VMWE examples they encountered in the
train-ing set (i.e. exact VMWEs that systems have alreadyseenduring training) than on
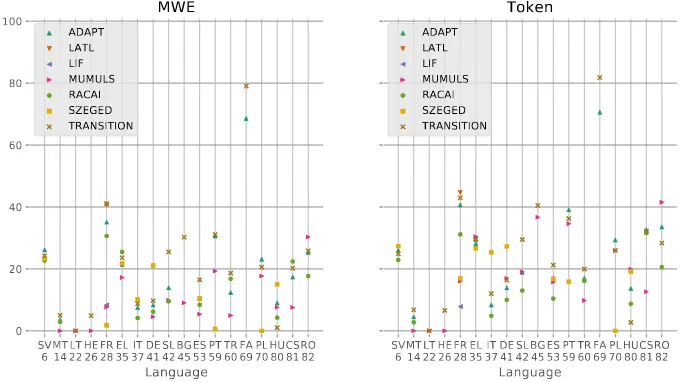
VMWE examples that systems encounter for the first time in testing. The higher the proportion of shared/seen VMWEs is in one language, the higher a machine learning system can be expected to perform on that language. Figure 5 depicts this relationship by plotting the score achieved by each system on each language against the proportion of shared/seen VMWEs in that language. The languages
on the𝑥 axis are sorted and labelled by this proportion. Notice the near-linear
relationship between this proportion and the system scores.
It is of interest to evaluate systems on non-shared/unseen VMWEs only. This can be done by using the official systems’ outputs, which were kindly provided to us by the shared task organisers. In order to evaluate unseen VMWEs only, the labels for seen VMWEs in the systems’ outputs and the gold standards were cleared (i.e. changed to the underscore ‘_’ flag) so that they would be ignored by the official evaluation scripts. Figure 6 shows the systems’ performance scores
when evaluated in this manner on unseen VMWEs only. Notice that the𝑥axis
SV
6MT14LT22HE2628FREL3537ITDE4142SLBG45ES5359PTTR6069FA70PLHU80CS81RO82
Language 0 20 40 60 80 100 F1
MWE
ADAPT LATL LIF MUMULS RACAI SZEGED TRANSITION SV6MT14LT22HE2628FREL3537ITDE41SL42BG45ES5359PTTR6069FA70PLHU80CS81RO82
[image:12.482.83.419.94.285.2]Language
Token
ADAPT LATL LIF MUMULS RACAI SZEGED TRANSITIONFigure 5: System evaluation scores (MWE-based, left; Token-based, right) for each language against the proportion (percentage) of test VMWEs seen during training
SV
6MT14LT22HE2628FR35EL37ITDE4142SLBG45ES53PT59TR6069FA70PLHU80CS81RO82
Language 0 20 40 60 80 100 F1
MWE
ADAPT LATL LIF MUMULS RACAI SZEGED TRANSITION SV6MT14LT22HE2628FREL3537ITDE41SL42BG45ES5359PTTR6069FA70PLHU80CS81RO82
Language
Token
ADAPT LATL LIF MUMULS RACAI SZEGED TRANSITIONPerformance on UNSEEN VMWEs
[image:12.482.80.420.363.554.2]did not fare nearly as well in this unseen VMWE evaluation. Taking a closer
look at Farsi VMWEs, we observe that they show a higher level ofcollostructional
regularity5compared to VMWEs in other languages. We observe that 86% of Farsi
VMWEs are of length 2 and the last token in all Farsi VMWEs is always a verbs, while this is not the case for other languages such as Hungarian. In addition, verbs constitute a relatively small vocabulary in Farsi and as a consequence, the same set of verbs are used repeatedly in various VMWEs. For example, the 2,707 annotated VMWEs in the Farsi training set end with verbs of 46 different lemmas, and the 500 annotated instances in the test set end with 34 lemmas. Among these 34 different lemmas, only 4 do not appear in the training set. Last but not least, most of these verb lemmas are strong indicators of the presence of VMWEs, too. The overall occurrences of these lemmas in the Farsi corpus is 6,969, from which 3,207 are part of a VMWE, i.e., nearly half of them (46%). More precisely, 16 of these lemmas (with 29 occurrences) appear only as constituents of VMWEs; most importantly, for the most frequent lemma in VMWEs (the past and present forms
of the infinitiveندرک/kærdæn/ ‘to make/to do’, a light verb, which appears as the
verb in 1,096 VMWEs) this proportion is 97% (i.e., out of 1,128 occurrences of this verb, only 32 do not surface as VMWE). To this, we can add observations
concerning syntactic patterns in which VMWEs are used, e.g., the light verbندرک
/kærdæn/ usually forms a transitive VMWE in which the non-verbal component
of the VMWEs appear right after the adposition ار/ra/ (i.e., which signals the
presence of the syntactic object). We maintain that these exemplified regularities can justify the obtained results over the Farsi corpus.
In general, however, it is fair to expect that systems will tend to perform worse on VMWEs they did not see in training.
2.3 Discontinuous VMWEs and embedded/overlapped VMWEs
Two innovations in the PARSEME shared task were discontinuous VMWEs and embedded or overlapped VMWEs (see Savary et al. 2018 [this volume] §6.3).
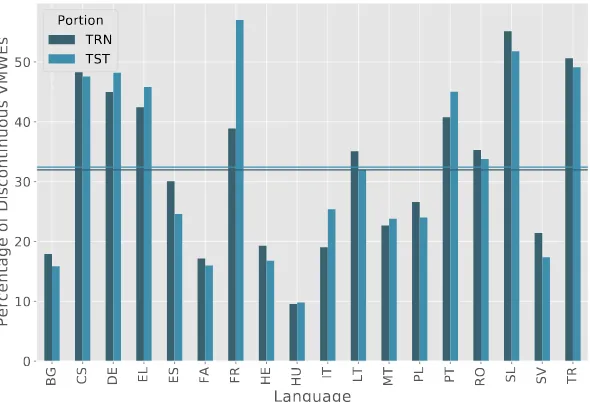
Figure 7 shows that for most languages, the majority of VMWEs are contin-uous. For Czech and Turkish, there is about a 50–50 proportion between con-tinuous and disconcon-tinuous VMWEs. For many other languages, the proportion of discontinuous VMWEs is considerable (German, Greek, French, Polish, Por-tuguese, Romanian, Slovenian). There is therefore a clear advantage in designing systems capable of detecting discontinuous VMWEs.
5Degree to which words tend to form (appear with) grammatical constructions (Stefanowitsch
BG CS DE EL ES FA FR HE HU IT LT MT PL PT RO SL SV TR
Language
010 20 30 40 50
Percentage of Discontinuous VMWEs
[image:14.482.100.395.90.291.2]Portion TRN TST
Figure 7: Percentage of discontinuous VMWEs across language cor-pora.
BG CS DE EL ES FA FR HE HU IT LT MT PL PT RO SL SV TR
Language
0
2
4
6
8
10
12
14
Percentage of Embedded VMWEs
Portion
TRN
TST
[image:14.482.103.387.356.555.2]The proportion of embedded/overlapped VMWEs, shown in Figure 8, is very low across languages, with an average of around 2.3% in both training and test portions. Hebrew is the language with the highest rate of embedded VMWEs at only 12–14.5%. Some languages do not even register a single embedded VMWE. Because of these low numbers, a system not designed to deal with embedded VMWEs will not be severely penalised. We therefore do not consider embedded VMWEs to be a difficulty factor in this dataset, with the exception of Hebrew.
2.4 Relative training-test corpus heterogeneity
The evaluation paradigm followed in the PARSEME shared task dictates that sys-tems must be evaluated on a strictly unseen test set, guaranteeing fairness to all participating system developers. However, a valid expectation is that the data that systems will be tested on should be roughly of the same kind as the data they were trained on. The training and test portions of a language corpus should be fairly homogeneous.
Kilgarriff & Rose (1998) introduced a statistical metric to estimate the similarity
of two corpora of similar size by computing the𝜒2score of the𝑛most frequent
words in the corpora. The lower this score, the less variability between the cor-pora and thus the more similar they are. They also adapted this similarity score
to measure the homogeneity of a single corpus by computing𝜒2scores on pairs
of similarly sized partitions of the corpus and averaging the individual𝜒2scores.
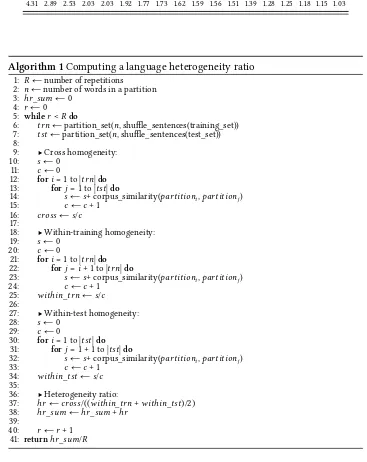
The lower this averaged score is, the more homogeneous the corpus is deemed to be. Here, we adapt this homogeneity score in order to estimate the homogeneity between the training and test sets of a language corpus. This is done by com-puting similarity scores of training set partitions against similarly-sized test set partitions and averaging them together to obtain a single cross-set homogeneity score. The higher this score is, the more heterogeneous the training and test sets are. In order to allow comparisons across languages, this cross-set homogeneity score is normalised by dividing it by the average of the within-training set and within-test set homogeneity scores, calculated from the training and test sets
sep-arately. We call the result of this division, theheterogeneity ratio of a language
corpus. Table 2 sorts the languages by their heterogeneity ratio. The detailed al-gorithm used is listed in Alal-gorithm 1.
Table 2: Heterogeneity ratios between training and test sets
FR TR IT PT RO CS PL HU LT DE FA BG SL ES SV HE EL MT 4.31 2.89 2.53 2.03 2.03 1.92 1.77 1.73 1.62 1.59 1.56 1.51 1.39 1.28 1.25 1.18 1.15 1.03
Algorithm 1Computing a language heterogeneity ratio
1: 𝑅 ←number of repetitions 2: 𝑛 ←number of words in a partition
3: ℎ𝑟_𝑠𝑢𝑚 ← 0
4: 𝑟 ← 0
5: while𝑟 < 𝑅do
6: 𝑡𝑟𝑛 ←partition_set(𝑛, shuffle_sentences(training_set))
7: 𝑡𝑠𝑡 ←partition_set(𝑛, shuffle_sentences(test_set))
8:
9: ▶Cross homogeneity:
10: 𝑠 ← 0
11: 𝑐 ← 0
12: for𝑖 = 1to|𝑡𝑟𝑛|do
13: for𝑗 = 1to|𝑡𝑠𝑡|do
14: 𝑠 ← 𝑠+corpus_similarity(𝑝𝑎𝑟𝑡𝑖𝑡𝑖𝑜𝑛𝑖,𝑝𝑎𝑟𝑡𝑖𝑡𝑖𝑜𝑛𝑗)
15: 𝑐 ← 𝑐 + 1
16: 𝑐𝑟𝑜𝑠𝑠 ← 𝑠/𝑐
17:
18: ▶Within-training homogeneity:
19: 𝑠 ← 0
20: 𝑐 ← 0
21: for𝑖 = 1to|𝑡𝑟𝑛|do
22: for𝑗 = 𝑖 + 1to|𝑡𝑟𝑛|do
23: 𝑠 ← 𝑠+corpus_similarity(𝑝𝑎𝑟𝑡𝑖𝑡𝑖𝑜𝑛𝑖,𝑝𝑎𝑟𝑡𝑖𝑡𝑖𝑜𝑛𝑗)
24: 𝑐 ← 𝑐 + 1
25: 𝑤𝑖𝑡ℎ𝑖𝑛_𝑡𝑟𝑛 ← 𝑠/𝑐
26:
27: ▶Within-test homogeneity:
28: 𝑠 ← 0
29: 𝑐 ← 0
30: for𝑖 = 1to|𝑡𝑠𝑡|do
31: for𝑗 = 1 + 1to|𝑡𝑠𝑡|do
32: 𝑠 ← 𝑠+corpus_similarity(𝑝𝑎𝑟𝑡𝑖𝑡𝑖𝑜𝑛𝑖,𝑝𝑎𝑟𝑡𝑖𝑡𝑖𝑜𝑛𝑗)
33: 𝑐 ← 𝑐 + 1
34: 𝑤𝑖𝑡ℎ𝑖𝑛_𝑡𝑠𝑡 ← 𝑠/𝑐
35:
36: ▶Heterogeneity ratio:
37: ℎ𝑟 ← 𝑐𝑟𝑜𝑠𝑠/((𝑤𝑖𝑡ℎ𝑖𝑛_𝑡𝑟𝑛 + 𝑤𝑖𝑡ℎ𝑖𝑛_𝑡𝑠𝑡)/2)
38: ℎ𝑟_𝑠𝑢𝑚 ← ℎ𝑟_𝑠𝑢𝑚 + ℎ𝑟
39:
40: 𝑟 ← 𝑟 + 1
French is followed by Turkish, Italian, Portuguese and Romanian, with ra-tios around 2. The rest of the languages are closer to 1, reflecting a more bal-anced/homogeneous partitioning between the training and the test corpora. No-tice however that systems participating in French, Turkish, Italian, Portuguese and Romanian did relatively well despite their heterogeneity. Nonetheless, adopt-ing a similar corpus selection and balancadopt-ing policy across languages, like mixadopt-ing the corpora before splitting them into training and test portions in comparable proportions, could be a way to put all languages on a similar footing.
3 Participating systems and baselines
This section focuses on the actual systems in the competition and introduces two baseline systems: (i) a dictionary lookup-based system that attempts to match known VMWEs against the test set, (ii) a system that flags every verb in the test set as a VMWE.
3.1 Overview of participating systems
Seven systems participated in the PARSEME shared task. Their performance was presented and discussed in §2, although not individually. The techniques em-ployed by the different systems can be summarised as follows:
• ADAPT (Maldonado et al. 2017) uses a Conditional Random Fields (CRF) se-quence labelling approach to identify the tokens of VMWEs. The features that helped most were dependency-based: the token’s head, dependency relation with the head and the head’s part of speech (POS) tag, along with standard bigram and trigram features commonly used in named-entity recognisers. The ADAPT system did not attempt to classify VMWEs by category. An extended version of this system is described in Moreau et al. (2018 [this volume]).
• RACAI (Boroş et al. 2017) also employs a CRF sequence labelling approach using lemma and POS tag features. However, this system conducts the VMWE identification task in two steps: head labelling (identifying the verb) and tail labelling (identifying the words linked to the head). The RACAI system does attempt to classify the VMWEs by their category.
the TensorFlow package. As input features, they build embeddings of 100 dimensions from the concatenation of a token’s surface form, lemma and POS tag.
• TRANSITION (Al Saied et al. 2017) is a greedy transition-based system of the kind typically used in parsing. This system does not have a syntax prediction module, however, and focuses on the lexical analysis phase of the parsing mechanism. An extended version of this system is described in Al Saied et al. (2018 [this volume]).
• LIF (Savary et al. 2017) also employs a probabilistic transition-based tech-nique. The team focused on French light-verb constructions.
• SZEGED (Simkó et al. 2017) trains a dependency parser on a modified training set in which the dependency relation label of tokens belonging to a VMWE were relabelled with the corresponding VMWE category la-bel. Simkó et al. (2018 [this volume]) describes an extended version of this system.
• LATL (Nerima et al. 2017) uses a rule-based constituent parser that pri-oritises parsing alternatives of known collocations, and uses its parsing features to detect known collocations even if they are in a different word order or if they are discontinuous.
Not all systems participated in all languages. French was the language covered by most systems. The languages least covered were Bulgarian, Hebrew, Lithua-nian (covered only by MUMULS and TRANSITION) and Farsi (covered by ADAPT and TRANSITION). Since only raw surface tokens and no syntactic dependency information or POS tags were provided for Bulgarian, Hebrew and Lithuanian, most system developers decided not to cover them. The systems that covered most languages were TRANSITION (all 18 languages), ADAPT (15), MUMULS (15), RACAI (12) and SZEGED (9). LATL and LIF focused on French only.
In Token-based evaluation, ADAPT ranked first on two languages (French and Polish), while MUMULS and SZEGED ranked first on Romanian and Hungarian, respectively. In MWE-based evaluation, TRANSITION beat all systems in all lan-guages, except Hungarian (won by SZEGED) and Romanian (won by RACAI and very closely followed by MUMULS).
implementation details. It is interesting to see that, on average (see bottom row in Table 1), ADAPT and TRANSITION performed very similarly in the Token-based evaluation, while MUMULS and RACAI also performed very similarly in the same average evaluation.
3.2 Baseline systems
This section proposes two types of baseline systems that put into perspective the participating systems’ performance. One such baseline system is a simple dictionary lookup, which collects all VMWEs encountered during training and simply attempts to match collected VMWEs in the test set. The other is a baseline system which flags every verb as a VMWE. More details on these two baselines and their results are described in what follows.
Dictionary lookup baseline The implemented system is very simplistic: it
at-tempts to match VMWE lemmas from the training file in the test file sequentially. If lemmas are not available, then the token’s surface form is used. Discontinuous VMWEs are matched in the test file as long as they appear in the same order as in the training file: intervening words are ignored when collecting VMWEs from the training file and when matching VMWEs in the test file. If one VMWE appears in more than one word order in the training file, each word order will be considered to be a separate VMWE. Tokens are marked as belonging to a VMWE only if a full match is detected; partial matches are not flagged. This is to avoid making too many, potentially spurious, partial matches. Embedded/overlapped VMWEs are attempted by using separate VMWE matching automata.
Notice that the maximum performance that can be achieved by this lookup system is determined by the proportion of shared VMWEs between the training and the test set in a language corpus. This proportion of shared VMWEs, indi-cated as percentages under the language labels in Figure 5 and Figure 6, is thus the maximum recall such a system can achieve.
The actual F1 score for the dictionary lookup system described here appears in the BD column in Table 1. It is evident from this table that this simple baseline is quite competitive, beating some of the participating systems in several languages. In fact, it beat all systems on both evaluation modalities in Hebrew, Lithuanian and Polish, and on MWE-based evaluation in German.
Verb baseline As mentioned earlier, this system simply flags each verb in the
This is because no POS tag was provided in these languages’ datasets. So we omit them from this discussion.
For BV, notice that the Token-based F1 scores range between 10 to 47 for most languages. This is a relatively high score range. Table 3 provides precision and recall details for these Token-based scores.
Table 3: Token-based scores for the Verb baseline
Language CS DE EL ES FA FR HU IT MT PL PT RO SL SV TR
P-token 13.57 20.87 5.14 9.58 48.64 11.52 9.29 8.87 3.74 11.42 8.55 6.61 4.17 7.8 6.54 R-token 41.13 45.02 40.85 41.49 46.86 44.13 19.08 38.26 36.81 46.31 44.1 44.3 44.59 43.59 25.97 F1-token 20.41 28.52 9.14 15.56 47.73 18.28 12.49 14.4 6.79 18.33 14.32 11.51 7.63 13.23 10.45
Notice that this baseline’s recall directly depends on each language’s propor-tion of sentences with VMWEs (see Figure 3). Recall is particularly high with most languages scoring around the 40-point mark. We interpret this result as indicating that Token-based scores tend to overestimate systems’ performance. We elaborate on this issue in §4. The recall values in Hungarian and Turkish are considerably lower than in the rest of the languages. This is because there is a
large proportion of VMWEs in these languages that are not tagged with averb
POS tag (this baseline exploits that tag): 74% of VMWEs in Hungarian and 50%
of VMWEs in Turkish do not have a single token with averbPOS tag. Different
teams make different decisions as to what MWEs constituteverbal MWEs. For
example, the Hungarian team informed us that they flag nominalised verbs as VMWEs, even if they are not functioning as verbs anymore.
Given that the verb baseline only labels a single word (a verb) and that VMWEs are made up of at least two words (the verb plus at least another word), the reader might find it puzzling that, in Table 1, the verb baseline (BV) has non-zero MWE-based scores on a few languages. The MWE-MWE-based evaluation modality only re-wards full MWE matches, not partial matches. How is it possible to get non-zero scores on full MWE matches for single-word labels which surely will never form a full match, given that the minimum length of a full VMWE is two words? It turns out that there are VMWEs of one-word length in some languages. This is usually due to linguistic reasons specific to each language in which a single word is consdered composed of more than one unit. In Spanish, for example, re-flexives can sometimes appear separated from the verb and sometimes postfixed
to the verb:ellase levantatemprano‘she gets up early’ vs.es difícillevantarse
4 Evaluation methods
As previously mentioned, system performance was measured on two modali-ties: MWE-based evaluation and Token-based evaluation. Whilst the MWE-based evaluation is an all-or-nothing measure, which might unfairly penalise systems that partially identify correct VMWEs, the Token-based evaluation is intended to compensate for this coarse penalisation by giving partial credit for every word of the identified VMWE. Thus, it is reasonable to expect systems to perform bet-ter on Token-based evaluation than on MWE-based evaluation. Indeed, Table 1 shows that for the most part, Token-based scores are higher than MWE-based scores within every system-language combination, including baseline systems.
By definition, every single VMWE will involve a verb. So, the verb baseline sys-tem is able to make gains on the Token-based F1 score by increasing recall, at the expense of reducing precision. However, if the dataset were less unbalanced (i.e. if it had less VMWE sparsity), the verb baseline would also increase its precision. In addition, the Token-based evaluation gives more weight to longer VMWEs than shorter ones. Matching one VMWE of say four tokens gets the same credit as matching two VMWEs of two tokens each. More credit should perhaps be given for matching more (even if partially) VMWEs than for matching fewer, longer VMWEs.
Even though Token-based scores are expected to be higher than MWE-based scores, the system rankings differ across modalities. Because of these issues, we
cannot categorically say that system 𝐴, which scored higher than system𝐵in
Token-based evaluation, is better at detecting partial VMWEs. It could well be
that system 𝐴 is good at identifying simple verbs and/or long and formulaic
VMWEs but not necessarily at detecting partial VMWEs. One solution would be giving a fraction of a point corresponding to the proportion of a matched VMWE, as well as subtracting a fraction of a point proportional to matched non-VMWE tokens.
On a slightly different note, we would like to propose an alternative evaluation metric: Cohen’s κ measure, which is commonly used to measure inter-annotator agreement. We use it here to measure the degree to which systems agree with
gold standards. The obtained𝜅 score is similar to the MWE-based F1 score, but
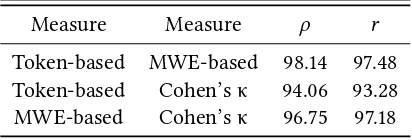
with a correction that removes the possible bias from chance agreement. We compare the similarity between systems’ rankings given by the averaged results per language per performance measure, by reporting their Spearman’s
rank correlation𝜌and Pearson’s moment correlation. As shown in Table 4, the
measures. However, overall, the Token-based and MWE-based measures show
the highest correlation (both in terms of ranking,𝜌, and the relative magnitude of
the assigned scores,𝑟). With respect to Cohen’s κ, while it yields a ranking more
[image:22.482.144.350.212.282.2]similar to the MWE-based measure, the distribution of the assigned Cohen’s κ scores are more similar to the token-based method (i.e., their linear relationship signified by𝑟).
Table 4: Similarity of systems’ ranking per performance measure: Spearman’s𝜌and Pearson’s𝑟are reported to show similarity between systems’ ranking per performance measure.
Measure Measure 𝜌 𝑟
Token-based MWE-based 98.14 97.48
Token-based Cohen’s κ 94.06 93.28
MWE-based Cohen’s κ 96.75 97.18
4.1 On Using the Cohen’s κ as an evaluation score
The use of the F1 score, i.e., the harmonic mean of precision and recall, for evalua-tion can be biased unless certain criteria are met, e.g. that the distribuevalua-tion of anno-tated instances in the test and training data are identical. Since in the PARSEME shared task, the VMWE identification task is reduced to a binary classification problem, Cohen’s κ can be used reliably to obtain a measure of performance that can, at least, cancel out the influence of certain sources of bias. In particular, it penalises the overall score of the systems by the expected chance agreement (as done in the computation of inter-annotator agreement) and takes into account a notion of true negative rate in the overall evaluation of systems (Powers 2012; 2015).
The count of true negative outputs and subsequently true negative rate, how-ever, cannot be computed directly from the evaluation setup and the test set. Sim-ply put, we do not know how many “is this a VMWE?” questions are answered by
a system6(or human annotators) in order to perform the identification task on a
test set (or to manually annotate a corpus). Hence, further assumptions about the problem setting are required to devise the number of true negatives in the respec-tive evaluation contingency table. Here, likewise (Savary et al. 2017), we assume
6This discussion also implies a way to justify the better performance of transition-based systems,
that the total number of stimuli, i.e., the total number of “is this a VMWE?” ques-tions to complete a VMWE identification problem, is approximately equivalent to the number of verbs in the test set (or the corpus which must be annotated).
Given the abovementioned assumption for a test set, let𝑣 be the number of
verbs in the set that are not part of a VMWE. For a system, we define𝑡𝑝and𝑓 𝑝
as being the number of correctly and incorrectly identified VMWEs, respectively,
and𝑓 𝑛 as the number of VMWEs in the test set that are not identified by the
system. If (2)
𝑡 = 𝑡𝑝 + 𝑓 𝑝 + 𝑓 𝑛 + 𝑣
we compute (3)
𝑝𝑜 = 𝑡𝑝 + 𝑣𝑡
𝑝𝑒 = 𝑝0+ 𝑝1
in which (4)
𝑝0 = (𝑡𝑝 + 𝑓 𝑝) × (𝑡𝑝 + 𝑓 𝑛)
𝑡2
𝑝1= (𝑓 𝑛 + 𝑣) × (𝑓 𝑝 + 𝑣)𝑡2
Finally, we compute Cohen’s κ: (5)
𝜅 = 1 − 𝑝𝑜
1 − 𝑝𝑒
and report it as an additional performance measure. Evidently, the suggested method can be refined and improved, e.g., by taking the partial matches between VMWEs (particularly the verbal part) into account.
5 Conclusions
systems to better learn to identify VMWEs. But size is not the whole story. High VMWE sparsity can hinder a system’s performance. However, it can be offset by a large training corpus and, even better, by ensuring that the corpus has many examples of a majority of VMWEs, a property we call good VMWE frequency distribution. Romanian seems to be the language corpus that hits the sweet spot: it is large in size (training and test portions) and it has a good frequency distri-bution, even if it suffers from high VMWE sparsity.
This chapter also showed that the higher the proportion of VMWEs shared between training and test sets, the better the systems will perform. We also saw that it is advisable to design systems capable of detecting discontinuous VMWEs, but we observed that systems would not be significantly penalised for ignoring embedded VMWEs. There was no clear pattern on the effect of the training-to-test proportions on systems’ performance. Shuffling corpora before splitting into training and test portions will also reduce its heterogeneity ratio and help put all languages on a similar footing.
On the evaluation front, we found the token-based evaluation method to over-estimate the performance of systems. As future work, the authors will investi-gate alternative partial-matching measures, especially those that favour number of the detected VMWEs over their lengths. And finally, this chapter described the use of Cohen’s κ metric to produce less biased estimations of systems’ per-formance.
We would also like to recommend shared task organisers to consider applica-tion scenarios of the VMWE identificaapplica-tion task. Different applicaapplica-tion scenarios will dictate different evaluation criteria, corpus selection and priorities. For ex-ample, if VMWEs are being identified to compile a dictionary, perhaps recall should be favoured over precision. If the application is to identify a few but good VMWEs examples for a language learning system, then precision should
be favoured. Evaluation could also be donein vivoin actual parsing or machine
translation systems, which is something the authors will seek to investigate as future work.
The authors hope that the insights and recommendations included in this chap-ter inform future editions of the shared task. At the same time, the authors plan, as future work, to repeat the analysis presented here on the second edition of this dataset, which is being prepared at the time of writing. This will help us determine to what extent our observations generalise to new datasets.
Acknowledgements
We would like to thank the shared task organisers for providing systems’ outputs which were instrumental in some of the analysis presented in this chapter. The ADAPT Centre for Digital Content Technology is funded under the SFI Research Centres Programme (Grant 13/RC/2106) and is co-funded under the European Regional Development Fund. This work is also supported by the DFG (Deutsche Forschungsgemeinschaft) through “Collaborative Research Centre 991 (CRC 991): The Structure of Representations in Language, Cognition, and Science”.
Abbreviations
avg average
bd baseline: dictionary lookup
bv baseline: verb detection
crf conditional random fields
f1 F1 score aka F-measure
κ Cohen’s inter-annotation agreement measure
mwe multiword expression
pos part of speech
𝑟 Pearson’s correlation coefficient
ρ Spearman’s rank correlation coefficient
rnk rank
trn training
tst test
vmwe verbal multiword expression
References
Al Saied, Hazem, Marie Candito & Matthieu Constant. 2018. A transition-based verbal multiword expression analyzer. In Stella Markantonatou,
at length and in depth: Extended papers from the MWE 2017 workshop, 209–226.
Berlin: Language Science Press. DOI:10.5281/zenodo.1469561
Al Saied, Hazem, Matthieu Constant & Marie Candito. 2017. The ATILF-LLF sys-tem for parseme shared task: A transition-based verbal multiword expression
tagger. InProceedings of the 13th Workshop on Multiword Expressions(MWE ’17),
127–132. Association for Computational Linguistics.
DOI:10.18653/v1/W17-1717
Boroş, Tiberiu, Sonia Pipa, Verginica Barbu Mititelu & Dan Tufiş. 2017. A data-driven approach to verbal multiword expression detection. PARSEME shared
task system description paper. InProceedings of the 13th Workshop on
Multi-word Expressions(MWE ’17), 121–126. Association for Computational
Linguis-tics. DOI:10.18653/v1/W17-1716
Kilgarriff, Adam & Tony Rose. 1998. Measures for corpus similarity and
homo-geneity. InProceedings of the 3rd Conference on Empirical Methods in Natural
Language Processing, 46–52.
Klyueva, Natalia, Antoine Doucet & Milan Straka. 2017. Neural networks for
multi-word expression detection. InProceedings of the 13th Workshop on
Multi-word Expressions(MWE ’17), 60–65. Association for Computational Linguistics.
April 4, 2017. DOI:10.18653/v1/W17-1707
Maldonado, Alfredo, Lifeng Han, Erwan Moreau, Ashjan Alsulaimani, Koel Dutta Chowdhury, Carl Vogel & Qun Liu. 2017. Detection of verbal multi-word ex-pressions via conditional random fields with syntactic dependency features
and semantic re-ranking. InProceedings of the 13th Workshop on Multiword
Expressions (MWE ’17), 114–120. Association for Computational Linguistics.
DOI:10.18653/v1/W17-1715
Manning, Christopher D. & Hinrich Schütze. 1999.Foundations of statistical
nat-ural language processing. Cambridge, MA: MIT Press.
Moreau, Erwan, Ashjan Alsulaimani, Alfredo Maldonado, Lifeng Han, Carl Vo-gel & Koel Dutta Chowdhury. 2018. Semantic reranking of CRF label sequences for verbal multiword expression identification. In Stella Markantonatou,
Car-los Ramisch, Agata Savary & Veronika Vincze (eds.),Multiword expressions at
length and in depth: Extended papers from the MWE 2017 workshop, 177–207.
Berlin: Language Science Press. DOI:10.5281/zenodo.1469559
Nerima, Luka, Vasiliki Foufi & Eric Wehrli. 2017. Parsing and MWE detection:
Fips at the PARSEME shared task. InProceedings of The 13th Workshop on
Multi-word Expressions(MWE ’17), 54–59. Association for Computational Linguistics.
Powers, David M. W. 2012. The problem with Kappa. In Proceedings of the 13th Conference of the European Chapter of the Association for Computational
Lin-guistics(EACL ’12), 345–355. Avignon, France: Association for Computational
Linguistics. http://dl.acm.org/citation.cfm?id=2380816.2380859.
Powers, David M. W. 2015. What the f-measure doesn’t measure: Features, flaws,
fallacies and fixes.CoRRabs/1503.06410. http://arxiv.org/abs/1503.06410.
Sag, Ivan A., Timothy Baldwin, Francis Bond, Ann A. Copestake & Dan Flickinger.
2002. Multiword expressions: A pain in the neck for NLP. InProceedings of the
3rd International Conference on Computational Linguistics and Intelligent Text Processing, vol. 2276/2010 (CICLing ’02), 1–15. Springer-Verlag.
Savary, Agata, Marie Candito, Verginica Barbu Mititelu, Eduard Bejček, Fabienne Cap, Slavomír Čéplö, Silvio Ricardo Cordeiro, Gülşen Eryiğit, Voula Giouli, Maarten van Gompel, Yaakov HaCohen-Kerner, Jolanta Kovalevskaitė, Simon Krek, Chaya Liebeskind, Johanna Monti, Carla Parra Escartín, Lonneke van der Plas, Behrang QasemiZadeh, Carlos Ramisch, Federico Sangati, Ivelina Stoy-anova & Veronika Vincze. 2018. PARSEME multilingual corpus of verbal mul-tiword expressions. In Stella Markantonatou, Carlos Ramisch, Agata Savary &
Veronika Vincze (eds.),Multiword expressions at length and in depth: Extended
papers from the MWE 2017 workshop, 87–147. Berlin: Language Science Press.
DOI:10.5281/zenodo.1469555
Savary, Agata, Carlos Ramisch, Silvio Cordeiro, Federico Sangati, Veronika Vincze, Behrang QasemiZadeh, Marie Candito, Fabienne Cap, Voula Giouli, Ivelina Stoyanova & Antoine Doucet. 2017. The PARSEME Shared Task on
auto-matic identification of verbal multiword expressions. InProceedings of the 13th
Workshop on Multiword Expressions(MWE ’17), 31–47. Association for
Compu-tational Linguistics. DOI:10.18653/v1/W17-1704
Simkó, Katalin Ilona, Viktória Kovács & Veronika Vincze. 2017. USzeged: Identi-fying verbal multiword expressions with POS tagging and parsing techniques.
InProceedings of The 13th Workshop on Multiword Expressions(MWE ’17), 48–
53. Association for Computational Linguistics.
Simkó, Katalin Ilona, Viktória Kovács & Veronika Vincze. 2018. Identify-ing verbal multiword expressions with POS taggIdentify-ing and parsIdentify-ing tech-niques. In Stella Markantonatou, Carlos Ramisch, Agata Savary & Veronika
Vincze (eds.), Multiword expressions at length and in depth: Extended
pa-pers from the MWE 2017 workshop, 227–243. Berlin: Language Science Press.
Stefanowitsch, Anatol & Stefan Th. Gries. 2003. Collostructions: Investigating the
interaction of words and constructions.International Journal of Corpus