“EXCESS PROPERTIES OF BINARY MIXTURES OF
ETHANOLAMINE WITH WATER AT DIFFERENT HIGHER
TEMPERATURES”
Gokul P. Borse1*, Dinesh N. Suryawanshi2 and Kiran D. Ahirrao3
1
Department of Chemistry, Rani Laxmibai Mahavidyalaya, Parola, Dist. Jalgaon (M.S.)
India.
2
Department of Physics, Rani Laxmibai Mahavidyalaya, Parola, Dist. Jalgaon (M.S.) India.
3
Department of Zoology, Rani Laxmibai Mahavidyalaya, Parola, Dist. Jalgaon (M.S.) India.
ABSTRACT
Densities and viscosities for binary mixtures of ethanolamine with
water are reported over the entire composition range at temperature
(318.15, 320.15, 322.15, 324.15, 326.15 and 328.15 K). The density
data were used to evaluate excess molar volumes (VE). The
experimental viscosity data were also used to calculate the viscosity
deviations and the excess Gibbs energies (G*E) of activation. All the
binary systems studies showed negative values of excess molar volume
and positive values of viscosity deviation indicating strong hydrogen
bonding interaction for the entire mole fraction.
KEYWORDS: Viscosity deviation, excess molar volumes, Binary
mixtures, free energy, mole fraction.
INTRODUCTION
The thermodynamic properties of a binary mixtures such as density and viscosity are
important from practical and theoretical points of view to understand liquid theory. Their
properties are extremely useful for the design of process equipment in chemical industries.
Binary liquid mixtures due to their unusual behaviour have attracted considerable attention.[1]
In chemical process industries materials are normally handled in fluid form and as a
consequence, the physical, chemical and transport properties associated with the liquids and
liquid mixtures like density and viscosity find extensive application in solution theory and
Volume 6, Issue 6, 597-604. Research Article ISSN 2277– 7105
*Corresponding Author
Dr. Kiran Dhanaji
Ahirrao,
Dept. of Zoology, Rani Laxmibai Mahavidyalaya, Parola, Dist. Jalgaon (M.S.) India.
Article Received on 12 April 2017,
Revised on 03 May 2017, Accepted on 24 May 2017
DOI: 10.20959/wjpr20176-8258
molecular dynamics.[2] Such results are necessary and interpretation of data obtained from
thermochemical, electrochemical, biochemical and kinetic studies.[3] Ethanolamine’s
derivatives are widespread in nature, e.g. lipids. In the present work reports the experimental
values of density and viscosity of the ethanolamine with water measured at the temperature
318.15, 320.15, 322.15, 324.15, 326.15 and 328.15 K. The intermolecular interactions have
been estimated in the light of the excess parameters.
EXPERIMENTAL
Solvents were purified by the standard methods.[4] Ethanolamine (A.R. Grade from S.D. Fine
Chemicals) was double distilled under reduced pressure. Then fraction was stored in dark
coloured bottle and protected against atmospheric moisture and carbondioxide. Conductivity
water was prepared by double distillation of water. The liquid mixtures of various
compositions covering the entire mole fraction were made using single pan balance having
sensitivity 0.1 mg. The prepared mixtures were preserved in air tight narrow ground
stoppered bottles taking due to precautions to minimize the evaporation losses.
Densities of the pure components and their compositions were measured on a vibrating tube
density meter (Anton Paar Model DMA - 5000). The results were reproducible to 1 x 10⁻⁵
gm/cm.[3] This unit offered high temperature accuracy (± 0.001 K) in a wide temperature. The
result calibration was done with air and triple distilled water showing density 0.998212 gm
cm-3 at 20 °C which is closure to literature value.[4] Viscosities were measured at desired
temperature using Ostwald’s Viscometer, which was calibrated using liquids, tripled distilled
water, benzene, toluene (HPCL grade). The flow time has been measured after the attainment
of bath temperature by pure components and their mixtures. The flow measurement were
made with an electronic stop watch (Raser) reading to 0.01 second. The time flow and
densities were measured for every pure component and their mixtures at the interval of 2 °C
between 318.15 to 328.15 K.
CALCULATIONS
From the experimental data of density and viscosity, various thermodynamics parameter were
evaluated using Standard equations mentioned below:
Excess Molar Volume[5,6]
VE =
x1 M1x2 M2
x1V1x2V2
Where, x1 and x2 are mole fractions, M1 and M2 the molecular weights and V1 and V2 are the
molecular volumes of ethanolamine (1) + water (2). is the density liquid mixture.
Viscosity deviations
= – (x11 + x22) ---- (2)
Where, 1 and 2 viscosities of ethanolamine (1) + water (2), viscosity of mixture.
Gibbs energies (G*E
) of activation of viscous flow[7]
RT
G*E
= 2 2 1 1 1 2 2 ln ln V V x V V --- (3)
Where V, V1, V2 – are the molar volumes the binary mixture and pure components.
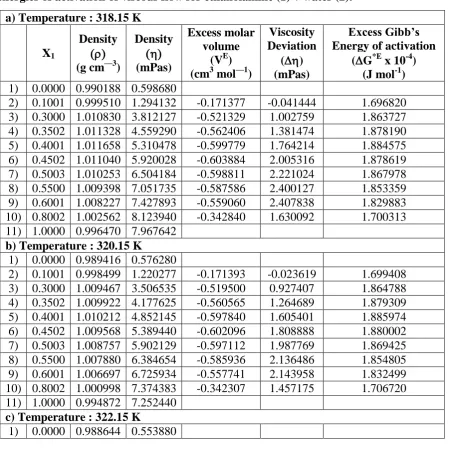
Table 1: Densities, viscosities, excess molar volume, excess viscosities and Gibb’s
energies of activation of viscous flow for ethanolamine (1) + water (2).
a) Temperature : 318.15 K
X1
Density (g cm—3)
Density (mPas)
Excess molar volume
(VE) (cm3 mol—1)
Viscosity Deviation
() (mPas)
Excess Gibb’s Energy of activation
(G*E
x 10-4) (J mol-1)
1) 0.0000 0.990188 0.598680
2) 0.1001 0.999510 1.294132 -0.171377 -0.041444 1.696820 3) 0.3000 1.010830 3.812127 -0.521329 1.002759 1.863727 4) 0.3502 1.011328 4.559290 -0.562406 1.381474 1.878190 5) 0.4001 1.011658 5.310478 -0.599779 1.764214 1.884575 6) 0.4502 1.011040 5.920028 -0.603884 2.005316 1.878619 7) 0.5003 1.010253 6.504184 -0.598811 2.221024 1.867978 8) 0.5500 1.009398 7.051735 -0.587586 2.400127 1.853359 9) 0.6001 1.008227 7.427893 -0.559060 2.407838 1.829883 10) 0.8002 1.002562 8.123940 -0.342840 1.630092 1.700313 11) 1.0000 0.996470 7.967642
b) Temperature : 320.15 K
1) 0.0000 0.989416 0.576280
2) 0.1001 0.998499 1.220277 -0.171393 -0.023619 1.699408 3) 0.3000 1.009467 3.506535 -0.519500 0.927407 1.864788 4) 0.3502 1.009922 4.177625 -0.560565 1.264689 1.879309 5) 0.4001 1.010212 4.852145 -0.597840 1.605401 1.885974 6) 0.4502 1.009568 5.389440 -0.602096 1.808888 1.880002 7) 0.5003 1.008757 5.902129 -0.597112 1.987769 1.869425 8) 0.5500 1.007880 6.384654 -0.585936 2.136486 1.854805 9) 0.6001 1.006697 6.725934 -0.557741 2.143958 1.832499 10) 0.8002 1.000998 7.374383 -0.342307 1.457175 1.706720 11) 1.0000 0.994872 7.252440
c) Temperature : 322.15 K
[image:3.595.75.526.329.784.2]2) 0.1001 0.997477 1.146433 -0.171136 -0.005793 1.706114 3) 0.3000 1.008103 3.200972 -0.517546 0.852054 1.866699 4) 0.3502 1.008516 3.795989 -0.558614 1.147898 1.881090 5) 0.4001 1.008766 4.393852 -0.595775 1.446588 1.887754 6) 0.4502 1.008096 4.858898 -0.600167 1.612461 1.881616 7) 0.5003 1.007261 5.300124 -0.595256 1.754514 1.870917 8) 0.5500 1.006362 5.717627 -0.584112 1.872844 1.856314 9) 0.6001 1.005167 6.024036 -0.556235 1.880080 1.834365 10) 0.8002 0.999418 6.624907 -0.341525 1.284259 1.709727 11) 1.0000 0.993278 6.537340
d) Temperature : 324.15 K
X1
Density (g cm—3)
Density (mPas)
Excess molar volume
(VE) (cm3 mol—1)
Viscosity Deviation
( (mPas)
Excess Gibb’s Energy of activation
(G*E
x 10-4) (J mol-1)
1) 0.0000 0.987872 0.531480
2) 0.1001 0.996456 1.072568 -0.170919 0.012032 1.712357 3) 0.3000 1.006739 2.895349 -0.515627 0.776701 1.870529 4) 0.3502 1.007109 3.414283 -0.556671 1.031107 1.884338 5) 0.4001 1.007320 3.935480 -0.593756 1.287776 1.890903 6) 0.4502 1.006623 4.328265 -0.598252 1.416033 1.884055 7) 0.5003 1.005765 4.698019 -0.593458 1.521259 1.875808 8) 0.5500 1.004844 5.050490 -0.582352 1.609202 1.858186 9) 0.6001 1.003637 5.322018 -0.554800 1.616202 1.837535 10) 0.8002 0.997846 5.875271 -0.340842 1.111343 1.719454 11) 1.0000 0.991682 5.82204
e) Temperature : 326.15 K
1) 0.0000 0.987100 0.509080
2) 0.1001 0.995434 0.998713 -0.170684 0.029857 1.718107 3) 0.3000 1.005376 2.589756 -0.513738 0.701348 1.871172 4) 0.3502 1.005703 3.032612 -0.554760 0.914316 1.884361 5) 0.4001 1.005874 3.477147 -0.591734 1.128963 1.890728 6) 0.4502 1.005151 3.797678 -0.596373 1.219606 1.883137 7) 0.5003 1.004269 4.095963 -0.591657 1.288003 1.871290 8) 0.5500 1.003326 4.383409 -0.580589 1.345561 1.856538 9) 0.6001 1.002107 4.620059 -0.553363 1.352323 1.837005 10) 0.8002 0.996274 5.125714 -0.340157 0.938426 1.724266 11) 1.0000 0.990086 5.10684
f) Temperature : 328.15 K
1) 0.0000 0.986328 0.486680
9) 0.6001 1.000577 3.918101 -0.551922 1.088445 1.833163 10) 0.8002 0.994702 4.376158 -0.339470 0.76551 1.727340 11) 1.0000 0.98849 4.39164
-0.7 -0.6 -0.5 -0.4 -0.3 -0.2 -0.1 0
0.00 0.20 0.40 0.60 0.80 1.00
X1
V
E (c
m
3 m
ol
-1 )
[image:5.595.77.527.69.324.2]318.15 K 320.15 K 322.15 K 324.15 K 326.15 K 328.15 K
Fig. 1: Excess molar volume (VE) for the system of ethanolamine (1) + water (2) from 318.15 K to 328.15 K.
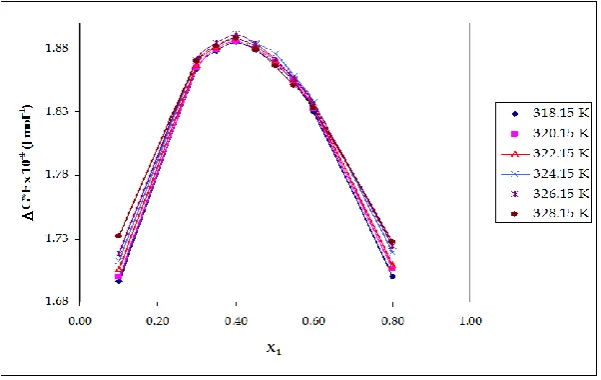
[image:5.595.144.453.375.579.2]Fig. 3: Excess Gibbs energy of activation DG*E for ethanolamine (1) + water (2) from
318.15 K to 328.15 K.
RESULTS AND DISCUSSION
The experimental values of density () and viscosity () and calculated values of VE, , and
G*E of pure liquids and for the binary liquid systems at 318.15, 320.15, 322.15, 324.15,
326.15, and 328.15 K are given in Tables 1.
The excess properties are found to be more sensitive towards intermolecular interaction
between the component molecules of liquid mixtures. The sign and extent of deviation of
excess properties depends on the strength of interaction between unlike molecules.[9]
The graphical variation of excess molar volume (VE) for binary mixtures of ethanolamine
with water at 318.15, 320.15, 322.15, 324.15, 326.15 and 328.15 K is shown in Fig. 1. The
values of excess molar volume are found to be negative for all the systems. The existence of
specific interactions between the mixing components of the various binary systems tends to
make excess molar volume negative.[10] The plots of VE against x1 are of parabolic shape
characterized by well defined minimum occurring at x1 0.45 indicating the presence of
complex formation.[11] It is observed that, the changes the excess molar volume values are
nearly same in the temperature region 318.15 K to 328.15 K.
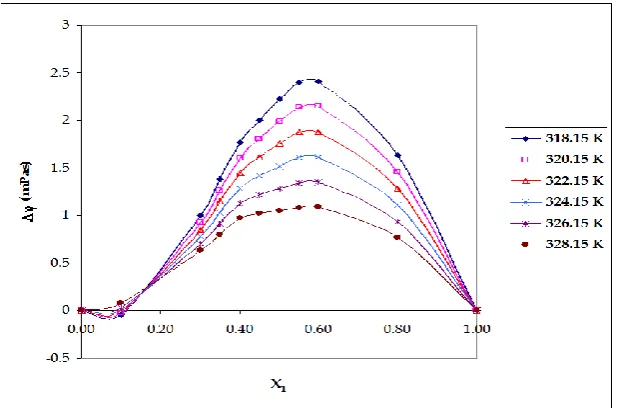
Fig. 2 shows the graphical variation of viscosity deviation () for the binary mixtures of
ethanolamine with water with increasing mole fraction of ethanolamine at 318.15, 320.15,
322.15, 324.15, 326.15, and 328.15 K. The value of viscosity deviation negative at low mole
deviation indicates the predominance of specific hydrogen bonding interaction between
unlike molecules (to form adduct between them) over the dissociation effect in the system.[12]
Excess energy of activation for viscous flow are shown in Fig. 3. The observed G*E values
are positive for the entire mole fraction of ethanolamine. Large positive values indicate the
specific interaction leading to complex formation through intermolecular hydrogen bonding
interaction between unlike molecules compared to like molecules.[13]
CONCLUSION
Experimental data of the density and viscosity of ethanolamine and water mixtures have been
measured over the entire composition range at 318.15, 320.15, 322.15, 324.15, 326.15 and
328.15 K. It has been observed that negative deviations were observed for excess molar
volume (VE) and positive deviation were observed for viscosity deviation () and positive
values of excess energy of activation for viscous flow (G*E). The result of excess properties
reveal that the strong molecular interaction between the mixing components.
ACKNOWLEDGEMENT
Authors sincerely acknowledge their thanks to the Guide, Management and Principal of R.L.
College, Parola, Dist. Jalgaon (India) for their permission and encouragement during the
research work.
REFERENCES
1. Kapdi VR, Hundiwale DG, Patil NB, Patil PR, Lande MK, J. Indian Chem. Soc., 2000;
77: 319-321.
2. Oswal SL, Desdai HS, Fluid Phase Equil, 1998; 149: 359-376.
3. Kenart C, Kenart M, Phys. Chem. Liq, 2000; 38: 155-180.
4. Dean JA, Lange’s Handbook of Chemistry, McGraw-Hill, 13th Edition, 600 (Chapter 7).
5. Reddy VK, Rambau K, Devarajula T, Krishanaiah A, J. Chem. Eng. Data, 1995; 40:
124-127.
6. Borse GP, Patil SR, Deshpande UG, Hiray AR, der Chemica Sinica, 2012; 3(6):
1438-1443.
7. Bearman RJ, Jones PF, J. Chem. Phys., 1960; 33: 1432-1438.
8. Eyring H, John MS, Significant liquid structure, Wiley, New York, 1969.
10.Saravanakumar K, Lavanya TG, Baskaran R, Kubedran TR, Russian T. of Phy. Chem, A,
2012: 86; 586-576.
11.Cowie JMG, Toporoswki PM, Can. J. Chem., 1961; 39: 2240.
12.Baskaran R, Kubendran TR, Int. J. App. Sci. and Eng., 2009; 7(1): 43-52.
13.Kapdi UR, Hundiwale DG, Patil NB, Lande MK, Patil PR, Fluid phase equilibria, 2001;