The Incorporation of Graduates from Higher
Technological Education into the Labor Market
Christos Koilias1, Vassilis Kostoglou2, Aristogiannis Garmpis3, Beatrice van der Heijden4,5
1Department of Informatics, Technological Educational Institute (TEI) of Athens, Athens, Greece; 2Department of Informatics,
Al-exander TEI of Thessaloniki, Thessaloniki, Greece; 3Department of Applied Informatics in Administration and Economy, TEI of
Messolonghi, Messolonghi, Greece; 4Instititute for Management Research, Radboud University, Nijmegen, the Netherlands; 5Open
University of the Netherlands, University of Twente, Enschede, the Netherlands.
Email: contact@newtech-publications.gr, vkostogl@it.teithe.gr, agarbis@teimes.gr, b.vanderheijden@fm.ru.nl Received November 18th, 2010; revised December 27th, 2010; accepted December 28th, 2010.
ABSTRACT
Higher technological education graduates constitute one of the most important and promising newcomers at the labor market. A smooth and successful vocational socialization of this category of future workers is one of the primary targets of educational systems, and policy makers at both; a national and a European level. This article focuses on the incor-poration process of graduates from Greek higher technological education in the labor market. Original empirical data has been collected through a national survey using a newly developed structured questionnaire that has been addressed to a large representative sample of graduates from 11 Technological Educational Institutes. The resulting sample con-sisted of 5,183 respondents corresponding to 9 broader groups of specialties consisting of 51 professions requiring four-year higher education. Statistical analyses have been used to determine the main parameters of successful voca-tional socialization. The main outcomes of this research study indicate that gender, specialty of bachelor degree and postgraduate education are the most important factors affecting significantly the status and quality of graduates’ in-corporation into the labor market. This contribution concludes with a reflection upon the main results, as well as some recommendations for further research.
Keywords: Graduates, Higher Technological Education, Human Resources, Labor Market, Greece
1. Introduction
Graduates of higher technological education comprise one of the largest and most important parts of the new coming human resource in the Greek labor market. The new globalized economic and work setting has affected significantly the labor market and the growing demand for personnel skilled in technological issues. Obviously, it is highly important to better understand the quality of vocational socialization of graduates from higher tech-nological educational institutes (TEI). In-depth informa-tion about the identificainforma-tion of the professional profile of TEI graduates is considered, and the success of the voca-tional incorporation process to be the basis for the forma-tion of appropriate policies for a successful labor market entrance.
One of the main issues of attention concerns the char-acter of vocational incorporation, as in the past a smooth incorporation into the labor market after higher education was just taken for granted, and the sole interest was the
To conclude, the main objective of this study is to examine the vocational socialization process of TEI gra-duates by means of an extensive analysis of the responses of a large-scale representative large national sample of graduates of five consecutive years. The principal vari-ables examined are related to the professional status of graduates once they have entered the labor market, as well as the variables describing their qualitative percep-tions of their incorporation process.
At national level this work is one of the very first ef-forts to approach the analysis of graduates’ vocational socialization through a large-scale survey. Karamesini was the first one to publish on the first national survey on the incorporation of university graduates in the labor market [5]. Up to now, only two studies have been pub-lished dealing particularly with higher technological education; the first one in national level and the second in institutional and departmental [6,7].
Regarding the structure of this paper, next section deals with the theoretical background of the examined issues. The methodology adopted for the collection and analysis of our empirical data is outlined in section 3. The fourth section of this contribution reports the results of the participating graduates’ main employment charac-teristics. For sake of clarity, this section is divided in seven subsections referring to different aspects of voca-tional socialization. The last section summarizes the main results; comes up with recommendations for future research, and concludes with some practical implications.
2. Theoretical Background
The economic crisis that started in the early ‘70s, and that is still prevalent up to now, had some direct conse-quences for the labor market. New types of occupation have been created, and the transition from education to employment was affected significantly. Enterprises, in their effort to react to the slowing down of their eco-nomic growth, and to the decrease of demand of products and services, adopted alternative types of employment for their personnel. Nowadays, part-time employment, hetero-employment (that is work not vocationally related to the subject of study) and temporary work are com-monly used labor market practices in all developed economies [8]. These economic changes also affected the entrance of the labor market. More specifically, their entrance in the market is delayed significantly in com-parison with the situation 25 years ago. Additionally, during the last two decades, the participation of students in higher and postgraduate education is much higher (over-education). Therefore, in most occasions, the voca-tional socialization takes place several years after gradu-ating from secondary education [9]. The time interval for the transition from education to work has been prolonged
as well. Firstly, the ways for finding a job are now quite different, and secondly, the new generation has many more professional experiences until the actual vocational socialization takes place [10]. The previously mentioned transition period often includes part-time work and/or hetero-employment experiences, periods of unemploy-ment, subsidized work positions, and, frequently, getting back into education or vocational training in order to increase one’s chances for getting a more relevant and better paid job [11,12].
The phenomena that have been outlined above, and that are related to increased unemployment and difficult entrance to the labor market created significant societal and scientific interest. The scientists focused their efforts on studying the obstacles for vocational socialization of youngsters, determining hindering factors, the ways used for getting a job, the required skills, to mention but a few approaches [13,14]. However, as the conditions in the labor market have changed, and the transition to the world of work has new characteristics, economists and sociologists have started examining the ways and the paths of the transition, and the amount of time that is needed to complete a successful incorporation process in the labor market [15].
On the other hand, sociological approaches focus on the issue of social origin as the main factor influencing the educational and vocational choices of graduates. Some new elements that have been added to the theo-retical and empirical arguments aimed at explaining in-corporation comprise the characteristics of higher educa-tion institutes, and the provided specialties, the statutory framework for vocational socialization, the development of active employment types from the state, and the role of the public sector in the market [9,11].
3. Research Methodology
This section goes into the sample and procedure of the study, as well as into the statistical techniques used. Original empirical data was collected in the second se-mester of 2009 from the Career Offices of the Greek TEI which carried out institutional surveys at an earlier stage (during 2007 and 2008). Every establishment of higher education was asked to collect information at the same time period, by approaching persons who graduated in a specified time interval (1997-2001), and by using the survey tool designed for this purpose. For statistical rea-sons (homogeneous and comparable results), only gradu-ates from institutions that exactly followed the above- mentioned prerequisites in the data collection process were included in the final sample.
The method used for the analysis was telephonic inter-view through the use of a structured questionnaire spe-cially prepared for this purpose. The questionnaire used consists of 43 closed, pre-coded questions and is divided in three parts: 1) personal and demographic issues of the respondents (11 questions); 2) educational issues (11 questions); and 3) employment issues and the incorpora-tion of the graduates in the labor market (21 quesincorpora-tions). Graduates of 11 TEI were included in this study yielding a total of 5,183 valid questionnaires. The final sample consists of graduates from 9 broader specialties consist-ing of 50 different professions. Detailed samplconsist-ing infor-mation is presented in Table 1.
The tools used for the statistical analyses were SPSS (the Statistical Package for the Social Sciences), as well as using MS-Excel for data visualization. Graduates’ responses were analyzed by means of both descriptive and inferential statistics. As this paper focuses on report-ing the general findreport-ings at a national level, and on the detection of the existing relationships between the vari-ables involved, emphasis has been given to the descrip-tive statistics. The X2 test has been used for the examina-
tion of the statistical dependence between two variables.
4. Results and Analysis on the Employment
Characteristics
[image:3.595.309.538.101.301.2]The first two parts of this section go into some basic
Table 1. Broader specialties and corresponding sample sizes.
Specialty professions Number of Samplesize Percentage(%)
Agriculture 6 534 10
Graphics and Arts 5 167 3
Management and Economics 7 1709 33
Care & Welfare 3 95 2
Health Technology 4 149 3
Health 6 873 17
Food and Nutrition 3 157 3
Engineering 14 1079 21
Information Technologies 3 420 8
Total 51 5183 100
demographic and educational information, and some main employment issues of graduates, respectively. The third part focuses on the graduates who managed to find employment. The fourth sub section goes into self-em- ployed graduates, while the fifth section goes into unem-ployed graduates. In the sixth part, some other issues of vocational socialization are reported. Finally, the out-comes of the relationships between all study variables are reported in the seventh sub section.
4.1. Demography and Education
The variables that were included in the statistical analysis are: gender, marital status, duration of studies, degree grade, postgraduate education, and knowledge of foreign languages.
According to the results of the survey, women consti-tute the majority (58%) in the examined sample, whereas men comprise 42% of the graduates in the years 1997- 2001. However, significant diversifications between the universities are noticed due to their very different com-position regarding their fields (departments) of studies. 52% of the graduates are married, with a statistically significant difference according to gender; 60% of women are married while only 40% of the men are married (Χ2 =
194.80 > 3.84).
the women); 2) a “very good” mark (6.5-8.4) for 54% of the graduates (46% of the men and 59% of the women); and 3) for only 3% of the graduates (2% of the men and 5% of the women) enjoy an honors degree (8.5-10). There is a significant difference between men and wom-en (X2 = 145.64 > 5.99). The latter achieve better final
degree grades.
Nowadays, further education (additional education af-ter the first degree) with the acquisition of postgraduate or other kinds of degrees is a usual practice for graduates in order to find a better work position, to remain active in the market, and, most importantly, to improve their pro-fessional status. Seven to eleven years after graduation, 11.4% of the graduates have completed postgraduate studies in Greece (6.1%) or abroad (5.3%). The percent-age of men who have acquired additional education is almost double than that of women (16% and 9%, respec-tively). However, it is estimated that, at present, this per-centage has already risen significantly due to the massive increase of provided postgraduate studies during the last decade in Greece.
Graduates portray a significant knowledge of foreign languages. English is by far the most popular foreign language as it has been reported by 94% of the graduates; 19% of them reported excellent knowledge and 36% a very good knowledge. Two thirds of them (66%) have acquired a relevant degree. French, German and Italian have also focused the interest of some of the graduates (13%, 10%, and 9% respectively). Only 5% of the gra-duates do not speak any foreign language.
4.2. Main Employment Issues
[image:4.595.308.537.635.722.2]Seven to eleven years after graduation, nearly nine out of ten graduates (88.5%) were employed at the time of the study. Nearly 75% are employees and 14% are self-em- ployed. Unemployed graduates come up to 7.4%, and inactive ones (that is, not available for the labor market) come up to 4.1%.
Table 2 shows the employment status in relation to gender. The percentage of self-employed men appears to be double compared to that of women (20% versus 9% respectively). The situation regarding the lack of a working position is the opposite: women’s unemploy-ment rate is over twice as high as men’s, and the rate of
Table 2. Employment status in relation to gender.
Gender Employed Self-employed Unemployed Inactive
Men 74% 20% 4% 2%
Women 76% 9% 10% 6%
Total 75% 14% 7% 4%
inactive women is triple compared to that of men. These differences are statistically significant (X2 = 207.37 >
7.81). From a recent labor force survey, conducted by the National Statistical Service of Greece, it was found that the mean unemployment rate of higher education gradu-ates of similar age groups as the gradugradu-ates in this survey was 9.15% [23]. Thus, it can be argued that the unem-ployment of TEI graduates is lower in comparison with the overall graduates’ unemployment rate. Moreover, the professional status of graduates is significantly depend-ent on other variables apart of the year of graduation. A higher percentage of single graduates are employed (3% more) in comparison with the married ones. The unem-ployment rates are about equal (~7%). Nevertheless, married graduates, mainly women, are more often unem-ployed (2% more) in comparison with singles. Thus, there is a moderate association between employment and marital status (X2 = 18.23 > 7.81).
The bachelor degree grade seems to play an important role in the professional status of graduates (X2 = 57.19 >
7.81). The unemployment and inactivity rates do not dif-ferentiate; there is however a significant difference in self-employment rates. A very good or excellent degree grade gives graduates more confidence and, subsequently, success in competitive processes (such as, interviews, employment exams, tests, etc) aimed at obtaining a suit-able work position. Graduates who have had fair marks during their bachelor studies tend to turn more to self- employment. There is also a moderate significant asso-ciation between professional status and postgraduate studies (X2 = 14 > 7.81). The unemployment rate of
[image:4.595.57.287.651.721.2]graduates who have not acquired a postgraduate degree is double compared to their counterparts who do have ob-tained a postgraduate degree (8% versus 4%).
Table 3 presents the type of employment of working TEI graduates according to gender. The vast majority of them (81%) are full-time employees. Only 4% work on a part-time basis. This small proportion in combination with the significant unemployment and inactivity rates strongly indicate that flexible types of work are not pop-ular yet in Greece. 15% of these graduates are self- emoyed, and most of them (9% of the working popula-tion) work alone.
Table 3. Type of employment according to gender.
Gender employeeFull time Employee Part time
Self-employed with employees
Self-employed without employees
Men 76% 3% 9% 12%
Women 84% 5% 3% 7%
The type of employment appears to depend signifi-cantly on gender, institution of graduation, field of spe-cialty, and degree grade. On the other hand, marital sta-tus, year of graduation, and postgraduate studies ap-peared not to have an effect.
4.3. Employed Graduates
The analysis below focuses on the largest category of the examined sample, that is, the full-time employees. Im-portant employment variables, such as the relationship between employment and studies, the ways of finding the present position, wages, the satisfaction with one’s job and salary, as well as other main issues related to voca-tional socialization are examined.
A ‘relevance index’ (Ci) has been introduced for the
analysis of the relationship between employment and bachelor studies (1).
Ci equals to
5 5
1 1
* i
i i
P i P
i (1)where Piis the number of graduates reporting that the
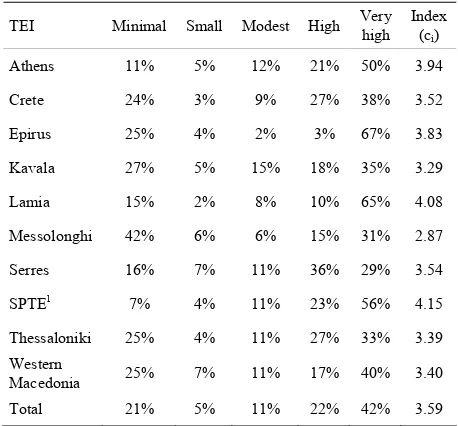
relevance between employment and studies is in the cat-egory of a five-point rating scale (1 = minimal, 2 = small, 3 = modest, 4 = high and 5 = very high). The results of this analysis are presented in Table 4. It is worth noting that the index has not been introduced for marking the institutions but only for measuring the mean correspon-dence degrees. Nearly two thirds of the graduates (64%) declared that their present job has a high or very high relationship with their studies. There is, however, quite a high proportion (21%) of graduates, whose employment is completely different than their initial studies, showing the existence of significant hetero-employment, a grow-ing phenomenon in the European Union, especially in its Mediterranean members states [24]. The highest index value is reported by the graduates of SPTE (4.18), and the lowest for those of Messolonghi(2.87).The existing discrepancies in the value of ci are partially justified by
[image:5.595.308.537.111.324.2]the different specializations offered by the various insti-tutions.
Table 5 presents the ways used by the participating graduates for finding their present work position. The most important channel, used by nearly 40% of the em-ployed graduates, comprises participation in (most usu-ally public) examinations. The use of acquaintances, and media announcements are also quite often reported (24% and 16%, respectively). On the opposite, some statutory channels, such as the compulsory six-month practical training, the Greek Manpower Employment Organization, and the institutional Career Offices do not seem to be popular or efficient channels for getting a working posi-tion; in total, they are only used by 8% of the graduates. It is interesting to find out that 13% of the graduates de-
Table 4. Relevance between employment and studies for each TEI.
ΤΕΙ Minimal Small Modest High Very high Index (c
i)
Athens 11% 5% 12% 21% 50% 3.94
Crete 24% 3% 9% 27% 38% 3.52
Epirus 25% 4% 2% 3% 67% 3.83
Kavala 27% 5% 15% 18% 35% 3.29
Lamia 15% 2% 8% 10% 65% 4.08
Messolonghi 42% 6% 6% 15% 31% 2.87
Serres 16% 7% 11% 36% 29% 3.54
SPTE1 7% 4% 11% 23% 56% 4.15
Thessaloniki 25% 4% 11% 27% 33% 3.39
Western
Macedonia 25% 7% 11% 17% 40% 3.40
Total 21% 5% 11% 22% 42% 3.59
[image:5.595.310.537.365.503.2]1SPTE: School of Pedagogical and Technological Education.
Table 5. Channels for finding current position.
Channel used % of graduates
Career offices 1%
Practical training 4%
GMEO1 3%
Media announcements 16%
Acquaintances 24%
Examinations 39%
Other 13%
1GMEO: Greek Manpower Employment Organization.
clared the use of another, not specified, channel.
Almost two thirds (63%) of the employed graduates are highly (37%) or very highly (26%) satisfied with the content of their present job. Only 17% of them appeared to express dissatisfaction, having reported minimal (13%) or small (4%) satisfaction. There were no significant dif-ferences between men and women. However, we have found some statistically significant difference between the graduates of different institutions (X2 = 184.93 >
51.00).
noted between men and women are impressive. The per-centage of women in the lowest payment category is double compared to men (24% versus 12%), whereas the difference in the highest two categories is almost quad-ruple (3% versus 12% aggregately). Considering as mean value of the first category the amount of € 700 and of the last one € 2850, it has been calculated that the mean monthly net payment of the total sample equals to € 1150. The graduates of the two TEIs (Athens and SPTE) situ-ated in the district of the capital Athens, enjoy the highest mean monthly payment (€ 1234 and € 1215 respectively). The lowest one corresponds to graduatesof the TEI of Thessaloniki (€ 1086). However the significant time dif-ference (nearly one and a half years) in the collection of the corresponding questionnaires explains and probably smoothes out these wage differences.
The degree of satisfaction with one’s monthly salary is significantly lower compared with the satisfaction with one’s present position. Only 37% of the graduates appear to be highly (29%) or very highly (8%) satisfied with their salary, an almost equal percentage reports modest satisfaction (38%), while remaining 25% appear to be dissatisfied.
4.4. Self-Employed Graduates
Self-employed graduates constitute nearly one seventh (13.6%) of the total sample. More than six out of ten (61.6%) of the self-employed graduates are men. Taking into account the gender distribution of all graduates (women 58% versus men 42%), it implies that the per-centage of men turning to self-employment is double than that of women. Eleven per cent of the self-employed graduates have acquired a postgraduate degree. Forty per cent of them have established their own enterprise; the others work as free-lancers. Table 6 presents their ana-lytical numbers and percentages for all TEIs.
[image:6.595.307.540.100.313.2]Most self-employed graduates (62%) have declared that they established their own enterprise after their gra- duation, whereas 30% work in their own family’s enter-prise. Eight per cent of the self-employed graduates have mentioned other ways of enterprise establishment. The majority of the enterprises (78%) employ one to five em-ployees, 21% of them employ six to 50 emem-ployees, and there are two enterprises employing 80 and 150 persons. Nearly half of the self-employed graduates (49%) have been financed by family funds, 13% by bank loans, 12% by national or EU entrepreneurship support programs, and 26% by means of several other sources. Nevertheless, the satisfaction degree of the graduates who decided to establish an enterprise with employees, or who decided to work independently as free-lancers without personnel is significantly higher compared to that of the employed graduates. It is obvious that the satisfaction of the self-
Table 6. Self-employed graduates according to each TEI.
Numbers of self-employed graduates ΤΕΙ Enterprise
owners Free-lancers Total %
Athens 45 110 155 22%
Crete 36 8 74 10%
Kavala 41 37 78 11%
Lamia 13 15 28 4%
Messolonghi 9 19 28 4%
Serres 22 43 65 9%
SPTE 10 9 19 3%
Thessaloniki 74 122 196 28%
Western Macedonia 27 28 55 8%
Total 282 426 708 100%
employed graduates is high; 86% reports an adequate (50%) or high (36%) degree of satisfaction. Only 14% of the self-employed graduates consider themselves as dis-satisfied.
4.5. Unemployed Graduates
The analysis of the outcomes given by the unemployed graduates includes some main demographic and educa-tional issues, as well as some relevant work-related pa-rameters, such as the previous working experience, the unemployment interval, the most popular channels for getting a job, and the estimated reasons of unemployment. The statistical significance of the relationships between some of the variables is also examined and reported on.
Out of the 7.4% unemployed graduates, 77% are women, and only 23% are men, indicating a strong sig-nificant effect of gender, and the inferior position of women at the labor market. The vast majority of unem-ployed men are single (81%), whereas the opposite ap-pears to be the case for women: 62% of them are mar-ried.
The percentage of unemployed graduates per year of graduation (1997-2001) is gradually increasing over time, with no significant differences. This has been considered as reasonable due to the time difference until the period of the survey. Nevertheless, there are no significant dif-ferences according to gender (X2 = 2.99 < 9.49).
Obtaining a bachelor degree final grade does not ap-pear to play an important role in preventing unemploy-ment. Nevertheless, only 6% of the unemployed gradu-ates hold a postgraduate degree. The number of men among them is significantly higher (X2 = 10.78 > 5.99).
reported that they have worked in the past. No significant differences according to gender or marital status have been found (X2 = 3.40 < 3.84 and X2 = 0.08 < 3.84
re-spectively). More than a third of the unemployed gradu-ates (35%) were without work for more than 2 years at the time of the study, 18% was unemployed for 12-24 months, 20% for 6 to 12 months, and the remaining 27% was unemployed for the last 6 months. The mean dura-tion of the unemployment period, among the graduates of the different institutions, varies significantly (from 9 to 24 months). Moreover, there is a correlation with the specializations offered.
Only 23% of the unemployed graduates with profes-sional experience were receiving an unemployment ben-efit at the time of the national survey. The corresponding time intervals of the unemployment benefit payment are variable with a high standard deviation.
The majority of unemployed graduates (58%) strive for a position directly related to their studies, quite a few (21%) look for any sort of job in order to be employed, and some others (12%) would like to get a job giving perspectives to use the knowledge they acquired from their first degree.
The unemployed handle the same channels for finding a working position as the ones used by the employed graduates when seeking for their present job. However, the degree of their use is quite different. The unemployed, more frequently, use the services of public services like GMEO and institutional Career Offices (23% and 4% versus only 3% and 1% for working graduates respec-tively), and pay more frequently attention to media an-nouncements (26% versus 16%). On the other hand, they have less confidence in participating in examinations (20% versus 39%).
The principal reason for the lack of employment ap-pears to be the existing high unemployment in the sector, being reported by over one third (36%) of the unem-ployed respondents, followed by the lack of efficient procedures for approaching the labor market (21%). Moreover, some secondary reasons, such as a wrong professional orientation, lack of required specialization, and inability to follow a full-time job have been reported too (by 6%, 9%, and 8% of the respondents respectively). Nearly a fifth of the unemployed graduates (19%) re-ported other, no specified, reasons.
4.6. Other Issues of Vocational Incorporation
The analysis of graduates’ responses reveals that less than one third of them (32%) stay in their first work po-sition showing a significant professional mobility after graduates’ first employment. For the calculation of the average waiting time for finding one’s first job, the se-lected sample was split into two parts; 1) comprising the
graduates that remain in their first job, and 2) the ones that changed jobs, at least once, since graduation.
From the graduates remaining in their first job, 43% are men, and 57% women. 16% of them found their pre-sent job whilst they were still students, and 23% found their first job during graduation. Women surpass men in both these sub categories (59% versus 41%, for the ones who found that job whilst still being a student, and 67% versus 33%, for the ones who found their first job during graduation, respectively). The first finding is interesting, whereas the second is in line with expectations due to the compulsory military obligations for men. Taking into account all sub categories, it was calculated that the mean waiting time for finding one’s first job is 1.6 years (1.9 years for men, and 1.3 years for women).
Employees who have changed jobs, at least once, were asked about the waiting time for obtaining their first po-sition. Their mean waiting time appears to be 9 months (12 months for men and 7 months for women), revealing a significant difference in comparison with the previous category (the one who have stayed in their first job). Two reasons were found in order to explain this phenomenon. Firstly, graduates presently working in the public sector had to wait much longer for finding employment, and in most cases they stayed in this first position. Secondly, graduates who have changed jobs over time found their first position within a shorter time span. The acquisition of extra professional experience offered them more chances for getting another (probably better) position.
The mean waiting time for getting one’s first work po-sition, regardless of the fact whether one has changed jobs over time, is 12 months; 16 months for men and 10 months for women. The difference between men and women can safely be attributed to the military obliga-tions of men (12-15 months at the time of research). Re-garding the waiting time of graduates from different in-stitutions, those of central TEI (Athens and Thessaloniki) are somewhat shorter (15 months for men, and 9 for women); although not statistically significant.
4.7. Influencing Variables
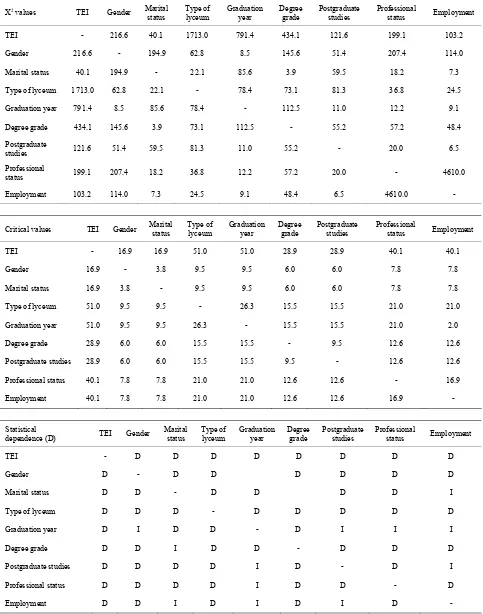
The most important correlations have been dealt with above. Table 7 includes the relationships among all the study variables for all participating graduates. They have been calculated by means of the Chi-square test using a 0.05 significance level. The first of the three tables in-cludes the X2 values, the second one reports the critical
values, and the third one goes into the results about the existence (or not) of significant differences (D stands for a statistically significant relationship; blank cells denote independent variables). The correlations between the study variables concerning the employed graduates only
Table 7. Relationships between all study variables (for all graduates).
X2 values TEI Gender Marital
status
Type of lyceum
Graduation year
Degree grade
Postgraduate studies
Professional
status Employment
TEI - 216.6 40.1 1713.0 791.4 434.1 121.6 199.1 103.2
Gender 216.6 - 194.9 62.8 8.5 145.6 51.4 207.4 114.0
Marital status 40.1 194.9 - 22.1 85.6 3.9 59.5 18.2 7.3
Type of lyceum 1713.0 62.8 22.1 - 78.4 73.1 81.3 36.8 24.5
Graduation year 791.4 8.5 85.6 78.4 - 112.5 11.0 12.2 9.1
Degree grade 434.1 145.6 3.9 73.1 112.5 - 55.2 57.2 48.4
Postgraduate
studies 121.6 51.4 59.5 81.3 11.0 55.2 - 20.0 6.5
Professional
status 199.1 207.4 18.2 36.8 12.2 57.2 20.0 - 4610.0
Employment 103.2 114.0 7.3 24.5 9.1 48.4 6.5 4610.0 -
Critical values TEI Gender Marital status Type of lyceum Graduationyear Degree grade Postgraduate studies Professional status Employment
TEI - 16.9 16.9 51.0 51.0 28.9 28.9 40.1 40.1
Gender 16.9 - 3.8 9.5 9.5 6.0 6.0 7.8 7.8
Marital status 16.9 3.8 - 9.5 9.5 6.0 6.0 7.8 7.8
Type of lyceum 51.0 9.5 9.5 - 26.3 15.5 15.5 21.0 21.0
Graduation year 51.0 9.5 9.5 26.3 - 15.5 15.5 21.0 2.0
Degree grade 28.9 6.0 6.0 15.5 15.5 - 9.5 12.6 12.6
Postgraduate studies 28.9 6.0 6.0 15.5 15.5 9.5 - 12.6 12.6
Professional status 40.1 7.8 7.8 21.0 21.0 12.6 12.6 - 16.9
Employment 40.1 7.8 7.8 21.0 21.0 12.6 12.6 16.9 -
Statistical
dependence (D) TEI Gender
Marital status
Type of lyceum
Graduation year
Degree grade
Postgraduate studies
Professional
status Employment
TEI - D D D D D D D D
Gender D - D D D D D D
Marital status D D - D D D D I
Type of lyceum D D D - D D D D D
Graduation year D I D D - D I I I
Degree grade D D I D D - D D D
Postgraduate studies D D D D I D - D I
Professional status D D D D I D D - D
Table 8. Relationships between all study variables (for all employed graduates).
X2 values /
Critical values
Relation with studies
Way of finding
first job First job
Satisfaction
from job Wages
Satisfaction from wages
X2
value
Critical value
X2
value
Critical value
X2
value
Critical value
X2
value
Critical value
X2
value
Critical value
X2
value
Critical value
TEI 338.6 51.00 511.9 72.00 55.1 16.92 184.9 51.00 264.2 40.11 275.6 51.00
Gender 26.7 9.49 39.2 12.59 0.4 3.84 5.1 9.49 158.8 7.81 21.8 9.49
Marital status 6.8 9.49 13.5 12.59 0.2 3.84 11.4 9.49 14.0 7.81 19.7 9.49
Type of lyceum 35.9 26.30 68.5 36.42 3.0 9.49 30.8 26.30 64.3 21.03 23.4 26.30
Graduation year 25.7 26.30 28.9 36.42 17.8 9.49 23.2 26.30 29.7 21.03 16.9 26.30
Degree grade 95.6 15,51 106.8 21.03 8.9 5.99 27.5 15.51 9.3 12.59 13.7 15.51
Postgraduate studies 31.4 15.51 56.9 21.03 2.7 5.99 24.7 15.51 191.5 12.59 19.8 15.51
Employment 16.4 9.49 103.6 12.59 1.2 3.84 35.3 9.49 341.3 7.81 46.4 9.49
Relation with
studies 0.0 0.00 214.0 36.42 3.0 9.49 1188.1 26.30 176.3 21.03 106.1 26.30
Way of finding first
job 214.0 36.42 0.0 0.00 240.5 12.59 102.5 36.42 490.5 28.87 77.4 36.42
First job 3.0 9.49 240.5 12.59 0.0 0.00 10.2 9.49 0.3 7.81 5.0 9.49
Satisfaction from
job 1188.1 26.30 102.5 36.42 10.2 9.49 0.0 0.00 211.6 21.03 683.1 26.30
Wages 176.3 21.03 490.5 28.87 0.3 7.81 211.6 21.03 0.0 0.00 754.8 21.03
Satisfaction from
wages 106.1 26.30 77.4 36.42 5.0 9.49 683.1 26.30 754.8 21.03 0.0 0.00
Statistical dependence (D)
Relation with studies
Way of finding
first job First job
Satisfaction
from job Wages
Satisfaction from wages
TEI D D D D D D
Gender D D I I D D
Marital status I D I D D D
Type of lyceum D D I D D I
Graduation year I I D I D I
Degree grade D D D D I I
Postgraduate studies D D I D D D
Professional status D D I D D D
Employment D D I D D D
Relation with studies - D I D D D
Way of finding first job D - D D D D
First job I D - D I I
Satisfaction from job D D D - D D
Wages D D I D - D
Satisfaction from wages D D I D D -
Both tables show that the majority of relationships among the variables are statistically significant. Never-theless, the most important factors affecting the main employment variables appear to be the institution of graduation (which practically corresponds to graduate’s specialty), the gender, the degree grade, the acquisition of a postgraduate degree, and one’s current professional status. The effects of marital status and type of lyceum exist, but are considered as having minor importance.
5. Synopsis of Results and Further Research
This paper aimed to present the landscape of the voca-tional rehabilitation of higher technological education graduates in Greece. First-born data derived from 11 Technological Educational Institutions of the country and corresponding to 5183 filled structured questionnaires were collected and used for the analysis. All main em-ployment characteristics were examined and commented, including the identification of the significantly effecting variables.
Regarding the demography of TEI graduates, women are the majority of them composing 58% of the popula-tion graduated of years 1997-2001. The mean durapopula-tion of studies is 5.5 years, fluctuating significantly among in-stitutions and specialties. Only 3% of the graduates get an honors degree. Degree grade is affected by gender (women are more studious) and specialty. Seven to ele-ven years after their graduation 11.4% of the graduates have acquired a postgraduate degree. Gender, marital status, and degree grade effect significantly the realiza-tion of postgraduate studies.
Nearly nine out of ten (88.5%) of the graduates cur-rently work (94% of men and 85% of women). The un-employment rate is 7.4% (4% for men and 10% for women), whilst 4.1% of the graduates are inactive; the corresponding percentage of women being triple than that of men. These differences between men and women are statistically significant. The unemployment rate of TEI graduates is lower than the mean unemployment rate of higher education graduates of the same age (9.15%) reported in a large recent labor force survey [23].
The vast majority of the working graduates (81%) are full time employees. The other categories concentrate small percentages: only 4% work on part time basis and 15% are self-employed. The proportion of self-employed men is double than that of women.
The analysis of the relevance between employment and bachelor studies proves the existence of high het-ero-employment, as 26% of the graduates report minimal or small relation between them. The introduced corre-spondence index has a mean value of 3.59, varying how-ever significantly among the graduates of the different institutions of higher education.
Over two thirds (68%) of the presently employed have changed position since graduation and the mean waiting time for getting their first job is 9 months. The overall mean waiting time for first employment is 12 months. Men wait longer mainly due to military obligations. The waiting time depends significantly on specialty and uni-versity geographical location.
Participation in public examinations has been the most popular channel for getting the present job (used by 40% of graduates). Other frequently used channels are the use of acquaintances (24%) and the announcements in media (16%).
Undoubtedly women suffer much more than men from unemployment, constituting 77% of the corresponding population. The mean unemployment time of the gradu-ates who have previous working experience is 16 months; however the average relevant time of the whole popula-tion is significantly higher reaching 2 years. Only a small percentage (23%) of this category receives an unem-ployment benefit. The main reported reasons for being out of work are the existing high unemployment in the corresponding specialty and the insufficiency of proce-dures for approaching the labor market.
The examination of graduates’ characteristics affecting more significantly and interpreting the status and the quality of their vocational rehabilitation gave some in-teresting results. The variables affecting more signifi-cantly the finding of work are gender and postgraduate education; men and master degree holders have more chances of getting a job. The kind of employment is in-terpreted statistically by degree grade, gender and spe-cialty. The level of the monthly salary is interpreted by gender, postgraduate studies and specialty. These three variables effect more significantly (and positively) than all the others the degree of relevance between studies and employment.
Regarding further relevant work we suggest that this type of research should be repeated frequently for the identification of any changes in the landscape of gradu-ates’ employment. The time interval elapsed between two successive collections and analyses of first-born data should not exceed three to four years. Other interesting, worth exploring aspects are a thorough statistical analysis of the factors defining the main characteristics of gradu-ates’ vocational socialization, as well as a comparison among the higher education graduates among different European countries.
REFERENCES
[1] OECD, “Growing into Work: Youth and the Labour Market over the 1980s and 1990s,” Employment Outlook
1996, Paris.
[2] J. Vincens, “L’ Insertion Professionnelle des Jeunes, a La Recherche D’Une Definition Conventionnelle,” Forma-tion Emploi, Vol. 60, 1997, pp. 21-26.
[3] H. Eckert, “Analyser les Mouvements D’Accès et de Retrait de L’Emploi au Cours de La Période D’Insertion Professionnelle,” Formation Emploi, Vol. 73, 2001, pp. 95-120.
[4] M. Vernieres, “L’ Insertion Professionnelle, Analyses et Débats,” Economica, Paris, 1997.
[5] M. Karamesini, “The Incorporation of University Gradu-ates in the Labor Market,” Horizontal Support Actions of the Career Offices of the Universities, Athens, 2008. [6] C. Koilias, E. Tourna, A. Garmpis, S. Retiniotis and B.
Tolis, “Following the Employment of Graduates of Greek Technological Educational Institutes,” New Technology Publishing, Athens, 2010.
[7] V. Kostoglou, M. Vasilakopoulos and C. Zafeiropoulos, “The Incorporation of Alexander Tei of Thessaloniki Graduates in the Labor Market–Overall Study,” Career Office publishing, Thessaloniki, 2007.
[8] J. Brennan, J. Mills, T. Shah and A. Woodley, “Part-Time Students and Employment: Report of A Survey of Stu-dents, Graduates and Diplomats,” Centre for Higher Education Research & Information, Open University, London, 1999.
[9] S. Scherer, “Patterns of Labour Market Entry Long Wait or Career Instability? An Empirical Comparison of Italy, Great Britain and West Germany,” European Sociologi-cal Review, Vol. 21, 2005, pp. 427-440.
doi:10.1093/esr/jci029
[10] J. Brennan, M. Kogan and U. Teichler, “Higher Educa-tion and Work,” Jessica Kingsley Publishers, London, 1996.
[11] M. H. J. Wolbers, “Job Mismatches and Their Labour Market Effects among School-Leavers in Europe,”
Euro-pean Sociological Review, Vol. 19, 2003, pp. 249-266.
doi:10.1093/esr/19.3.249
[12] M. H. J. Wolbers, “Patterns of Labour Market Entry, A Comparative Perspective on School-To-Work Transitions in Eleven European Countries,” Acta Sociologica, Vol. 50, 2007, pp. 189-210. doi:10.1177/0001699307080924
[13] D. T. Mortensen and C. A. Pissarides, “Technological Progress, Job Creation, and Job Destruction,” Review of Economic Dynamics, Vol. 1, No. 4, 1998, pp. 733-753.
doi:10.1006/redy.1998.0030
[14] D. Raffe, “Pathways Linking Education and Work: A Review of Concepts, Research, and Policy Debates,”
Journal of Youth Studies, Vol. 6, No. 1, 2003, pp. 3-19.
doi:10.1080/1367626032000068136
[15] I. Kogan and M. Unt, “Transition from School to Work in Transition Economies,” European Societies, Vol. 7, No. 2, 2005, pp. 219-253. doi:10.1080/14616690500083428
[16] R. Layard, S. Nickell and R. Jackman, “Unemployment: Macroeconomic Performance and the Labour Market,” Oxford University Press, Oxford, 2005.
[17] C. A. Pissarides, “Loss of Skill During Unemployment and the Persistence of Employment Shocks,” Quarterly Journal of Economics, Vol. 107, No. 4, 1992, pp. 1371-1391.doi:10.2307/2118392
[18] D. T. Mortensen and C. A. Pissarides, “Job Creation and Job Destruction in the Theory of Unemployment,” Review of Economic Studies, Vol. 61, No. 3, 1994, pp. 397-415.
doi:10.2307/2297896
[19] D. T. Mortensen and C. A. Pissarides, “Unemployment Responses to ‘Skill-Biased’ Technology Shocks: The Role of Labour Market Policy,” Economic Journal, Vol. 109, No. 455, 1999, pp. 242-265.
doi:10.1111/1468-0297.00431
[20] V. Gash, “Bridge or Trap? To What Extent do Temporary Workers Make More Transitions to Unemployment than to the Standard Employment Contract,” European Socio-logical Review, Vol. 24, No. 5, 2008, pp. 651- 668.
doi:10.1093/esr/jcn027
[21] P. Ryan, “The School-to-Work Transition: A Cross- Na-tional Perspective,” Journal of Economic Literature, Vol. 39, No. 1, 2001, pp. 34-92. doi:10.1257/jel.39.1.34
[22] J. Brennan, “Graduate Employment: A Review of Issues,” Higher Education Funding Council for England, Bristol, 2000.
[23] National Statistical Service of Greece, “Labor Force Sur-vey,” Piraeus, Greece, 2009.
[24] V. Kostoglou and S. Paloukis, “Graduates’ Employment in European Union,” Proceedings of 5th International