Experimental Data for Study on the Shielding Effect of
Electromagnetic Wave
Chen-Ching Ting1,*, Chien-Chih Chen2 1Department of Mechanical Engineering, National Taipei
University of Technology, ChineseTaipei
2Institute of Mechanical and Electrical Engineering, National Taipei
University of Technology, Chinese Taipei E-mail: [email protected], s3300357@ntut.edu.tw
Received November 16, 2010, revised June 13, 2011; accepted June 25, 2011
Abstract
This article presents some new experimental data for study the shielding effect of electromagnetic wave. The frequencies of electromagnetic wave are mainly focused on emission of daily electrical equipments, which are normally called “low frequency electromagnetic waves”. In this work, a water pump with maximum magnetic field intensity of ca. 2300 mG was applied as emission source of the electromagnetic wave. Ex-perimental measurements used various shielding materials with the major constituent iron (Fe) in the form of plate for studying shielding effect of electromagnetic wave. The studied parameters were different thick-nesses and gaps of the plate. The results show that pure iron plate has the best effect for shielding the mag-netic field and its transmission ratio of magmag-netic field is proportional to distance between the emission source and the shielding plate. Moreover, the shielding plate close to the emission source received better protection.
Keywords:Shielding Effect, Electromagnetic Wave, Low Frequency, Iron
1. Introduction
It’s well known that the electromagnetic waves are gen-erated by the alternating current (AC) due to the elec-tromagnetic induction [1]. An elecelec-tromagnetic wave consists of the mutual perpendicular electric and mag-netic fields simultaneously. Figure 1 shows schematic
description of the electromagnetic wave, where E is the
electric field vector, H is the magnetic field vector, P is
the integrated electromagnetic field vector, and λ is wave length of the electromagnetic wave.
Since 1831 M. Faraday developed the electromagnet-ism and J. C. Maxwell derived the Maxwell’s equations in 1875 show the phenomenon of electromagnetic induc-tion. In recent years, the electro-communication and the electrical appliance are widely used in the world, which causes serious problem of the electromagnetic interfer-ence (EMI). The electromagnetic waves emitted by the daily electrical equipments are called “low frequency electromagnetic waves”, their frequencies are normally defined as 30 ~ 300 Hz. The sources of low frequency electromagnetic wave can be e.g. AC conducting wire, cell phone, computer, microwave, television, and so on.
The EMI often makes electrical devices out of order, i.e.
error of the signal, the sound, the image, etc.
EMI on electronic devices is already known, but the same research on the biological bodies is very few due to its too short observation time. The most scientists believe that the electromagnetic radiation will hurt the bodies for a long exposure time and warn people to avoid long ex-posure time on the extraordinary strong electromagnetic field. The up to now understood injury by EMI on the bodies are the heating damage, the body balance destroy, and the accumulation effect. The extraordinary strong electromagnetic field inside the body will cause the wa-ter molecules to be heated while the wawa-ter occupies ca. 70% of the body. Moreover, the steady situation of the body will be destroyed by the extraordinary strong elec-tromagnetic field. In addition, the accumulation of sev-eral weak electromagnetic influences will also hurt the body.
Figure 1. Schematic description of the electromagnetic wave.
electromagnetic radiation, which has been studied in many literatures [2-10]. The principle of the electromag-netic radiation shielding is to reduce the electromagelectromag-netic energy through the absorption or reflection of the mate-rials. According to this reason, this work offers some significant experimental data for research on the shield-ing effect to protect the low frequency electromagnetic radiation, which is normally produced by the transformer. The applied physical principles are the skin effect and the magnetic protection effect. The skin effect is the ten-dency of an alternating electric current to distribute itself within a conductor so that the current density near the surface of the conductor is greater than that at its core. That is, the electric current tends to flow at the “skin” of the conductor. The skin effect causes the effective resis-tance of the conductor to increase with the frequency of the current. The magnetic protection effect occurs on the material including iron for protection of the alternating magnetic waves [11]. The research will use the cutting off technique to protect the electromagnetic radiation. The technique will consider type and thickness of the protecting material for measurement and analysis of transmission ratio to select the best protecting material.
2. Basic Theory
The electromagnetic waves are generally generated by the alternating current (AC) in terms of the Faraday’s induction law and the Ampère’s circuital law. The Fara-day’s induction law indicates that a time-varying mag-netic field will have an electric field associated with it as shown in Equation (1). Moreover, the Ampère’s circuital law illustrates that a time-varying electric field will be accompanied by a magnetic field as shown in Equation (2) [12]. That is, the electric and magnetic waves always exist simultaneously.
d d
C A t
E l
B S, (1)d d ,
C A t
B l
J E S (2)where E and B are the electric and magnetic fields; dl
and dS are differential path and traversing area of the
electric and magnetic fields; , J, and are
perme-ability, current density, and electric permittivity respec-tively.
In principle, a conductor can stop electromagnetic wave to penetrate in terms of the skin effect. The skin effect illustrates that the electric charges within the con-ductor are gathered on the surface while an electromag-netic wave is propagating into it. That is, the largest cur-rent density appears at skin of the conductor and is rap-idly decreased with depth of the conductor. The average depth is called as the skin depth which strongly depends on frequency of the incident electromagnetic wave. In general, the larger the frequency of the incident electro-magnetic wave, the smaller the skin depth. The common relationship is
d
S
JJ e , (3)
where d and are distances of current to surface and skin depth; J and JS are current density and surface current density in the conductor respectively. In normal cases the skin depth is well approximated as
0
2 2
503 ,
2π r r
m
(4)
where is resistivity of the conductor; 2π is angular frequency () and frequency ( ) of current;
, 0, and r are individually absolute, free space,
[image:2.595.312.534.503.695.2]and relative magnetic permeability of the conductor.
Figure 2 shows damping curves of electric and magnetic
waves for the electromagnetic wave in the conductor [11]. Figure 2 clearly indicates that the electromagnetic
wave is rapidly damped with depth in the conductor as the near hyperbolic curves.
The shielding effect of electromagnetic wave normally
0 t0
E E
0 t0
H H
z z
uses shielding materials to reduce penetration of the electromagnetic wave. In general, the skin depth in the conductor does not only depend on frequency of the in-cident electromagnetic wave, but also be influenced by the shielding materials. Table 1 shows some common
conductive materials in corresponding to frequency of the incident electromagnetic wave and its skin depth re-spectively [11].
3. Experimental Setup
Experimental setup is to measure the decay rate and the transmission ratio of the electromagnetic wave using various shielding materials with the major constituent iron (Fe) in the form of plate. The studied parameters are different thicknesses and gaps of the plate. The triaxial extremely low frequency (ELF) magnetic field meter (TES-1394) from TES Electrical Electronic Corp. with ± 3% measuring error and 30 Hz ~ 2 kHz measuring band-width of frequencies is used for detecting the magnetic field intensity. Table 2 exhibits the applied shielding
materials and their measuring conditions, where the gap is the distance between two plates and its corresponding plate thickness is 1 mm.
The experimental setup consists of three different in-tegrations, the plate thickness, the plate gap, and the magnetic loop effect, to study influence of the shielding materials. Measurements are focused on the decay rate and the transmission ratio of the electromagnetic wave. The transmission ratio is defined as ratio of the pene-trated magnetic field intensity and the magnetic field intensity with protection at the same position.
PenetratedTransmission % 100%
No Protection
(1)
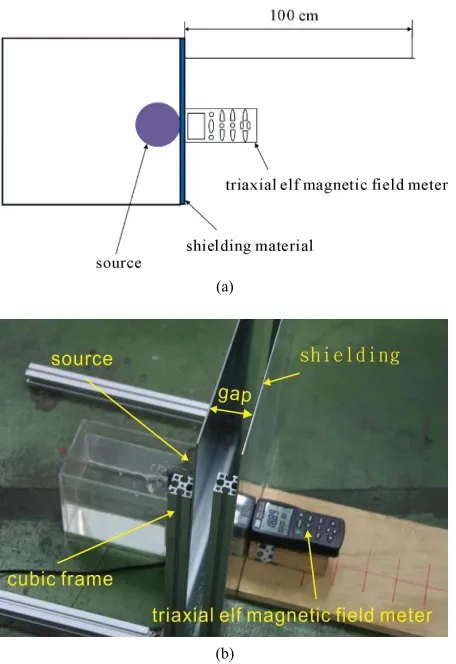
Figure 3 shows graphical descriptions for measuring
the decay rate and the transmission ratio with various materials and different thicknesses, where Figure 3(a)
shows schema of the experimental setup and Figure 3(b)
is the photo. To reduce the measuring error from the side electromagnetic field, the 50 cm × 50 cm relatively large plates are used.
The left side in Figure 3(b) shows the working water
pump, which was used as the emission source. The right side is the TES-1394 magnetic field meter, which was put on the opposite positions from the shielding plate. Measurements with various shielding materials simply change the intercalary plate. The decay rate measure-ments moved the TES-1394 magnetic field meter far away from the plate in comparison with the emission source moving far away from the plate. The performed distances were from 0 to 100 cm with moving step of 5 cm.
Table 1. Some common conductive materials in corre-sponding to frequency of the incident electromagnetic wave and its skin depth respectively [11].
Frequency
Skin Depth 60 [Hz] (cm) 1 [kHz] (mm) 2 [MHz](mm) 1 [GHz](μm)
Aluminum 1.1 2.7 0.085 1.6
Copper 0.85 2.1 0.066 1.2
Silver 0.83 2.03 0.064 1.2
Nickel 0.18 4.4 0.014 0.26
Mumetal 0.037 0.092 0.0029 0.053
(75Ni, 2Cr, 5Cu, 18Fe)
Tin 2.21 5.41 0.171 3.12
Zinc 1.51 3.7 0.117 2.14
Magnetic Iron 0.14 0.35 0.011 0.2
Table 2. Shielding plates with plate area of 50 cm × 50 cm and their measuring conditions.
Material Thickness (mm) Gap (cm)
Ni-Cr Stainless 1
Galvanized Iron 1, 2, 5 0, 3, 5
Iron 1, 2, 5 0, 3, 5
Figure 4 shows graphical descriptions for measuring
the decay rate and the transmission ratio with various materials as well as different plate gaps, where Figure 4(a) shows schema of the experimental setup and Figure 4(b) is the photo. The plates with 1 mm thickness were
used for measuring and discussing influence of the plate gaps as well as the measured plate gaps are 0, 3, and 5 cm (see Table 2).
Influence of the loop effect for transmission ratio of magnetic field inside the materials is also considered in this work. Figure 5 shows photo of the experimental
setup for measuring the loop effect. Figure 5 shows that
a closed circle square plate box with L × W × H = 50 cm × 50 cm × 50 cm is built with galvanized iron. The emis-sion source of the water pump was put into the box and moved the outside TES-1394 magnetic field meter far away from the box for measuring.
4. Results and Discussion
Experimental results and discussion are focused on the decay rate and the transmission ratio of magnetic field intensity using different shielding materials. Figure 6
(a)
[image:4.595.311.539.77.409.2](b)
Figure 3. Graphical descriptions for measuring the decay rate and the transmission ratio with the various materials and different thicknesses. (a) Schema of the experimental setup; (b) Photo of the experimental setup.
various shielding materials, where all plate thicknesses are 1 mm. Figure 6 clearly indicates that the shielding
effect of iron plate is better than galvanized iron and Ni-Cr stainless steel plates. The decay distance of the magnetic field intensity in Figure 6 for the four curves
with ca. the same value of 30 cm, which shows good agreement with the theory [11]. The decay distance of the magnetic field intensity is independent on the mag-netic field intensity.
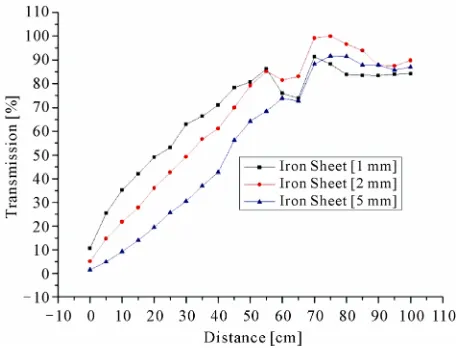
Figure 7 further shows relationship between the
pene-trated magnetic field intensity and the measured dis-tances with different plate thicknesses of the iron. The applied plate thicknesses are 1, 2, and 5 mm. Figure 7
exhibits that the larger the thickness of shielding plate, the better the protection of the electromagnetic field in-tensity. The decay distances of the three curves are ca. the same value of 30 cm.
Figure 8 shows comparison of the galvanized iron and
the iron protection. The result exhibits that protection using the iron plate is better than the galvanized iron plate.
(a)
(b)
Figure 4. Graphical descriptions for measuring the decay rate and the transmission ratio with various materials as well as different plate gaps. (a) Schema of the experimental setup; (b) Photo of the experimental setup.
Figure 5. Photo of the experimental setup for measuring the magnetic field loop effect.
Figure 9 shows relationship between the transmission
[image:4.595.58.284.78.410.2] [image:4.595.310.537.466.621.2]Figure 6. Relationship between the penetrated magnetic field intensity and the measured distances with various shielding materials, where all plate thicknesses are 1 mm.
Figure 7. The relationship between penetrated magnetic field intensity and the measured distances with the different plate thicknesses of the iron.
Figure 8. Comparison of the galvanized iron and the iron protection for magnetic field.
Figure 9. Relationship between the transmission ratio and the measured distances with the iron plates.
decay rate in Figure 7 indicates the good agreement. The
magnetic field intensity strongly decays nearby the emis-sion source. The magnetic field intensity far away from the emission source shows almost no variation.
The measurements using two plates with a gap is to consider influence of the gap. Figure 10 shows
[image:5.595.57.286.296.472.2]relation-ship between the penetrated magnetic field intensity and the measured distances using the 1 mm thickness iron plates with the 0, 3, and 5 cm gap sizes. The shielding plates with gap have better protection than the same thickness plate, but it is independent on the gap size.
Figure 11 shows relationship between the penetrated
magnetic field intensity and the measured distances with the shielding plate nearby the emission source in com-parison with the shielding plate nearby the measuring meter. The result shows that protection with the shielding plate nearby the emission source is better than the shiel-ding plate nearby the measuring meter. That is, to protect the electromagnetic field using the shielding plate should be built as close as the emission source.
Figure 12 shows relationship between penetrated
magnetic field intensity and the measured distances with the closed loop circle squared galvanized iron plate. The result shows that the alternating magnetic field yields no loop effect in the shielding material.
[image:5.595.56.287.519.691.2]Figure 10. The relationship between penetrated magnetic field intensity and the measured distances using the 1 mm thickness iron plates with the 0, 3, and 5 cm gap sizes.
Figure 11. Relationship between the penetrated magnetic field intensity and the measured distances with the shield-ing plate nearby the emission source.
Figure 12. The relationship between penetrated magnetic field intensity and the measured distances with the closed loop circle square galvanized iron plate.
helped the shielding effect. The reason is that the gener-ated current in the shielding material is not enough to cause the loop current.
5. Conclusions
Measuring influence of the material, the shielding plate thickness, the shielding plate gap, and the loop effect on the decay rate and the transmission ratio of electromag-netic field by the shielding protection are successfully carried out. The results show that the iron (Fe) has the best protection for the magnetic field. The larger amount iron constituent and the thicker shielding plate, the better shielding effect for the magnetic field makes. The trans-mission ratio is proportional to distance between the emission source and the measuring meter. Two plates with gap is better than the same sum thick plate for shielding effect, but it is independent on the gap size. The shielding plate close to the emission source has bet-ter protection.
6. Acknowledgements
The authors would like to acknowledge the financial support from the National Taipei University of Technol-ogy.
7. References
[1] D. K. Cheng, “Field and Wave Electromagnetics,” Addi-son-Wesley Publishing Co., Boston, Jwang Yuan Pub-lishing Co., Taipei, 1988.
[2] M. A. S. Oviedo, O. A. Araujo, R. Faez, M. C. Rezende and M. D. Paoli, “Antistatic Coating and Electromagnetic Shielding Properties of a Hybrid Material Based on Polyaniline/Organoclay Nanocomposite and EPDM Rub-ber,” Synthetic Metals, Vol. 156, No. 18-20, 2006, pp.
1249-1255.
[3] M. R. Hernand and G. G. Karady, “Attenuation of Low Frequency Magnetic Fields Using Active Shielding,” Electric Power Systems Research, Vol. 45, No. 1, 1998,
pp. 57-63.
[4] E. Hakansson, A. Amiet, S. Nahavandi and A. Kaynak, “Electromagnetic Interference Shielding and Radiation Absorption in Thin Polypyrrole Films,” European Poly-mer Journal, Vol. 43, No. 1, 2007, pp. 205-213.
[5] D. D. L. Chung, “Electromagnetic Interference Shielding Effectiveness of Carbon Materials,” Carbon, Vol. 39, No. 2, 2001, pp. 279-285.
[image:6.595.56.285.510.683.2]
[7] S. Keeping and G. Zhenyn, “Laboratory Research on Shielding Effect of a Novel Conductive Cloth to Micro-wave Radiation,” Journal of Electrostatics, Vol. 252, 1998, pp. 125-129.
[8] H. C. Lee, J. Y. Kim, C. H. Noh, K. Y. Song and S. H. Cho, “Selective Metal Pattern Formation and Its EMI Shielding Efficiency,” Applied Surface Science, Vol. 252, No. 8, 2006, pp. 2665-2672.
[9] J. L. Huang, B. S. Yau, C. Y. Chen, W. T. Lo and D. F. Lii, “The Electromagnetic Shielding Effectiveness of
In-dium tin Oxide Films,” Ceramics International, Vol. 27, No. 3, 2001, pp. 363-365.
[10] Z. Dou, G. Wu, X. Huang, D. Sun and L. Jiang, “Elec-tromagnetic Shielding Effectiveness of Aluminum Al-loy-Fly Ash Composites,” Composites: Part A, Vol. 38, 2007, pp. 186-191.
[11] P. Lorrain and D. R. Corson, “Electromagnetic Fields and Waves,” W. H. Freeman and Company, New York, 1987. [12] E. Hecht, “Optics,” Addison-Wesley Publishing
![Figure 2. Damping curves of electric and magnetic waves for the electromagnetic wave in the conductor [11]](https://thumb-us.123doks.com/thumbv2/123dok_us/9068587.403273/2.595.312.534.503.695/figure-damping-curves-electric-magnetic-waves-electromagnetic-conductor.webp)