R E P O R T
Quantifying coral morphology
Kyle J. A. Zawada1,2 •Maria Dornelas2 •Joshua S. Madin3
Received: 20 February 2019 / Accepted: 2 July 2019 ÓThe Author(s) 2019
Abstract Coral morphology has important implications across scales, from differences in physiology, to the envi-ronments they are found, through to their role as ecosystem engineers. However, quantifying morphology across taxa is difficult, and so morphological variation is typically cap-tured via coarse growth form categories (e.g. arborescent and massive). In this study, we develop an approach for quantifying coral morphology by identifying continuous three-dimensional shape variables. To do so, we contrast six variables estimated from 152 laser scans of coral colonies that ranged across seven growth form categories and three orders of magnitude of size. We found that 88% of the variation in shape was captured by two principal components. The main component was variation in volume compactness (cf. convexity), and the second component was a trade-off between surface complexity and top-heaviness. Variation in volume compactness also limited variation along the second axis, where surface complexity and top-heaviness ranged more freely when compactness was low. Traditional growth form categories occupied
distinct regions within this morphospace; however, these regions overlapped due to scaling of shape variables with colony size. Nonetheless, with four of the shape variables we were able to predict traditional growth form categories with 70 to 95% accuracy, suggesting that the continuous variables captured most of the qualitative variations implied by these growth forms. Distilling coral morphol-ogy into continuous variables that capture shape variation will allow for better tests of the mechanisms that govern coral biology, ecology and ecosystem services such as reef building and provision of habitat.
Keywords Functional morphologyScleractinia3D scanning Shape analysisTraitsGrowth form
Introduction
The shape and size of organisms determines how they interact with the physical environment and with other organisms (Denny 1993; Vogel 1996). This is especially true for sessile colonial organisms, where variation in morphology has been linked to a range of biological and ecological processes (Jackson 1977, 1979). For example, growing upwards from the benthos reduces benthic com-petition, while growing laterally reduces whole colony mortality by spreading risk (Jackson 1979). Despite the fundamental importance of a colony’s morphology, there is no general framework for capturing morphological varia-tion. Instead, scientists tend to lump individuals and spe-cies into discrete growth form categories [corals: (Veron
2000); bryozoans: (Bishop1989); bacteria: (Shapiro1995)] or use continuous metrics that cannot partition the effect of size and shape [e.g. surface area-to-volume ratio; (Nau-mann et al.2009)]. Developing a quantitative framework is Topic Editor: Morgan S. Pratchett
Electronic supplementary material The online version of this article (https://doi.org/10.1007/s00338-019-01842-4) contains sup-plementary material, which is available to authorized users.
& Kyle J. A. Zawada [email protected]
1 Centre for Biological Diversity, Scottish Oceans Institute, University of St. Andrews, Scotland KY16 9TH, UK 2 Department of Biological Sciences, Macquarie University,
Sydney, NSW 2109, Australia
3 Hawai‘i Institute of Marine Biology, University of Hawai‘i at Ma¯noa, Kaneohe, HI, USA
challenging for colonial organisms because they have geometrically complex forms, high intraspecific and interspecific variation in shape, and lack readily identifi-able landmarks for comparative analysis. However, new technologies such as CT and laser scanning make it pos-sible to accurately capture the diversity of shapes exhibited by colonial organisms (Lavy et al. 2015; House et al.
2018). Here, using reef corals as a study system, we develop a morphological schema using quantitative, three-dimensional shape variables.
Scleractinian corals are a prime example of colonial organisms whose morphology directly dictates life history strategies (Jackson1979), demographic rates (Madin et al.
2014; A´ lvarez-Noriega et al. 2016; Dornelas et al. 2017) and provisioning of habitat for other taxa (Bell and Galzin
1984; Graham and Nash 2013; Richardson et al. 2017b). The aragonite skeleton thatScleractinian corals secrete as they grow provides support and shape; however, most of the live biomass is associated with the surface (Johannes and Wiebe 1970; Hoegh-Guldberg 1988). These charac-teristics have consequences for vital processes such as growth and survival, where higher surface area-to-volume ratios allow more biomass per unit investment in skeleton, but may increase the risk of partial colony mortality (Lir-man2000), dislodgement (Madin2005), and susceptibility to thermal bleaching (Baird and Marshall2002). In paral-lel, coral structures provide direct habitat for many taxa and can act as predator refuge for both adult and juvenile fishes (Friedlander and Parrish1998; Kerry and Bellwood
2012). At the habitat scale, variation in the morphology of each colony in an assemblage contributes to the overall structural complexity of the habitat (Richardson et al.
2017a), which has been linked to ecosystem properties, such as microhabitat availability (Graham and Nash2013) which in turn influences community structure (Almany
2004; Nash et al.2014), and larval recruitment (Hata et al.
2017). Furthermore, variation in colony shape influences the persistence of colony skeleton following mortality and reef matrix building and infilling processes (Rasser and Riegl2002; Glynn and Manzello 2015). Yet, despite the importance of morphology for the functioning of both the corals themselves and coral reef ecosystems, quantitative studies of coral morphology are sparse, presumably because of difficulties in measuring and dealing with the geometric complexity of coral forms.
Scleractinian corals exhibit high levels of variation in morphology within and among taxa. They vary from sim-ple shapes, such as encrusting or hemispherical colonies, to tree-like branching shapes. There are also varying degrees of morphological plasticity within species driven by interactions with local environmental conditions (Foster
1979), though some variation among species is genetically constrained (Filatov et al. 2013). Additional phenomena
such as partial mortality (Meesters et al. 1996), colony fragmentation (Karlson 1986) and indeterminate growth (Sebens 1987) add to the complexity and observed varia-tion in morphology from colony to colony, even within species and conspecifics. Corals need access to free-flow-ing water for filter feedfree-flow-ing, and light for photosynthesis, both of which are linked to morphological variation (Kaandorp et al. 1996; Hoogenboom et al. 2008). Addi-tionally, competition for space results in many colonies growing up from the substrate to increase standing biomass without needing to continuously colonise new substrate (Jackson1977). However, many sessile colonial organisms within marine environments are subjected to hydrodynamic forces that can dislodge entire colonies if they grow too far away from the substrate, restricting the range of available morphologies (Koehl1999). Taken together, coral colonies exhibit multiple morphological trade-offs that result in the vast array of observed variation in morphology (Chappell
1980; Kaandorp et al.1996).
Scleractinian corals are typically categorised into growth forms based on coarse morphological similarities. Growth forms are useful for species identification and monitoring changes in assemblage structure, but do not adequately capture geometric complexity or intraspecific variation in shape. Phenotypic plasticity is common among coral species, where the same species can exhibit different growth forms in different environments (Veron 2002). Despite these limitations, growth form is a useful metric because life processes can differ significantly among cat-egories. For example, growth form is a good predictor of competitive ability (Connell et al.2004; Hoogenboom et al.
2008) and zonation patterns (Chappell 1980; Done2011). Growth form and size affect demographic rates including fecundity (A´ lvarez-Noriega et al.2016), growth (Dornelas et al.2017) and background mortality (Madin et al.2014). While these results highlight differences between growth forms across a range of processes, they are unable to directly assess process-based hypotheses for the observed differences, nor can the results be generalised to other growth forms or taxa with similar morphological adapta-tions but different overall morphology (e.g. sponges, hydrozoans, algae, plants, etc.). As such, recent studies have begun to explore techniques for quantifying and comparing the three-dimensional shape of corals (Bythell et al. 2001; Filatov et al. 2010, 2013; Lavy et al. 2015; Reichert et al.2017; House et al.2018). We build on this work to develop a quantitative schema for coral morphol-ogy via variables that capture shape variation.
therefore aim to be causally linked to processes and par-tition the effects of shape and size separately. Morphology has previously been quantified using variables such as corallite area and branch spacing that may have implica-tions locally within a colony or at the polyp scale (Bruno and Edmunds 1997; Shaish et al.2007). Surface area-to-volume ratios are an example of whole colony information with expected causal links to processes (Hoegh-Guldberg
1988). However, surface area-to-volume ratio can change with either differences in shape or size or both, making the effects of shape and size on other processes difficult to disentangle when using this metric. Recent work within the genusMadracishas quantified coral branching patterns and growth processes using 3D imaging (Kaandorp et al.1996; Filatov et al. 2010); however, measuring whole colony morphology across a broad taxonomic and morphological scale along multiple axes of variation simultaneously has been limited. By measuring multiple, size-independent variables across a wide range of morphological variation, trade-offs and broader patterns become clearer, including how shape changes as colonies get larger.
Variables that can capture how a colony is spatially distributed in the environment should capture functionally relevant axes of morphological variation. For example, variables that measure colony volume compactness may act as a good indicator of ‘‘branchiness’’ or how sturdy a colony is, capturing a continuous gradient from massive to arborescent colonies. Variation in compactness may therefore covary with processes such as growth rates, fragmentation and habitat provision (Gladfelter et al.1978; Lirman2000; Alvarez-Filip et al.2011). Two variables that can capture volume compactness are convexity and sphericity, where convexity captures the ratio of the objects volume to the volume immediately surrounding it, and sphericity which captures how close an objects shape is to a sphere, which is the most compact shape possible in three dimensions.
Another axis of variation is how the surface area of a colony is distributed in space, which should capture a gradient from flatter, less convoluted surfaces to colonies with highly complex and convoluted surfaces. Variation in surface complexity may capture a functional trade-off axis between biomass packing (e.g. having more biomass for a given area of space) and decreased intra-colony competi-tion for resources (e.g. increased light per unit biomass when surface area is spread out) (Hoogenboom et al.2008; Wangpraseurt et al. 2012). Surface complexity can be captured with two shape variables, fractal dimension, which captures how surface area fills space at different scales and is an estimate of spatial complexity, and pack-ing, which captures how much of an object’s surface area is situated internally versus externally in relation to its immediate environment.
The previous four shape variables are all rotationally and size invariant (i.e. the orientation or size of colony meshes has no bearing on the resulting value). However, a distinguishing feature of shape in competing benthic organisms is how volume and surface area are distributed vertically above the substrate, or ‘‘top-heaviness’’. For instance, a tabular coral colony has volume and surface area distributed further away from the substrate than a hemispherical colony that is ‘‘bottom heavy’’. To capture this feature, we used first moments of volume (VVOL) and
surface area (VAREA), which are the sums of the products of
volume and area, respectively, with their vertical distance from the colony attachment point. This axis can be expected to covary with processes such as whole colony dislodgment, benthic competition strategy and microhabitat diversity (Jackson1979; Kerry and Bellwood2012; Madin et al.2014).
Morphology is important for corals and the ecosystems they build, but a comprehensive suite of quantitative traits for developing explanatory and generalised models for these processes has yet to be formalised. By measuring these axes of morphological variation, we can place coral colonies along multiple functional axes, moving from a subjective, categorical framework towards a quantitative, functional trait-based one. The aim of this study was to measure a set of morphological variables that capture biologically relevant axes of variation in corals. To achieve this aim, we first derived six morphological variables and measured them across a broad diversity of colony shapes and a wide range of sizes via high-resolution 3D laser scanning. We then asked: (i) how do corals occupy con-tinuous morphological space? (ii) where do growth form classifications sit within this space? (iii) how does the shape of growth forms covary with size? and (iv) do con-tinuous variables capture the subjective information enco-ded in growth forms? We show that the variables outlined in this study can place growth forms on three continuous axes of variation and provide a more precise, mechanistic toolkit for ongoing research.
Materials and methods
Data collection
during data collection to output a range of mesh file types without the need for further processing. Colonies were selected for scanning to capture a broad range of shapes and sizes across a diversity of traditional coral growth form classifications [arborescent, corymbose, digitate, laminar, massive, sub-massive or tabular; (Veron2000)]. Colonies were also selected to be mostly intact with few breakages; however, in some cases a minor amount of damage was present. The final data set included seven growth forms, 38 species and ranged in size from 5.3 to 9242.5 cm3 (for further details, see Table S1). Specimens were from a broad range of environments and locations making the results of this study more variable than if specimens were collected from the same environment. The use of coral skeletons instead of live colonies means that some surface properties at the microstructural scale are likely to be dif-ferent for colonies in situ, but is appropriate to capture whole colony morphology.
Scanning was conducted with a standard resolution of 0.5 mm2but needed to be decreased to 1 mm2for several large or complex colonies due to computational constraints. All colony scans were orientated with the z-axis aligned with the colony’s likely upward orientation when on the reef. Each scan consisted of a digital 3D mesh that was comprised of a single contiguous surface of connected triangles. In many cases, non-coral substrate was also included in the scan data and was removed prior to anal-ysis. Meshes were rejected if the final mesh deviated in shape from the actual specimen due to issues associated with interpolating missing scan data. Growth form cate-gories were selected if there were at least five observations of sufficient quality. The final dataset consisted of 152 meshes. To test the precision and accuracy of the laser scanner, 20 colonies previously scanned using a medical CT scanner (House et al.2018) were rescanned using the laser scanning protocol and morphological measurements were compared (Fig. S1).
Size and shape variables
For each colony mesh, we calculated two size variables, volume and surface area, and six shape variables that pair off into three axes of shape variation: sphericity and con-vexity (capturing volume compactness), packing and fractal dimension (capturing surface complexity) and the first moments of area and volume (capturing top-heavi-ness). Further details of each shape variable follow, but further information and the equations for each variable are contained in Table S2. All variables were calculated in R (R Core Team2015), and various functions are included as supplementary material.
The surface area of each mesh was calculated by total-ling the area of each triangle in the mesh. Because corals
are irregular objects, the volume of each mesh was approximated using the signed volume principal (Zhang and Chen2001). For each triangle in the mesh, a tetrahe-dron was formed using the triangle and the origin, and its volume calculated. If the triangle faces away from the origin, its volume is positive, and if the triangle faces towards the origin it is negative. By totalling up the posi-tive and negaposi-tive volumes, a close approximation to the true volume of the mesh is obtained.
Volume compactness is captured here by two variables. SphericitySis a size invariant measure of the compactness of an object’s volume (Wadell1935). It is calculated as the ratio of the surface area of a sphere with the same volume as the object and the surface area of the object. Sphericity is bounded by zero (i.e. a theoretical shape that is entirely non-compact, like a plane) and one (i.e. a perfect sphere) and is size independent. Because sphericity is a ratio between zero and one, but never exactly zero or one, it was logit-transformed for analyses. Convexity C is a size invariant measure of the degree to which there is space between different parts of an object (Zunic and Rosin
2004). Convexity is calculated as the volume of an object divided by the volume of its convex hull, where the convex hull is the shape formed by the smallest possible boundary that has no concave areas around an object (Barber et al.
1996). Like sphericity, convexity is bounded by zero (i.e. a theoretical shape that has no volume but some convex volume) and one (i.e. a shape that is entirely convex) and was logit-transformed for analyses.
Surface complexity is also captured by two shape vari-ables. Another form of convexity (which we call packing P for clarity) is a size invariant ratio of how much of an object’s surface area is situated internally versus externally in relation to its immediate environment (Zunic and Rosin
2004). It is calculated as the surface area of an object divided by the surface area of its convex hull. A packing value above one indicates that surface area is packed within the volume it occupies (i.e. it is more inverted). Values below one indicate that surface area is more spread out over the volume it occupies (i.e. it is more everted). Con-vex shapes have a packing equal to one, as the surface area is neither internally nor externally distributed, and objects with an equivalent amount of ‘‘inverted’’ and ‘‘everted’’ surface also have a packing equal to one. As packing is a proportion that can go above or below 1, it was log10
as the slope of log10(N)*log10(C), where Nis the total
number of cubes that contain any surface of the object and Cis the number of equal sized cubes in the 3D cube array. For each colony, we generated a vector of 25 box sizes that were equally spaced on a log10 scale, with the largest box
size having side lengths equal to the longest dimension of the coral. We then selected cube sizes where the smallest was double the size of the laser scanner resolution (0.5 mm3) and the largest was less than the size of longest dimension of the coral. The smaller cut-off was to ensure that boxes that should overlap with a surface, for example a box between two points that are connected, was still counted. The larger cut-off was because the chance of a box with the same size as the coral overlapping a point is 1, and so every colony would have the same value regardless of their shape.
Top-heaviness was captured by the first moments of volume (VVOL) and surface area (VAREA) with respect to
the vertical distance from the attachment area. ForVAREA,
the area of each triangle in the mesh was calculated and multiplied by the vertical distance from the centroid of the triangle and the centroid of the attachment plane. ForVVOL,
a similar algorithm was used. For each triangle in the mesh, a tetrahedron between the triangle and the origin was cal-culated. The signed volume of each tetrahedron was mul-tiplied by the vertical distance between the centroid of the tetrahedron and the centroid of the attachment plane. Both variables were log10 transformed for analysis. To ensure
size invariance, colony meshes were converted to a stan-dard volume of 1 mm3 before these variables were calculated.
Analysis
We used principal components analysis (PCA) to visualise the morphospace, how growth forms occupied this space, and to identify which shape variables explained most of the variation in colony shape [via the ‘‘prcomp’’ function in R (R Core Team2015)]. Variables were standardised with a mean of zero and unit variance to reduce the influence of variable scale on the projection. For each principal com-ponent, variables were highlighted as important for a given component based on whether their loadings exceeded the null contribution value of 16.6% (100% divided by six variables). Pair-wise plots of raw data with Pearson’s correlations were used to identify how variables covary and which variables were highly collinear both within a given component and between the variables overall. A LOESS smooth regression was fitted to each variable pair to visualise relationships without making any assumptions about the distributions or linearity of the data.
To test whether shape remained constant with colony size, we used a linear regression approach, with shape
variable as the response, and growth form, volume and their interaction as predictors (using the ‘‘lm’’ function in R). Each shape variable within each growth form was deemed to remain constant with size if zero was within the 95% confidence intervals for the slope estimate.
To infer whether the morphological variables captured a broad proportion of the subjective variation encoded in growth forms, we first added 95% confidence ellipses for each growth form to the PCA to visualise how growth forms occupied continuous shape space. We then used multinomial regression to see how well the shape variables could predict the correct growth form [via the ‘‘multinom’’ function from the R package ‘‘nnet’’ (Venables and Ripley
2002)]. We built the initial model based on a set of vari-ables that captured different axes of variation in shape and had low covariance to minimise redundancy of informa-tion. No interactions between shape variables were inclu-ded. Additionally, volume was not included as a main effect as size is not a determining characteristic for growth form. However, volume was included as an interaction effect with shape variables that were shown to vary as a function of volume. Finally, we used this model as the basis for a leave-one-out assessment of predictive accu-racy, where a model that omitted an observation was fitted, and the omitted observation data used to generate proba-bilities of that observation belonging to any one growth form classification, as well as assigning a single class. This was repeated for every observation sequentially and the predicted probabilities and classes were pooled, with the probabilities used for a visual assessment of model per-formance and the classes used for the generation of a confusion matrix to assess classifier (in this case the multinomial model) performance. The predicted class dataset was assessed via kappa values and balanced accu-racy estimates to assess classifier accuaccu-racy (Cohen 1960). The overall model was assessed for goodness of fit via McFaddens pseudo-R2.
Results
Corals in continuous shape space
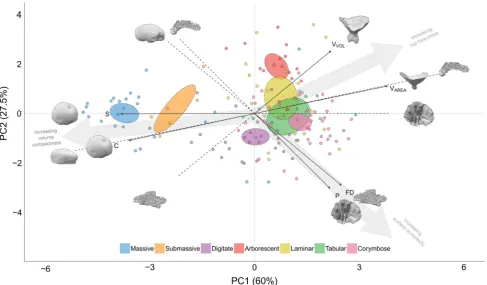
87.5% of the observed variation in shape was captured by the first two principal components (PC) (Fig.1). The first PC captured 60% of the variation across the six-dimen-sional shape space and was comprised of sphericity, con-vexity and the first moment of area (VAREA). All three
variables had contribution values above 16% with sphericity and VAREA having joint highest at 25% and
convexity were positively correlated, with both being negatively correlated withVAREA. Of these three variables,
convexity was selected for the predictive model as it had the weakest correlation with the other three variables, therefore minimising redundancy. The second PC captured 27.5% of the variation and was comprised of packing, fractal dimension and the first moment of volume (VVOL).
Of these variables, packing had the highest contribution at 35%, followed by fractal dimension (32%) and VVOL
(24%) (Fig.1). Packing and fractal dimension were highly correlated with each other (Fig.2); however, both were uncorrelated withVVOL. Of these variables, bothVVOLand
packing were selected for the predictive model; VVOL
because it was uncorrelated with the other two variables and packing as it was slightly less correlated with the other variables compared to fractal dimension.
Coral colony shape was constrained by compactness. When sphericity and convexity are high, there was less variation in surface complexity (captured by packing and fractal dimension), with a similar but less pronounced effect onVVOL(Fig.2). Additionally, there was a nonlinear
decrease in VAREA as a function of these two variables.
Sphericity had the highest correlation scores with the other shape variables. In the PCA projection, we also observed this constraining effect, where the spread of points along PC2 is markedly restricted in extent and density at lower PC1 scores (i.e. higher sphericity and convexity) (Fig.1). As sphericity and convexity decreased, however, the extent of occupied shape space along PC2 increased.
Growth forms in continuous shape space
There were two apparent gradients that captured how growth forms were distributed in continuous shape space (Fig.1). The first was along PC1 where the massive and sub-massive growth forms were isolated from the branch-ing growth forms. The second was along PC2 within the branching group, with the digitate, corymbose, tabular, laminar and arborescent growth forms distributed roughly in that order. The mean position for a given growth form overall was generally constrained within shape space; however at the colony level, many growth forms were
Fig. 1 Projection of 152 coral colonies in two dimensions by the 1st and 2nd principal components (PC) of six-dimensional shape space. Points coloured by growth form classification with 95% confidence ellipses around the group means. Arrows indicate the loading and direction of each shape variable; VVOL= first moment of volume (mm4),VAREA= first moment of area (mm3), FD = fractal dimen-sion,P= packing,C= convexity,S= sphericity. The first principal component broadly captures variation in skeletal volume compactness
[image:6.595.55.543.57.342.2]found occupying the same area which was partially explained by variation in shape as a function of size.
Changes in colony shape with size
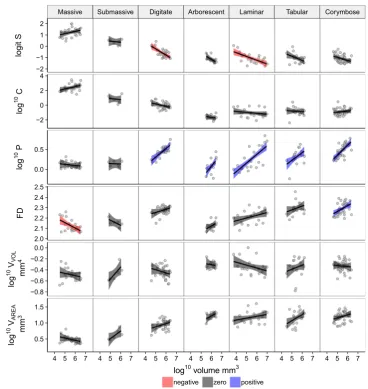
While there were no significant correlations between any shape variable and size (represented as colony volume) across all the observed values together except for packing
(Fig.2), the shape of a colony did change as a function of size within some growth form and shape variable combi-nations (Fig.3). Because each shape variable is size independent (i.e. consistent for the same shape across any range of sizes), the observed changes in shape with size shown here are likely to be genuine differences in shape as size increases. Sphericity decreased with size in the digitate and laminar growth forms. All other growth forms
Fig. 2 Pair-plot of six shape and two size variables used in the study. V= volume, SA = surface area, S= sphericity, C= convexity, P= packing, FD = fractal dimension,VVOL= first moment of vol-ume (mm4),V
AREA= first moment of area (mm3). Bottom triangle
[image:7.595.54.545.56.550.2]maintained constant sphericity across their observed size range except the tabular and arborescent group which appeared to decrease marginally as volume increased despite their slope estimate confidence intervals overlap-ping with zero (Fig.3). Packing increased with size fastest in the arborescent group, followed by the corymbose, laminar, digitate and tabular growth forms, with the mas-sive and sub-masmas-sive colonies remaining constant. The massive group decreased in fractal dimension with size and the corymbose colonies increased with size. All the other variables remained constant as a function of volume based on the 95% confidence intervals. However, there was some evidence to suggest that bothVVOLandVAREAmay scale
with size in some growth forms (Fig.3).
Capturing qualitative growth forms using quantitative variables
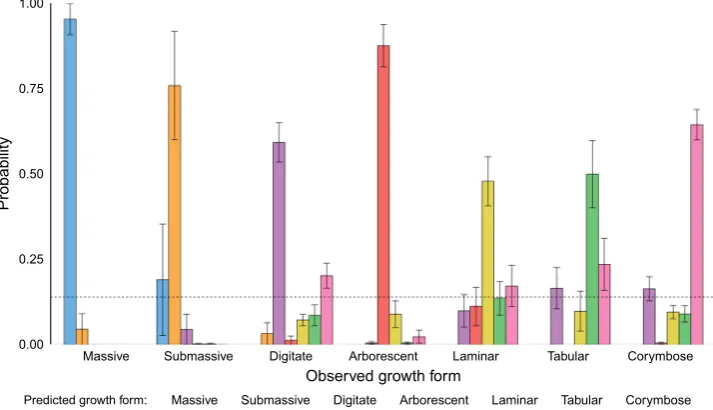
Growth form was correctly predicted by four shape vari-ables in conjunction with volume (Fig.4). The model
included convexity, packing,VVOLand fractal dimension,
with interaction terms between volume and both packing and fractal dimension. The final model explained 74% of the deviance (McFadden’s pseudo R2 of 0.62, d.f = 42). Overall, the model predicted growth forms with a high degree of accuracy (kappa = 0.66). The growth forms in order of highest to lowest balanced accuracy were: massive (95.1%,n= 22), arborescent (92.6%,n= 16), sub-massive (91.3%,n = 6), digitate (81%,n= 30), corymbose (80.7%, n = 41), tabular (77.2%, n= 17) and laminar (70.2%, n = 20). Fractal dimension was added to the model as the three shape variables alone were unable to distinguish between tabular and laminar growth forms, despite the balanced accuracy of all other groups being above 79%. The probability of the correct class in the final model was the highest for all growth forms and was distinct from all other potential classes (Fig.4). The massive group had the highest mean probability (0.95±0.04), with the laminar and tabular having the lowest (0.48±0.07 and 0.50±0.1, respectively).
Fig. 3 Size by shape variable plot for 152 coral colonies faceted by growth form highlighting changes in shape as a function of colony volume. Panel order from left to right based on average PC1 values for each growth form. Lines represent linear regression lines with 95% confidence intervals coloured based on whether the 95% confidence intervals for slope estimates overlapped with zero.S= sphericity,
[image:8.595.178.547.54.444.2]Discussion
We developed six quantitative shape variables and showed that variation in volume compactness, surface complexity and top-heaviness explained much of the variation in coral shape. The observed changes in some variables with colony size resulted in colonies that straddled traditional growth form classifications (Fig.3). We found that four morpho-logical variables can predict traditional growth form clas-sifications with accuracies ranging from 70 to 95%, demonstrating that these variables captured most of the variation encoded in traditional growth form classifications (Fig.4). Our approach was able to place coral colony morphology along continuous axes of functional variation without relying on homologous structures or landmarks, providing a set of morphological traits to explore general links between shape and biological and ecological pro-cesses across multiple growth forms and colonies simultaneously.
Coral morphology was partitioned into three main axes of variation (Figs.1,2). Variation in volume compactness captured a gradient from non-branching to highly branch-ing colonies. However, compactness constrained surface complexity and top-heaviness, where colonies with higher levels of compactness tended to be smooth and bottom heavy. Furthermore, each of the three axes can provide causal explanations for biological processes. For example, volume compactness may be a suitable trait for explaining why more massive morphologies have less variable and
slower overall growth because it captures a gradient from massive to more complex forms and relates to surface area-to-volume ratios (Dornelas et al.2017). Similarly, variation in top-heaviness, capturing a gradient from lower lying to tabular colonies, may be a trait that can test ideas related to benthic competition strategies (e.g. lateral benthic expan-sion vs indirect shading and competitive escape) (Jackson
1979). Variation in surface complexity is related to com-petition and resource use, where colonies with their sur-faces distributed in a complex way have less resources (e.g. light, nutrients) per unit surface area but can have more polyps packed within a given space (Wangpraseurt et al.
2012). For example, if light levels are low, uniformly spreading out surface area maximises incoming light per surface area, which is reflected by increasing abundance of plating colonies as depth increases (Chappell1980). These hypotheses are based on organism performance, but others can be formulated across a range of scales. Examples include low compactness colonies providing habitat for juvenile fishes (Alvarez-Filip et al. 2011), high compact-ness colonies increasing reef framework building (Rasser and Riegl2002), high surface complexity increasing larval recruitment (Hata et al. 2017) and niche diversification being increased by top-heavy, tabular colonies (Kerry and Bellwood 2015). The ability to formulate and test these types of causal hypotheses offers a direct approach for linking form to function not possible using growth forms, and not clouded by metrics that conflate shape and size.
Fig. 4 Observed growth form by predicted growth form probabilities for seven coral growth forms based on a multinomial regression using continuous shape variables. Data generated via a leave-one-out approach, where each observation was left out of the initial model and classification probabilities generated for the missing observation, repeated for each observation in the dataset. Coloured bars represent
[image:9.595.119.476.60.265.2]Growth forms typically occupied specific areas of con-tinuous shape space, but the large amount of overlap between them suggests that growth forms are less distinct than their discrete nature implies (Figs.1, 3). Growth forms were also not distributed along a single trajectory of morphological variation which highlights that morpholog-ical variation between growth forms occurs along multiple axes. Therefore, a single ordinal classification of cate-gories, for example from most to least ‘‘complex’’, would be misguided. Overall, the semi-distinct, semi-overlaying distribution and variation in growth forms at once confirms that growth forms work as morphologically distinct clas-sifications to some degree but at the same time suggests that they are less definite and defined than implied by the nature of assigning a single category. This potentially unsatisfactory statement is made more palatable once morphological plasticity and the observed changes in shape as a function of size within growth form (Fig.3) are con-sidered: not every corymbose colony looks alike in the same way that each member of a wildebeest herd does, and a tabular colony only looks truly tabular after an initial period of growth up and out from the benthos. As such, the size distribution of colonies may have implications for the shape distributions of colonies within a growth form. Within growth form changes in life history traits with size have been highlighted previously (Madin et al. 2014; A´ lvarez-Noriega et al.2016; Dornelas et al.2017), which may be partially explained by ontogenetic changes in morphology and morphology-related processes. While variation in processes between growth forms acts as an indicator that morphology plays an important role, the incomplete and overtly definite nature of growth form categories are unsuitable for establishing causal links. The shape variables proposed here, however, offer an approach for establishing such links due to their quantitative, non-discrete nature.
While this study included a wide range of growth forms and sizes, there are unobserved sources of variation that may fill in or stretch the boundaries of the observed shape space if added. Encrusting colonies, which extend laterally over the surrounding substrate, were not included due to the difficult nature of obtaining whole colony specimens and the fact that the three-dimensional shape of an encrusting colony is contingent on the local substrate it encrusts, although in situ measurements of encrusting forms should be possible via photogrammetry techniques. Columnar colonies are also absent due to a lack of intact specimens in the museum collections. The less populated area of the observed morphospace between the massive and sub-massive growth forms and the remaining growth forms would likely be occupied by columnar colonies given their semi-sturdy, semi-branching shape. While the range in colony size in the study varied over three orders of
magnitude, including both smaller and larger colonies in the dataset may also further fill in and expand the observed shape space. Further, there are likely to be microstructural differences between live colonies and skeletons; however, the focus of this study was on broader differences at the colony scale which are likely to be larger than differences between live and dead colony scans.
Both the approach and results of our study have appli-cations for relating morphology to process in other taxa. Because the variables used in this study require no taxon-specific information to calculate (e.g. landmarks) they can be used to measure and compare morphological variation across any organism where a suitable 3D representation is available. Other colonial organisms such as sponges, soft corals, gorgonians and macroalgae are similar in their range of geometric complexity and are exposed to similar conditions, which suggest that similar trade-off axes should exist in these taxa. Measuring complex colony shapes across taxonomic groups would allow for empirical testing of the theoretical work on morphological strategies laid out by Jackson (1979). In the terrestrial realm, there is a large body of work on the functional ecology of plants which partially overlaps with corals given that both groups are sessile, able to experience partial mortality, and have a photosynthetic component. Going a step further, it should also be possible to compare morphology across a range of organisms, from bacteria to blue whales, to potentially uncover universal drivers of morphological adaptations via the variables outlined in this study.
This study provides a comprehensive set of traits that partition shared and unique variation between growth forms and highlight size-dependent changes in shape within growth forms. These traits have strong theoretical links to many processes important for both corals and their roles as ecosystem engineers and allow for causal expla-nations of phenomena to be established across a broad range of morphological variation. This study provides an empirical toolkit and theoretical backbone for future reef research that is timely given the ongoing work on three-dimensional metrics and methods, and the need to establish a broader understanding of how morphology maps to function across scales.
Data availability Morphological traits data available from figshare.
https://figshare.com/articles/CoralColonyMorphologyData_Whole Colonies_MediumToHighQuality_LaserScanned/8115674. Scripts and functions available from https://github.com/Kylezx1/ QuantifyingCoralMorphology.
Complains with ethical standard
Conflict of interest The authors have no competing interests to declare.
Open Access This article is distributed under the terms of the Creative Commons Attribution 4.0 International License (http://crea tivecommons.org/licenses/by/4.0/), which permits unrestricted use, distribution, and reproduction in any medium, provided you give appropriate credit to the original author(s) and the source, provide a link to the Creative Commons license, and indicate if changes were made.
References
Almany GR (2004) Differential effects of habitat complexity, predators and competitors on abundance of juvenile and adult coral reef fishes. Oecologia 141:105–113
Alvarez-Filip L, Gill JA, Dulvy NK (2011) Complex reef architecture supports more small-bodied fishes and longer food chains on Caribbean reefs. Ecosphere 2:1–17
A´ lvarez-Noriega M, Baird AH, Dornelas M, Madin JS, Cumbo VR, Connolly SR (2016) Fecundity and the demographic strategies of coral morphologies. Ecology 97:3485–3493
Baird AH, Marshall PA (2002) Mortality, growth and reproduction in Scleractinian corals following bleaching on the great barrier reef. Mar Ecol Prog Ser 237:133–141
Barber CB, Dobkin DP, Huhdanpaa H (1996) The quickhull algorithm for convex Hulls. ACM Trans Math Softw 22:469–483 Bell J, Galzin R (1984) Influence of live coral cover on coral-reef fish
communities. Mar Ecol Prog Ser 15:265–274
Bishop JDD (1989) Colony form and the exploitation of spatial refuges by encrusting Bryozoa. Biol Rev 64:197–218
Bruno JF, Edmunds PJ (1997) Clonal variation for phenotypic plasticity in the coral Madracis Mirabilis. Ecology 78:2177–2190
Bythell J, Pan P, Lee J (2001) Three-dimensional morphometric measurements of reef corals using underwater photogrammetry techniques. Coral Reefs 20:193–199
Zhang C, Chen T (2001) Efficient feature extraction for 2D/3D objects in mesh representation. In: 2001 international conference on image processing 2:935–938
Chappell J (1980) Coral morphology, diversity and reef growth. Nature 286:249–252
Cohen J (1960) A coefficient of agreement for nominal scales. Educ Psychol Meas 20:37–46
Connell JH, Hughes TP, Wallace CC, Tanner JE, Harms KE, Kerr AM (2004) A long-term study of competition and diversity of corals. Ecol Monogr 74:179–210
Denny MW (1993) Air and water: the biology and physics of life’s media. Princeton University Press, Princeton
Done T (2011) Corals: environmental controls on growth. In: Hopely D (ed) Encyclopedia of modern coral reefs: structure, form and process. Springer, Dordrecht, pp 281–293
Dornelas M, Madin JS, Baird AH, Connolly SR (2017) Allometric growth in reef-building corals. Proc R Soc Lond B Biol Sci 284:20170053
Filatov MV, Frade PR, Bak RPM, Vermeij MJA, Kaandorp JA (2013) Comparison between colony morphology and molecular phy-logeny in the Caribbean Scleractinian coral genus Madracis. PLOS One 8:e71287
Filatov MV, Kaandorp JA, Postma M, van Liere R, Kruszyn´ski KJ, Vermeij MJA, Streekstra GJ, Bak RPM (2010) A comparison between coral colonies of the genus Madracisand simulated forms. Proc R Soc Lond B Biol Sci 277:3555–3561
Foster AB (1979) Phenotypic plasticity in the reef coralsMontastraea annularis(Ellis & Solander) andSiderastrea siderea(Ellis & Solander). J Exp Mar Biol Ecol 39:25–54
Friedlander AM, Parrish JD (1998) Habitat characteristics affecting fish assemblages on a Hawaiian coral reef. J Exp Mar Biol Ecol 224:1–30
Gladfelter EH, Monahan RK, Gladfelter WB (1978) Growth rates of five reef-building corals in the Northeastern Caribbean. Bull Mar Sci 28:728–734
Glynn PW, Manzello DP (2015) Bioerosion and coral reef growth: a dynamic balance. Coral reefs in the anthropocene. Springer, Dordrecht, pp 67–97
Graham NAJ, Nash KL (2013) The importance of structural complexity in coral reef ecosystems. Coral Reefs 32:315–326 Hata T, Madin JS, Cumbo VR, Denny M, Figueiredo J, Harii S,
Thomas CJ, Baird AH (2017) Coral larvae are poor swimmers and require fine-scale reef structure to settle. Sci Rep 7:2249 Hoegh-Guldberg O (1988) A method for determining the surface area
of corals. Coral Reefs 7:113–116
Hoogenboom MO, Connolly SR, Anthony KRN (2008) Interactions between morphological and physiological plasticity optimize energy acquisition in corals. Ecology 89:1144–1154
House JE, Brambilla V, Bidaut LM, Christie AP, Pizarro O, Madin JS, Dornelas M (2018) Moving to 3D: relationships between coral planar area, surface area and volume. PeerJ 6:e4280 Jackson JBC (1977) Competition on marine hard substrata: the
adaptive significance of solitary and colonial strategies. Am Nat 111:743–767
Jackson JBC (1979) Morphological strategies of sessile animals. In: Larwood G, Rosen BR (eds) Biology and systematics of colonial animals. Academic Press, New York, pp 499–555
Johannes RE, Wiebe WJ (1970) Method for determination of coral tissue biomass and composition. Limnol Oceanogr 15:822–824 Kaandorp JA, Lowe CP, Frenkel D, Sloot PMA (1996) Effect of
nutrient diffusion and flow on coral morphology. Phys Rev Lett 77:2328–2331
Karlson RH (1986) Disturbance, colonial fragmentation, and size-dependent life history variation in two coral reef cnidarians. Mar Ecol Prog Ser 28:245–249
Kerry JT, Bellwood DR (2012) The effect of coral morphology on shelter selection by coral reef fishes. Coral Reefs 31:415–424 Kerry JT, Bellwood DR (2015) Do tabular corals constitute keystone
structures for fishes on coral reefs? Coral Reefs 34:41–50 Koehl MA (1999) Ecological biomechanics of benthic organisms: life
history, mechanical design and temporal patterns of mechanical stress. J Exp Biol 202:3469–3476
Lavy A, Eyal G, Neal B, Keren R, Loya Y, Ilan M (2015) A quick, easy and non-intrusive method for underwater volume and surface area evaluation of benthic organisms by 3D computer modelling. Methods Ecol Evol 6:521–531
Lirman D (2000) Fragmentation in the branching coral Acropora palmata (Lamarck): growth, survivorship, and reproduction of colonies and fragments. J Exp Mar Biol Ecol 251:41–57 Madin JS (2005) Mechanical limitations of reef corals during
hydrodynamic disturbances. Coral Reefs 24:630–635
Meesters EH, Wesseling I, Bak RPM (1996) Partial mortality in three species of reef-building corals and the relation with colony morphology. Bull Mar Sci 58:838–852
Nash KL, Allen CR, Barichievy C, Nystro¨m M, Sundstrom S, Graham NAJ (2014) Habitat structure and body size distributions: cross-ecosystem comparison for taxa with determinate and indetermi-nate growth. Oikos 123:971–983
Naumann MS, Niggl W, Laforsch C, Glaser C, Wild C (2009) Coral surface area quantification–evaluation of established techniques by comparison with computer tomography. Coral Reefs 28:109–117
R Core Team (2015) R: a language and environment for statistical computing. R Foundation for Statistical Computing, Vienna Rasser M, Riegl B (2002) Holocene coral reef rubble and its binding
agents. Coral Reefs 21:57–72
Reichert J, Backes AR, Schubert P, Wilke T (2017) The power of 3D fractal dimensions for comparative shape and structural com-plexity analyses of irregularly shaped organisms. Methods Ecol Evol 00:1–9
Richardson LE, Graham NAJ, Hoey AS (2017a) Cross-scale habitat structure driven by coral species composition on tropical reefs. Sci Rep 7:7557
Richardson LE, Graham NAJ, Pratchett MS, Hoey AS (2017b) Structural complexity mediates functional structure of reef fish assemblages among coral habitats. Environ Biol Fishes 100:193–207
Sarkar N, Chaudhuri BB (1994) An efficient differential box-counting approach to compute fractal dimension of image. IEEE Trans-actions on Systems, Man, and Cybernetics 24:115–120
Sebens KP (1987) The ecology of indeterminate growth in animals. Annu Rev Ecol Syst 18:371–407
Shaish L, Abelson A, Rinkevich B (2007) How plastic can phenotypic plasticity be? The branching coral Stylophora pistillata as a model system. PLOS One 2:e644
Shapiro JA (1995) The significances of bacterial colony patterns. BioEssays 17:597–607
Veron JEN (2000) Corals of the world. Australian Institute of Marine Science, Townsville
Veron JEN (2002) New species described in corals of the world. Australian Institute of Marine Science, Townsville
Vogel S (1996) Life in moving fluids: the physical biology of flow. Princeton University Press, Princeton
Venables WN, Ripley BD (2002) Modern applied statistics with s. Spinger, New York
Wadell H (1935) Volume, shape, and roundness of quartz particles. J Geol 43:250–280
Wangpraseurt D, Larkum AW, Ralph PJ, Ku¨hl M (2012) Light gradients and optical microniches in coral tissues. Front Microbiol 3:316
Zunic J, Rosin PL (2004) A new convexity measure for polygons. IEEE Trans Pattern Anal Mach Intell 26:923–934