Abstract— In this paper we have provided a novel framework of evaluating the performance of fingerprint identification systems. We have introduced a new criteria of good fingerprint image that could be considered as a truly good fingerprint template, and how much this definition is affected on the performance of fingerprint identification System when we integrating different types of biometric devices in the system. Furthermore, we have settled a new evaluation method work OFF line into two parallel directions (PC base & Stand Alone Module base) and taken into consideration all factors that affect the optimal quality of fingerprint image and the evaluation result FAR & FRR.
Index Terms— Fingerprint Image, Quality indicator, FAR , FRR.
I. INTRODUCTION
INGERPRINT recognition is one of the most reliable and effective biometric technologies and is being adopted as the main identity verification method in several large scale applications. Some countries already store fingerprint data in electronic identity documents and many others plan to do so in the near future. Examples of recent large-scale government projects based on fingerprint recognition include: the US-VISIT [12] and PIV [11] programs in the United States, the Biometric Passport in Europe [2], the Malaysian government multipurpose card [7] and the Singapore biometric passport [11] in Asia.
In large-scale biometric applications, the choice of the acquisition devices is one of the most critical issues since many requirements have to be taken into account, such as the need for high-quality images, interoperability requisites and budget.
Typically, in large-scale projects a set of specifications is given for the input devices, in order to guarantee a minimum quality level for some relevant parameters. In the FBI Image Quality Specifications (IQS) for fingerprint images [3] [4], the “quality” is defined as “fidelity” in reproducing the original fingerprint pattern, and it is quantified by parameters traditionally used for vision, acquisition and printing systems: geometric accuracy, gray level dynamic range, Signal-to-Noise Ratio (SNR), Spatial Frequency Response (SFR), etc. This definition of quality is clearly
Manuscript received March 5, 2011; revised April 5, 2011 This work was supported in part by the Royal Commission, Yanbu Industrial Collage . M.M. Abd allah. was with Minia University, Department of Electrical, Communications and Electronics section, Egypt.
He is now with Yanbu Industrial Collage, Department of Electrical and Electronics, KSA.
E-mail: [email protected]
phone: +966-599267125; e-mail: mmustafa@ yic.edu.sa).
appropriate to IAFIS and other applications where the images may be examined by forensic experts. In fact human experts’ comparison techniques heavily rely on very fine details such as pores, incipient ridges, etc., for which the fidelity to the original signal is fundamental.
Skin conditions, uniqueness of features, Dirt, ink, food, etc. will prevent a successful match as well as possibly degrading the fingerprint acquisition device for others. Some individuals have no strongly identifiable fingerprint minutiae. Thus although this is a very successful and mature technology, other forms of biometric identification must be developed.
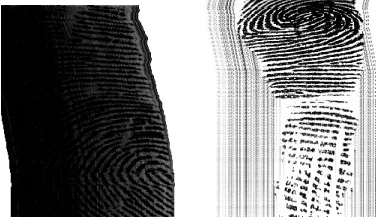
[image:1.595.329.517.582.692.2]Recently, various kinds of fingerprint verification system have been coming on to the market for the purpose of automating access control. And the greater part of that system adopts fingerprint sensors. As shown at Figure 1 Sometimes fingerprint images captured from fingerprint sensors becomes very faded one whose ridgelines cannot be observed, because of luck of moisture on a finger surface. When the excessively faded images are registered in the verification device, this registered data cause error in identifying. So, evaluating fingerprint images before verification is very important. In the same way, as shown at Figure 2 some sensors such as optical scanners have a problem of remnants, remaining after user had put and released his finger on scanner. Remnant is awaked when strong light slant in optical scanner, and it cause the malfunction of the device. The rest of this paper is organized as follows. A brief description regarding the measurement of image quality is given in Section (2). A proposed way that evaluates the fingerprint image quality and how it could discriminate remnants or faded from captured images is discussed in Section (3). Finally, experimental results are given in Section (4) and concluding remarks are made in Section (5).
Fig.1 Examples of Bad Image Quality
Evaluation of Biometric Identification Systems
With New Criteria of Good Quality Template
Mohamed Mostafa Abd Allah
Fig.2 An Example of Remnants
Fig.3 A Flow Chart of the Proposed Evaluation Method
II. IMAGE QUALITY INDICATORS
The measurement of image quality is a very difficult task. Till now, there is no standardized method of accomplishing it has been developed. This difficult task makes us wonder, • Why do we need to measure such quality of fingerprint
image?
• what is the impact of fingerprint image quality on both verification and identification accuracies
o Is it affects the performance of feature extraction?
o Is it often utilized for failure-to-enroll or failure-to-acquire?
o Is it indicates the performance of fingerprint readers according to changes in user behavior and environment?
In this section, we have proposed new subjective criteria of quality of fingerprint image that could be considered as a truly good image. We have explained how many this criterions could affect on the performance of authentication System. It is known that, the input image of a fingerprint from a fingerprint scanner contains a lot of un-useful data. This data need to be removed before further analysis can be performed and specific features of the fingerprint can be extracted. We have to mentions that, the relationship between the fingerprint image quality and the accuracy of the system performance is surprisingly complex. None of the image quality metrics had a correlation better than 0.5 to the final matcher score [4]. A lot of image quality metrics we proposed to determine the quality of ridge detail and
features. A complete understanding of the effect of these factors can be derived through examination of several characteristics. We have summarized these characteristics which effects on the performance of our system and classify it into 3 groups of error sources:
A. Human Parameters Group
• Finger position error source oFinger displacement oFinger rotation. • User action during enrollment
o Finger moved during sensor reading. o Finger Pressure was too heavily or too lightly during enrollment phase.
B. System Parameters Group
• Sensor types.
o Solid sensors o Optical Sensors o Pressure Sensors • The system security level
o High o Low • The application itself
o (In door or Out door applications) • Skin conditions of the individuals
o Finger too wet or too dry o Cut finger
o Otherwise change • Operating environment
o Whether,
o Humidity Ambient, o Temperature range • Age, Sex, Occupation, Scars • Image processing algorithm.
o On gray level o On binary level o On thinning level o Filter types o Filters sequence
C. Information Parameters Groups
• Number of fingers • Number of features • Features weight • Interested Area
• First Touch Area deformation • Image size
• Ridge definition and clarity o Quality of ridge details
o How distinctively ridges and valleys appear in gray levels.
o Percentage of background Area o Overlapping areas
o How large the portion of foreground is compared to the background.
TABLE1
OBSERVATION OF SENSORS TYPES WITH ENVIRONMENTAL & HUMAN FACTORS Sensor Types Environmental Factors Human
Factors Optical Quality decreases
when temperature goes below zero due to dryness of skin
Foreground image gets smaller for the low pressure Skin humidity affects most the image quality Semiconductors No change according
to temperature levels as well as humidity level
Good images not only with the middle pressure but al with the high pressure capacitive No change according
to temperature levels as well as humidity level
capacitive gives better image at the low pressure than at the high pressure & Skin humidity affects most the image quality Thermal No change according
to temperature levels as well as humidity level
[image:3.595.57.280.97.405.2]Due to sweeping, thermal sensor is less affected
TABLE 2
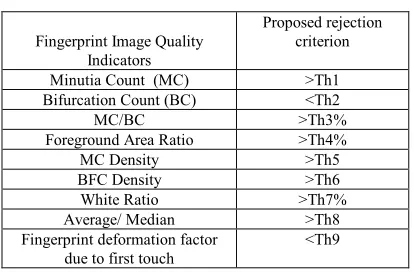
FINGERPRINT IMAGE QUALITY INDICATORS FOR THE INFORMATION PARAMETERS GROUP
Fingerprint Image Quality Indicators
Proposed rejection criterion Minutia Count (MC) >Th1 Bifurcation Count (BC) <Th2 MC/BC >Th3% Foreground Area Ratio >Th4% MC Density >Th5 BFC Density >Th6 White Ratio >Th7% Average/ Median >Th8 Fingerprint deformation factor
due to first touch
<Th9
III. PROPOSEDIMAGEQUALITYSOLUTION In this paper, we propose the way to evaluate fingerprint image quality and how to discriminate remnants or faded from captured images. As shown in figure 3, we propose new criteria using the parameters groups mentioned in the last section to be considered as optimal quality criteria of fingerprint image. The new criteria work for template and input fingerprint image. As shown in figure 4 and regarding to the first parameters group that related to human action, a drawback affect on the optimal quality of fingerprint image due to deformation weight of variant Touch. We believe that it is easily to solve or avoided with proper training during enrollment. And as follow some user guide commands which guides the enrollee’s fingers to achieve a good template image.
Fig.4 Deformation weight due to variant Touch.
A. User Guide Commands For Enrollment Process
Firstly,
• Lie flat on the sensor
• Cover the entire sensor area so it is touching the edges of the sensor area (individuals with small fingers should use thumbs if at all possible)
• Be parallel to the sensor’s sides
• Be placed so the whorl is aligned with center of the sensor
• Not be moved during enrollment.
• Pressure becomes not too soft, not too hard, but just right push.
[image:3.595.66.273.425.563.2]Fig.6 Validity Evaluation Method of the GDS
[image:4.595.55.284.52.187.2](a)Clear fingerprint at Sg=12.5 (B)Faded fingerprint at Sg=7 Figure 7 Fingerprint Image and Measure of Image
Quality
frequency variance analysis. This background segmentation process will be present in the next section. Also, we have perfectly use if certain points or some special feature such as knife cuts, double loop finger class, and special histogram distribution are more infrequent than others, then when one of them is noticed, it is more optimal to focus on this point for the authentication, as it is really improbable that a different persons fingerprint shows the same feature at the same location. In section 4 we will we propose the way to evaluate our fingerprint image quality approach and how much this definition is affected on the Evaluation resultFAR & FRR.
B. Background Segmentation Process
The problem here is if the background has parts similar to the biometric print in intensity. These parts will be categorized as belonging to the print and they can therefore cause unwanted features to appear. Unwanted parts can also appear if the print is really has a bad quality. These parts also need to be removed otherwise false minutiae might appear. This however is not as simple as removing the background since the gray scale values are similar to the “good parts” of the print. Bad parts and the background will consist mainly of parts where there is no unifying direction. One way of finding parts that are un-useful is the use of field direction analysis discussed in [5]. The idea is to remove all parts that do not follow an even pattern as the valleys and ridges of the fingerprint. The simple way of removing the background is to use a threshold value that separates the back-ground from the print by making all of the gray scale higher than the threshold belongs to the print and the lower values to the background. This process is called segmentation [10]. If the threshold value is chosen globally without consideration of the specific image it is necessary to normalize the image before the segmentation is performed.
Fig.5 The Proposed Enrollment Procedures of Template and Input Fingerprint Image
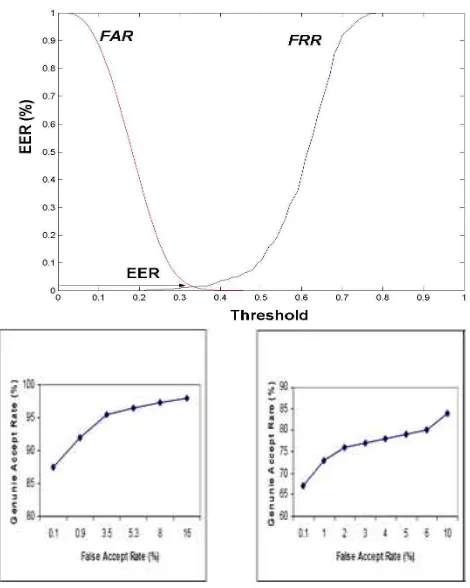
Fig.8 ROC curves correspond to application of image-quality parameter.
Start Count = 0 Capture and Process Finger
Registration is OK NO
NO NO NO
If Total BifuCount > BifuCountThreshold
If Bk_pixCount > Bk_pixCount Threshold
If Img_Quality is OK
Save Minutia Code Count++
[image:4.595.63.287.229.345.2] [image:4.595.310.545.475.769.2]TABLE3
IMAGE QUALITY APPROACH FOR SYSTEM PARAMETERS GROUPS System Group Interested Parameters Proposed Action 1. Sensor Parameters Gain Control Discharge time Discharge Current
Adoptive Auto tuning
2. Gray Scale Variance &
GDS group Delay spectrum
pattern
Gray Scale Pixel Level &
GDS spectrum
Classify the Image to (Wet, Normal, Dry) &Check faded image
3. Real Input Image Area
Foreground Area % (FA)
Check small input Finger
4.Fingerprin t deformation
Large shift & Large Rotation & factor due
to first touch
Check input Deformation
Whether & Humidity
Whether & Humidity Ambient Temperature
weight factors
Adoptive Auto tuning weight base on Whether & Humidity
range
History of fingerprint Image
Weight factors due to difficulty for enrolment
Or Matching fingerprint
Adoptive & control Security level
IV. EXPRENMENTALRESULTS
The proposed technique has been tested over 4320 images. The fingerprint data are captured from 60 people by using three different kinds of fingerprint sensors, optical, a capacitive, and semiconductor sensor. 24 fingerprint image samples per person for each sensor are captured. That mean the total field test data were 60person x 8fingers x 3samples x 3 sensor = 4320 fingerprint Image. The size of fingerprints is 128×128pixels. In the feature extraction process, a group delay spectrum (GDS) pattern is extracted from each horizontal and vertical line of a fingerprint image. It using the linear predictive analysis of an 8-pole filter as shown in figure 6. The distance between the GDS patterns of a reference and the input is calculated by GDS pattern matching [6]. First, we investigate evaluating fingerprint image quality. Fig 7 shows clear fingerprint image and faded one with measure of image quality Sg, and the measure becomes larger in clear fingerprint image and smaller in
faded image. Receiver Operating Characteristic (ROC) curve is shown at figure 8, that plots the Genuine Accept Rate (GAR) against the False Accept Rate (FAR) at different thresholds on the matching score. ROC curves correspond to the comparison between performance without examination in image-qualitywhich means we don’t reject faded images by using that measure and performance with image-quality parameters and rejecting of faded images. Our approach outperforms the proposed approach over thin range of FAR values. At 1% FAR, the proposed matcher gives a GAR of 91% while without examination in image-quality matcher gives a GAR of 73%. Under the terms of Examining both registered data, verification data and rejecting faded images, recognition rate is improved to 99.6[%]. But under these terms, some people have a difficulty to use this fingerprint verification device.
V. CONCLUSION
The mainly contributions of this paper are to invent a method to utilize parameters groups that has a relation with fingerprint image quality and fingerprint image information to got a perfect enrollment procedure results in the capture of the highest quality fingerprint image(s). Another merit of the proposed approach is that it does not depend on the sensor type. Therefore, the proposed approach is more robust and implemental in practice. The proposed approach evaluation result FAR & FRR as shown in Fig.8, works as better as some previously presented approaches. The defect caused by remnant was perfectly cleared. This evaluation makes it possible that the proposed approach can be implemented into an embedded system, such as DSP-based fingerprint identification module.
REFERANCE
[1] Chen, Y., Dass, S., Jain, A.: Fingerprint quality indices for predicting authentication performance.AVBPA (2005) 160–170 [2] Lim, E., Jiang, X., Yau, W.: Fingerprint quality and validity
analysis. ICIP (2002) 469–472
[3] Shen, L., Kot, A., Koo,W.: Quality measures of fingerprint images. AVBPA (2001) 266–271
[4] Tabassi, E.,Wilson, C.L.: A new approach to fingerprint image quality. ICIP (2005) 37–40
[5] Uchida, K.: Image-based approach to fingerprint acceptability assessment. ICBA (2004)294–300
[6] Hong, L., Wan, Y., Jain, A.: Fingerprint image enhancement: Algorithm and performance evaluation. IEEE Transaction on Pattern Recognition and Machine Intelligence 20 (1998) 777–789 [7] Gonzalez, R.C.,Woods, R.E.: Digital Image Processing. Prentice
Hall, Upper Saddle River, NJ (2002)
[8] Candela, G.T., Grother, P.J.,Watson, C.I.,Wilkinson, R.A.,Wilson, C.L.: Pcasys - a patternlevel classification automation system for fingerprints. Technical Report NISTIR 5647 (1995)
[9] Zuiderveld, K.: Contrast Limited Adaptive Histogram Equalization. Academic Press (1994)
[10] Jea, T.Y., Chavan, V.S., Govindaraju, V., Schneider, J.K.: Security and matching of partial fingerprint recognition systems. In: SPIE Defense and Security Symposium. (2004)
[11] Singapore Biometric Passport web site, http://app.ica.gov.sg, February 2008.