3327
©IJRASET: All Rights are Reserved
Solar Power Prediction using Recurrent Neural
Network
Sunil D Rathod
1, Aniket
2, Mrigais Pandey
3, Dhananjay Jha
4, Harjit Singh
51, 2, 3, 4, 5Computer Engineering Department, Dr. D Y Patil School of Engineering, Pune
Abstract: The non-renewable sources of energy are limited and will get exhausted eventually. Looking at the current need of electric power and its fulfilment, the non-conventional way of generating this energy has become essential. Climate change and energy crisis have motivated us to make use of renewable non-conventional source of energy. This paper discusses the theoretical assumptions and design aspects of developing a Model which will predict the solar power generation beforehand. The paper aims at promoting the use of renewable source of energy by developing a model which will accurately predict the solar power generation. The suggested model uses Long Short Term Memory Recurrent Neural Network (LSTM RNN) Algorithms to predict the power generation which will be beneficial to both Industries and Residents.
Keywords: Solar Power, Long Short Term Memory (LSTM), Recurrent Neural Network (RNN), Machine Learning (ML)
I. INTRODUCTION
Climate change and energy crisis have led us to use renewable energy use and Solar Energy is one of the most appropriate option for use. It is renewable as well as non-conventional source of energy and available in abundance [1]. Power generated using Solar Photo Voltaic (PV) Panels depends on many external factors namely weather and meteorological factors. Factors such as Wind, Cloud and Rain also affect the rate of Power Generated. The proposed model uses the methodology which will have high level of accuracy in predicting solar power. To do so we have used LSTM RNN Machine Learning Algorithms after a brief study done by us in previous Survey Paper [7]. Using this trained ML model we will pass current weather data fetched through API to the model and the predicted solar power generation will be displayed.
II. MOTIVATION
Roof-top mounted solar photovoltaic (PV) systems are becoming an increasingly popular means of incorporating clean energy into the consumption profile of its users [2], [3]. It is one of the most efficient renewable sources of energy which can be used over non-renewable sources of energy such as Fossil Fuels. There are certain influencing factors such as environment friendly which promote the use of Solar Energy and it is also safer than traditional electricity current. The motivation behind taking up this project was to implement a model which would help people manage the energy resources in an efficient and economical way. This model can help the user to pre-plan and use the power according to the prediction made by RNN and statistical techniques and avoid any sorts of loss due to sudden weather changes which are not in their control. Application of this model incurs low cost for installation (economical), safer and comparatively more available than other energy resources. Electric utilities often allow the inter-connection of such systems to the grid, compensating system owners for electricity production [3]. As the systems grow in number and their contribution to the overall load profile becomes increasingly significant, it becomes imperative for utilities to accurately account for them while planning and forecasting generation [3].
III. DATASETANDFEATURES
The solar energy output necessary to power the campus of the University of Illinois in Urbana-Champaign was obtained from publicly-available repository [4]. The weather dataset used is historical weather data from Amherst, MA, and is maintained by the University of Massachusetts, Amherst – Computer Science Weather Station. It was obtained using the methodology detailed by National Oceanographic and Atmospheric Administration [8], [9]. We pre-processed these to obtain the numerical values for each feature and time-averaged them to obtain a consistent hourly resolution.
Weather Features Unit Weather Features Unit
Cloud Coverage % range Relative Humidity %
Visibility Miles Wind Speed Mph
Temperature ⁰C Station Pressure inchHg
Dew Point ⁰C Altimeter inchHg
3328
©IJRASET: All Rights are Reserved
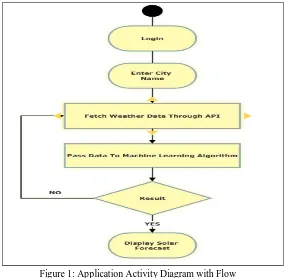
[image:2.595.160.447.276.554.2]results.
Figure 1: Application Activity Diagram with Flow
V. LSTMRECURRENTNEURALNETWORKALGORITHMANDMETHOD
The prediction learning method implemented is an LSTM (Long Short Term Memory) recurrent neural network. We have assumed that a recurrent neural network is capable of capturing time-dependent trends in the data because feedback loops enable RNN’s to exhibit memorization of temporal behaviour. Developing the Recurrent Neural Network involved sampling performance on the basis of a wide range of modifiable parameters which includes the size and number of hidden layers, types of activation functions, type of optimization and regularization, batch and epoch sizes, and cross-validation methods.
A. Forward Propagation for the basic Recurrent Neural Network
The basic RNN that we have implemented has the structure below Steps:
1) Implement the calculations needed for one time-step of the RNN.
2) Implement a loop over Tx time-steps in order to process all the inputs, one at a time
3329
[image:3.595.51.537.90.314.2]©IJRASET: All Rights are Reserved
Figure 2: RNN Working
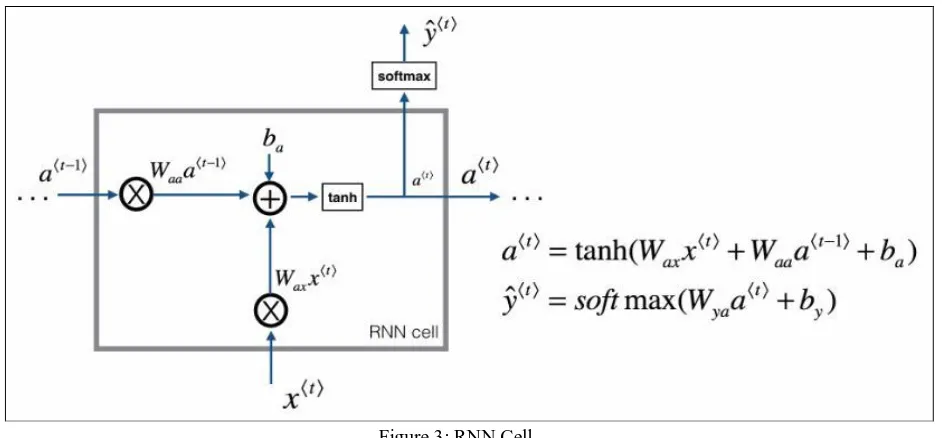
B. RNN Cell
A Recurrent neural network can be seen as the repetition of a single cell. First we have implemented the computations for a single time-step. The following figure describes the operations for a single time-step of an RNN cell.
Figure 3: RNN Cell
1) Compute the hidden state with tanh activation: a<t>=tanh(W
axx<t>+Waaa<t-1>+ba)
2) Using the new hidden state a<t>, compute the prediction y<t>=softmax(Wya a<t>+by) 3) Here Wax is set of weather parameters governing the connection from x to the hidden layer.
4) Waa is vectorized weather parameter for horizontal connection and Wya governs the output prediction. What this notion
notation means is to just take the two vectors and stack them together.
5) ba on top indicates a bias used for computing activation output.
6) softmax function outputs a vector that represents the probability distributions of a list of potential Solar Power outcomes.
Including an LSTM layer vastly improved performance, while the nonlinear hyperbolic tangent and sigmoid layers exhibited lower errors than standard linear activation functions.
[image:3.595.70.541.382.601.2]3330
[image:4.595.125.484.151.288.2]©IJRASET: All Rights are Reserved
Figure 4: Depiction of flow of hidden layers in optimized neural network
VI. IMPLEMENTATION
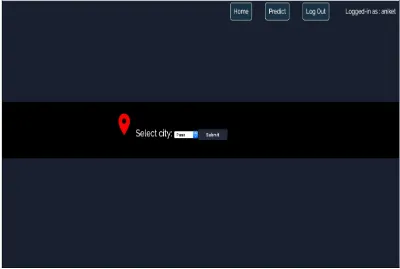
The project demonstrates a web based Solar Power Predictor Application hosted on Flask server. Firstly we trained our model using Long Short Term Memory, Recurrent Neural Network ML Algorithm. The activation functions used in the hidden layer of RNN are Sigmoid and Tanh. The model was trained using the dataset obtained from repository mentioned in Section III of this paper. After training the algorithm we dumped our model in Pickle. To do the prediction of Solar Power user can login into web based app and select the city name for which prediction has to be done. After selecting the city, the API key provided by openweathermap.org and darksky.net will fetch weather data in JSON format. In the background this fetched data will be scaled using the scale factor obtained while training the algorithm. After scaling the data will be passed to the pickle and the output predicted by the model will again be scaled to KWh and displayed as the amount of Solar Polar generated for the queried city. An example of Solar Power predicted for Pune is displayed below which tells us the amount of Solar Power which will be generated by an individual Solar PV System in Pune City.
[image:4.595.104.504.452.721.2]3331
©IJRASET: All Rights are Reserved
Figure 6: Predicted Solar Power
VII. FUTURESCOPE
Towards this end, machine learning and statistical techniques can be used to dynamically learn the relationship between different weather conditions and the energy output of PV systems. This is being done to optimize the energy structure and improve the performance of a PV system. Accurate prediction of PV power output is required to make better generation plans, support the spatial and temporal compensation, and achieve coordinated power control, so that the need for energy storage capacity and operating costs can be reduced. Our aim is to investigate the future engineering methodologies, which can be used to increase the overall prediction accuracy. Further it can also be developed into an Application for better handy solution. Moreover if we connect it to IoT various other use such as automatic switching of the lights to save the power can be implemented.
VIII. CONCLUSIONS
This model will help user predict the Solar Power Generation. It will guide the user through unfamiliar situation which can occur so that he could save power prior itself. Currently there is not much use of Solar Power in India but once the people start realizing the importance of renewable sources of energy, they will eventually adopt this prediction model to conserve the Solar Energy. It will also help in promoting use of renewable source of energy.
IX. ACKNOWLEDGMENT
It gives us great pleasure in presenting the paper on “Power Forecast of Solar Panels using Machine Learning Techniques”. We would like to take this opportunity to thank our guide Dr. Sunil D Rathod for giving us all the help and guidance we need with indispensable support, suggestions and motivation during course of the paper writing work. We are really grateful to him. His valuable suggestions were insightful. We are also grateful to Dr. Soumitra Das, Head of Computer Engineering Department, DYPSOE, Pune. Our special thanks to Dr. M Z Shaikh, Director DYPTC who motivated us and created a healthy environment for us to learn in the best possible way. We also thank all the staff members of our college for their support and guidance.
REFERENCES
[1] N. Sharma, P. Sharma, D. Irwin, and P. Shenoy, “Predicting solar generation from weather forecasts using machine learning,” in Smart Grid Communications (SmartGridComm), 2011 IEEE International Conference on, pp. 528–533, IEEE, 2011.
[2] Gensler-Janosch, A., et al. “Deep Learning for solar power forecasting — An approach using AutoEncoder and LSTM Neural Networks.” 2016 IEEE International Conference on Systems, Man, and Cybernetics (SMC), 2016.
[3] Mayukh Samanta, Bharath Srikanth, Jayesh Yerrapragada, “Short Term Power Forecasting Of Solar PV Systems Using Machine Learning Techniques”. [4] http://s35695.mini.alsoenergy.com/Dashboard/2a5669735065572f4a42454b772b714d3d
[5] https://machinelearningmastery.com/use-keras-deep-learning-models-scikit-learn-python/.
[6] Adele Kuzmiakova, Gael Colas, Alex McKeehan, “Short-term Memory Solar Energy Forecasting at University of Illinois”
[7] Sunil Rathod, Aniket, Mrigais Pandey, Dhananjay Jha, Harjit Singh, “Power forecast of Solar Panels using Machine Learning Techniques: A Survey” in IJSART- Volume 4 Issue 10 – October 2018
[8] https://github.com/sborgeson/local-weather.
[9] NOAA website : https://www.ncdc.noaa.gov/cdo-web/datatools/l cd [10] www.openweathermap.org