Intracranial Vascular Stenosis and Occlusive
Disease: Evaluation with CT Angiography,
MR Angiography, and Digital
Subtraction Angiography
Suzie Bash, J. Pablo Villablanca, Reza Jahan, Gary Duckwiler, Monica Tillis, Chelsea Kidwell, Jeffrey Saver, and James Sayre
BACKGROUND AND PURPOSE: Although digital subtraction angiography (DSA) provides excellent visualization of the intracranial vasculature, it has several limitations. Our purpose was to evaluate the ability of helical CT angiography (CTA) to help detect and quantify intracranial stenosis and occlusion compared with DSA and MR angiography (MRA).
METHODS:Twenty-eight patients underwent CTA, DSA, and 3D time-of-flight (TOF) MRA for suspected cerebrovascular lesions. All three studies were performed within a 30-day period. Two readers blinded to prior estimated or calculated stenoses, patient history and clinical information examined 672 vessel segments. Lesions were categorized as normal (0 –9%), mild (10 –29%), moderate (30 – 69%), severe (70 –99%), or occluded (no flow detected). DSA was the reference standard. Unblinded consensus readings were obtained for all discrepancies.
RESULTS:A total of 115 diseased vessel segments were identified. After consensus interpre-tation, CTA revealed higher sensitivity than that of MRA for intracranial stenosis (98% versus 70%,P< .001) and occlusion (100% versus 87%,Pⴝ.02). CTA had a higher positive predictive value than that of MRA for both stenosis (93% versus 65%, P < .001) and occlusion (100% versus 59%, P< .001). CTA had a high interoperator reliability. In 6 of 28 patients (21%), all 6 with low-flow states in the posterior circulation, CTA was superior to DSA in detection of vessel patency.
CONCLUSION:CTA has a higher sensitivity and positive predictive value than MRA and is recommended over TOF MRA for detection of intracranial stenosis and occlusion. CTA has a high interoperator reliability. CTA is superior to DSA in the evaluation of posterior circulation steno-occlusive disease when slow flow is present. CTA results had a significant effect on patient clinical management.
Stroke is the third leading cause of mortality and the leading cause of morbidity in the United States. Ath-erosclerotic disease results when soft and calcific plaque accumulates in the vessel wall leading to lu-minal narrowing. The presence of plaque predisposes to vascular thrombosis or ischemic states leading to stroke (1). Lutsep and Clark (2) found that 15% of patients with cortical symptoms or signs of stroke
have intracranial stenosis of 50% or greater at MR angiography (MRA) or conventional angiography. Studies have shown the potential benefit of angio-plasty, with or without stent placement, of symptom-atic stenotic intracranial arteries (3, 4). Given recent advances in pharmacologic treatment for stroke risk factors, including atherosclerosis, and an emerging literature on endovascular therapies for intracranial stenosis, it is important to both detect and accurately assess the severity of intracranial stenoses.
Digital subtraction angiography (DSA) has long been considered the reference standard for imaging evaluation of intracranial stenosis and occlusion. DSA provides excellent visualization of the intracra-nial vasculature. However, it has several limitations including a high skill required to perform the study and the necessity for intraarterial catheterization, which results in increased morbidity and mortality for Received April 15, 2004; accepted after revision September 21.
From the Departments of Radiology (S.B., J.P.V., R.J., G.D., M.T., J. Sayre) and Neurology (C.K., J. Saver), David Geffen School of Medicine, University of California at Los Angeles.
Presented at the 40thannual meeting of the American Society of Neuroradiology, Vancouver, BC, 2002.
Address correspondence to Suzie Bash, MD, David Geffen School of Medicine at UCLA, 10833 Le Conte Ave, BL-133C/CHS, Los Angeles, CA 90095-1721.
©American Society of Neuroradiology
the patient, with a 0.7% stroke risk associated with each procedure (5).
Given the disadvantages of DSA, CT angiography (CTA) and 3D time-of-flight (TOF) MRA have emerged as feasible noninvasive techniques to evalu-ate the intracranial vasculature. The purpose of this study was to evaluate the ability of CTA to help detect and quantify intracranial stenosis and occlusion com-pared with DSA and 3D-TOF MRA.
Methods
We retrospectively compared CTA, DSA, and MRA images of 28 patients who underwent these examinations between May 1997 and November 2000 for suspected intracranial atheroscle-rotic disease. All three studies were obtained within 30 days of each other to reduce the possibility of dynamic vascular change affecting vessel patency over time. Inclusion criteria were symptoms of cerebral ischemia with or without neurologic deficit and transient ischemic attack. Exclusion criteria were the CTA, DSA, and MRA examinations separated by more than 30 days, image quality inadequate for interpretation, known or suspected vasospasm, and interposed intraarterial or intravenous thrombolysis or clot retrieval therapies. In one patient, technical limitations rendered the CTA images inade-quate for interpretation in the basilar artery, and this vessel was excluded from evaluation in all modalities. Institutional review board approval for the study design was obtained.
Image Acquisition
Standard clinical protocols were used for CTA, DSA, and MRA with an emphasis on high spatial resolution.
The CTA protocol involved a 120-kV peak, 280 –300 mA, 18-cm FOV, 512 ⫻512 matrix, 1.0 –1.5 pitch, 1-mm section collimation, 0.35 ⫻0.35 ⫻0.5-mm voxel size, 0.5– 0.625-mm reconstruction interval, 9 –13-cm slab thickness, and 30 – 60-second scanning time. Images were acquired with a single- (CTi 9800; GE Medical Systems, Milwaukee, WI) or multi– detector row (Lightspeed 4 Detector; GE Medical Systems) scanner. Patients received 120 –200 mL of intravenous iohexol (Om-nipaque 350; Amersham Health, Princeton, NJ) delivered through a 22-gauge or larger antecubital catheter at 3 mL/s. A timing run was performed before every CTA study. Timing runs were obtained at the level of the midneck. Contrast ma-terial 20 mL was delivered at 3 mL/s, and 15 images are obtained at the same level by using a 1-second scan with a 1-second interscan delay following a 10-second initial delay. A region-of-interest graph plotting attenuation (in HU) versus time was then generated at the console to determine the opti-mal time delay for the helical scan. Total delay was obtained by adding the up-front delay to the timing delay.
The DSA protocol involved femoral puncture and selective injection of cervical vessels employing the Seldinger technique, by using 6 –9 mL of iohexol (Omnipaque 240) per injection. The DSA runs were obtained at 3– 4 frames per second to late venous phase, by using a matrix of 1024⫻1024, 15-cm FOV, pixel size 0.15 ⫻ 0.15. Anteroposterior, lateral, and oblique projections were acquired in all cases. Magnification views were acquired when needed to clarify significant findings.
The MRA protocol was a 3D TOF MR technique per-formed with a 1.5-T Magnetom Vision (Siemens, Erlangen, Germany) or LX (GE Medical Systems) unit with use of the following parameters: 35/7.2 (TR/TE), 200⫻512 matrix, and 20-cm FOV. Postprocessing was performed by using a maxi-mum intensity projection (MIP) rendering, generating 22 total, 16.4° incremental rotations in somersault and clockwise rota-tion. Superior saturation pulse was employed. Source images were generated.
CTA postprocessing was performed on a Vitrea workstation,
versions 3.0 –3.3 (Dual Processor 850 MHz-1GHz Pentium III) by using perspective volume rendering for lesion detection. Two-dimensional, gray-scale, axial images were used in all cases for lesion quantitation. Two-dimensional, gray-scale, sag-ittal and coronal multiplanar reformations (MPRs) and curved oblique reformations were generated as necessary in all cases of suspected disease for lesion confirmation and characterization.
Image Analysis
Part I: Comparative analysis of CTA, DSA and MRA. The CTA images were reviewed prospectively for presence, loca-tion, and severity of lesions by a single independent blinded reader and retrospectively for lesion presence and severity by a second blinded reader. Both blinded readers (S.B., P.V.) pro-spectively reviewed DSA and MRA images for lesion presence, location, and severity.
Each imaging technique data set was processed completely, and the cases were presented in a random order. Both readers were blinded to all prior estimated or calculated stenoses as well as to the patient’s history and all clinical information. Both radiologists independently characterized each stenotic lesion as focal or segmental, and eccentric or concentric.
All CTA, DSA, and MRA lesions were measured by using visual estimation of the full-width half-maximum of the section sensitive profile at the margins of the opacified vessel.
For all imaging modalities, the North American Symptom-atic Carotid Endarterectomy Trial (NASCET) criteria were used for stenosis calculations: [(Dn⫺Ds)/Dn]⫻100, whereDn is normal diameter and Ds is stenosed diameter. NASCET stenoses were grouped according to the following grading scale: normal (0 –9%), mild (10 –29%), moderate (30 – 69%), severe (70 –99%), or occluded (no flow detected).
Diseased vessels were defined as those whose NASCET stenosis rates fell into the moderate, severe, or occluded cate-gories. Specifically, stenoses graded as normal (0 –9%) and mild (10 –29%) were not considered diseased vessel segments and were excluded from analysis.
On DSA images, a lesion was defined as occluded if no flow was seen in a portion of a vessel segment either with antero-grade injection or via reflux. On MRA images, a lesion was defined as occluded if there was a long-segment flow void. Short-segment flow voids were assumed to represent severe stenoses. On CTA images, an occlusion was defined as nonvi-sualization of a vessel segment on the 2D MPR images.
CTA stenoses were detected by using the 3D image data, with free-form rotation of the arterial volume centered at all major branch points of the circle of Willis, and by using 22 standard image projections in both clockwise and tumble rota-tion direcrota-tions. After identificarota-tion of a candidate stenosis, reduction in luminal caliber was documented on the 2D gray-scale MPR images. Lesion measurements were obtained from the 2D MPR images, always orthogonal to the longitudinal axis of the artery. CTA stenosis quantitation was performed using the 2D gray-scale MPR images with approximate window and level settings of 1000 and 500 HU, respectively. Digital internal calipers were used for CTA lesion measurements with linear accuracy of⫾10% for measurements less than 2 mm and⫾ 4% for measurements of 2–10 mm.
DSA stenosis quantitation was performed with Mitutoyo digital calipers (Mitutoyo Corporation, Japan). Single frame, middle arterial phase angiogram views were used for DSA measurements. To account for magnification differences, all DSA measurements were obtained from equal magnification views, with the assumption based on published reports of pathologic specimens that the average adult supraclinoid inter-nal carotid artery (ICA) measures 3.63 mm (6). Proportiointer-nality equations were then generated to calculate normal diameter (Dn), stenosed diameter (Ds), and percentage stenosis.
on the MIP image showing the narrowest luminal diameter and the first normal distal diameter with parallel walls. Both the clockwise rotation and tumble projection images were re-viewed. Digital caliper apertures were scaled to the sidebar image scale to obtain the actual stenotic and normal luminal dimensions. Source images also were used to confirm stenosis location and severity.
Assessed intracranial vessels included the following bilateral arterial segments: high cervical ICA, petrous ICA, cavernous ICA, supraclinoid ICA, A1, A2, M1, M2, intracranial vertebral, P1, and P2, as well as the proximal basilar and distal basilar artery. Therefore, a total of 672 vessel segments were examined in the 28 patients. These vessel segments were chosen because they are large and medium-sized arterial segments generally visualized with all three imaging modalities (DSA, CTA, and MRA). The anterior inferior cerebellar artery, posterior infe-rior cerebellar artery, anteinfe-rior communicating artery, and pos-terior communicating artery were not assessed, as these vessels often measure less than 1 mm and were not consistently seen with all three imaging modalities. If an intracranial artery was uniformly and segmentally of decreased caliber throughout its length, compared with the contralateral side, this vessel seg-ment was considered hypoplastic, and no stenosis was attributed.
Standard contingency tables were generated for sensitivity, specificity, and positive and negative predictive values by using DSA stenosis and occlusion values as the reference standard.
Part II: Interoperator reliability.The interoperator reproduc-ibility for the severity of CTA lesion grading was assessed. Two separate readers independently measured lesion sever-ity on CTA images in a blinded fashion. NASCET criteria were reapplied by the second blinded reader to the preiden-tified and graded sites of stenosis by the initial interpreting neuroradiologist.
Data Analysis
Part I: Comparative analysis of CTA, DSA, and MRA for intramodality discordancy. After the blinded interpretation of all modalities by both independent readers, the DSA, CTA, and MRA images were then reviewed by both readers to obtain consensus in cases of intramodality discordant readings, where the presence of a stenosis was in question. During intramodal-ity discordancy evaluation, the readers remained blinded to the interpretation of the other two modalities.
Intramodality discordant readings were defined as those occurring when one reader made an interpretation error (“reader error”). This was recorded on the Reader Error Rate Chart (Table 2). The intramodality discordant cases, where the presence or absence of a stenosis or occlusion within a vessel segment of a specific technique was not initially in agreement between both readers, were included in the contingency tables for sensitivity, specificity, positive and negative predictive val-ues, and accuracy, only after a consensus decision regarding disease state had been agreed on.
Part II: Comparative analysis of CTA, DSA, and MRA for intermodality discordancy.The DSA, CTA, and MRA images were then reviewed in a side-by-side fashion by both readers to obtain consensus of true disease status in cases of inter-modality discordant readings. For example, if DSA demon-strated an occlusion in a vessel segment, but the correlative CTA image demonstrated a patent but stenotic lumen, the lesion was either interpreted as a probable false-positive finding for occlusion at DSA or probable interval restoration of blood flow. This conclusion was based on the assumption that a contrast material-opacified vessel reflects true vessel patency. Probable interval spontaneous restoration of blood flow was concluded if there was no significant stenosis in the vessel proximal to the apparent occlusion. In this manner, false-negative findings for vessel occlusion were also as-FIG 1. Example of a DSA false-positive
finding for basilar occlusion in a patient with low-flow state due to a severe steno-sis of the left vertebral artery.
AandB, Frontal (A) and lateral (B) mid-dle arterial phase DSA images show se-lective injection of dominant left vertebral artery (shown in anatomic orientation). Note the severe stenosis of the left verte-bral artery (long arrow) and a small amount of reflux down the nondominant right ver-tebral artery (short curved arrow inA). The basilar artery distal to the origin of the left anterior inferior cerebellar artery is not opacified and therefore appears occluded (open arrow), even on late arterial and ve-nous images (not shown).
C, Lateral projection, left ICA injection, middle arterial phase DSA image shows minimal retrograde filling of the distal basi-lar artery (arrow) through the posterior communicating artery to the level of the superior cerebellar arteries, suggesting segmental occlusion of the midbasilar artery.
D, Corresponding volume-rendered 3D CTA image in anatomic orientation. CTA image was obtained 3 days before DSA and shows a severe left vertebral artery stenosis (black arrow) associated with heavy calcific atheromatous plaque. How-ever, CTA depicts the basilar artery as patent. In addition, the CTA image
sessed. The Pvalues were calculated by using Bennett’s2 statistic (7).
Part III: Interobserver reliability.To assess interobserver reli-ability for CTA, the calculated stenosis measurements of the first reviewer were compared with those of the second re-viewer. Vessel caliber was measured to grade lesions from 0% (no stenosis) to 100% (occluded). A Pearson correlation coef-ficient value and mean reader difference values were calculated to assess interobserver reliability in lesion grading.
Results
Of the 672 intracranial arterial segments examined, 115 diseased artery segments (17%) were identified with DSA. Again, diseased vessel segments were de-fined as those segments that fell into the moderate or severely stenotic, or occluded categories. Only a small number of vessel segments fell into the mildly ste-nosed category (10 –29%), and these vessels were not characterized as diseased because they were consid-ered unlikely to be of clinical relevance. Therefore, the mildly stenosed vessel segments were not used in the contingency tables to assess the sensitivity, spec-ificity, positive predictive value, and negative predic-tive value of each technique.
There was a heterogeneous distribution of disease throughout all vessel segments examined (Table 1), with anterior circulation vessels composing 42% and posterior circulation vessels composing 58% of all lesions encountered.
The female-to-male ratio was 12:16 (43:57%). Age range was 24 –79 years, with a mean age of 58 years. The mean, median, and mode time of separation of the three studies was 1 day, with a range of 0 –30 days. Each patient had a variable number of diseased vessel segments with a mean of 4, mode of 3, and range of 1–13 per patient. The number of mildly FIG 2. Example of a DSA false-positive finding for basilar occlusion in a patient with a low- or balanced-flow state due to a severe stenosis of the basilar artery.
AandB, Frontal (A) and lateral (B) middle arterial phase DSA images show selective injection of a dominant left vertebral artery (DSA images shown in anatomic orientation). Note absent cephalad flow in the basilar artery distal to the midbasilar segment (arrow), suggesting basilar artery occlusion.
C, Lateral projection, right ICA injection, middle arterial phase DSA image shows minimal retrograde filling of the distal basilar artery (arrow) through the posterior communicating artery. The midbasilar segment is not visualized, suggesting segmental occlusion of the midbasilar artery.
D, CTA was performed 12 days before DSA. This volume-rendered 3D CTA image, in anatomic orientation, shows a severe, eccentric, focal midbasilar stenosis (arrow); however, the basilar artery is clearly patent. This was verified on the gray-scale 2D source image.
E, Axial 2D curved oblique CTA reformation image, frontal projection, shows focal midbasilar artery stenosis (arrow) with 79% stenosis severity.
[image:4.585.52.535.53.350.2]F, TOF MRA image with frontal oblique MIP shows a focal flow gap in the midbasilar artery (arrow).
TABLE 1: Location of lesions
Artery
No. (%) of Lesions (n⫽115)
Internal carotid 27 (23)
Vertebral 26 (23)
Posterior cerebral 24 (21)
Basilar 17 (15)
Middle cerebral 17 (15)
[image:4.585.307.534.493.588.2]stenotic vessel segments identified with each tech-nique in our patient population was low (DSA, n⫽5; CTA, n⫽3; and MRA, n⫽1). Also, the number was low for lesions classified as severely stenotic, and a proportionately greater number of severely stenotic lesions were found with CTA and MRA compared with DSA (DSA, n⫽7; CTA, n⫽15; and MRA, n⫽ 16). Most intracranial lesions were of moderate se-verity, with an equal distribution across modalities.
Interoperator reliability was high, with a Pearson correlation coefficient (r) of 0.951 for grading of le-sion severity with CTA. The 95% confidence interval (CI) for the Pearson correlation coefficient was 0.93– 0.96. The mean difference between the two readers was 0.01611 with a standard deviation of 0.09794 and 95% CI of⫺0.002 to 0.034.
The reader error rate for each lesion by each tech-nique as defined by consensus decision by both read-ers was relatively low across all imaging modalities (Table 2). Most reader errors across all imaging mo-dalities occurred when the stenoses were eccentric, and the optimal projection or viewing angle demon-strating the minimal diameter for stenotic segments was not initially recognized.
No procedural complications occurred for any technique. Average setup and image acquisition time and processing times for CTA were 12 and 22 min-utes, respectively. Similar times for 3D-TOF MRA were 7 and 7 minutes, respectively. For DSA, compa-rable times were 15 and 10 minutes, respectively. No complete technical failures occurred for any tech-nique, with five CTA, eight MRA, and two DSA studies showing some patient motion or other arti-facts, which precluded image analysis of one vessel in one patient.
Of the 115 diseased vessel segments evaluated, we found seven vessel segments (in seven patients) that demonstrated intermodality discrepancies in lesion classification as occlusion or stenosis. In one of these patients, CTA was normal, but DSA demonstrated segmental occlusion. In this patient, spontaneous lysis of the thrombus probably occurred in the 72 hours between the time DSA and CTA were performed, because image quality was excellent in both studies and no technical issues were identified. Also, the patient improved clinically between the two studies.
Of the remaining six patients, six suspected refer-ence standard (DSA) errors were identified. Errors were defined as errors in the depiction of true vascu-lar anatomy made by DSA following consensus re-evaluation of all the data. These intermodality dis-crepancies were documented as DSA false-positive
findings (Table 3). A DSA false-positive finding was defined as DSA demonstrating occlusion of a vascular segment by consensus visual inspection, whereas CTA (and in two cases MRA) demonstrated a patent but stenotic lumen. All of the DSA false-positive findings occurred in the posterior circulation. Of the 115 le-sions identified with DSA, six vessel segments in six patients erroneously appeared occluded on DSA im-ages, indicating probable DSA false-positive results in six (21%) of 28 patients. The suspected DSA false-positive findings occurred in six (23%) of 26 of all visualized intracranial occlusions, in six (9%) of 67 posterior circulation lesions, and in six (5%) of 115 intracranial lesions identified with DSA.
We observed that the probable DSA false-positive findings occurred in very slow- and/or low-flow con-ditions present distal to a severe stenosis in a poste-rior circulation artery, causing the vessel to appear occluded at DSA, but stenotic at CTA (Figs 1–3). By using DSA as the reference standard, these DSA positive findings artificially elevated the false-negative fraction for CTA occlusion data, lowering the sensitivity (Table 4). Likewise, the DSA false-positive findings artificially elevated the false-false-positive fraction for the CTA stenosis data, lowering the pos-itive predictive value (Table 5).
In the comparative analysis chart for intracranial occlusions (Table 4), the first percentages represent our results using DSA as the reference standard. The percentages in parentheses are corrected for the probable DSA false-positive findings by consensus reading. The lowered sensitivity of CTA for intracra-nial occlusions when DSA is used as the reference standard becomes 100% when the proposed DSA interpretation error is removed. Of note, the positive predictive value remains low for MRA secondary to the high false-positive fraction of this technique.
[image:5.585.307.535.73.162.2]The comparative analysis chart for intracranial ste-nosis (Table 5) demonstrates the artificially lowered TABLE 2: Reader error rate determined by consensus evaluation per
imaging modality
Modality
No. (%) of Reader Errors (n⫽672)
DSA 25 (4)
CTA 7 (1)
[image:5.585.54.280.81.143.2]MRA 17 (3)
TABLE 3: Possible errors with the reference standard modality, DSA
Patient No.
Occlusion Location at DSA
Stenosis Location at CTA
Probable DSA Error
3 Vertebral Vertebral False-positive
4 Vertebral Vertebral False-positive
20 Basilar Basilar False-positive
22 Basilar Basilar False-positive
24 Basilar Basilar False-positive
28 Basilar Basilar False-positive
TABLE 4: Comparative analysis of CTA and MRA versus DSA for intracranial occlusion
Performance Measure CTA MRA
Sensitivity 71 (100) 81 (87)
Specificity 100 (100) 98 (98)
Positive predictive value 100 (100) 61 (59) Negative predictive value 99 (100) 99 (99.5)
[image:5.585.306.534.201.264.2]positive predictive value for CTA, which adjusts to 93% when the proposed DSA interpretation error is removed. Again, note the fixed low positive predictive value for MRA secondary to the high fixed false-positive fraction of this technique. Also, note the comparatively lower sensitivity of MRA than CTA for detection of stenotic lesions.
The raw numbers used to construct the compara-tive analysis charts are seen in Tables 6 –9. The Tables are corrected for reader error as well as DSA false-positive findings to reflect the true state of disease. CTA had a higher sensitivity than MRA for intracra-nial stenosis (98% versus 70%, P⬍.001) and
occlu-sion (100% versus 87%,P⫽.02). CTA had a higher positive predictive value than MRA for both stenosis (93% versus 65%, P ⬍ .001) and occlusion (100% versus 59%, P ⬍ .001), reflecting a comparatively lower false-positive rate for CTA. The negative pre-dictive value of both CTA and MRA was high for detection of both stenosis (100% versus 98%, P ⬍ .001) and occlusion (100% versus 99.5%,P⬍ .001).
Discussion
DSA provides excellent visualization of the intra-cranial vasculature and has been considered the ref-FIG 3. Example of a DSA false-positive finding for basilar occlusion in a patient with a relatively isolated posterior circulation due to bilateral vertebral artery occlusion, a hyp-oplastic right posterior communicating artery, and a significant left proximal P1 stenosis. A, Frontal late arterial phase DSA image shows selective injection of a dominant right vertebral artery. The basilar artery is not opacified. The right vertebral artery appears to terminate in the right posterior inferior cerebellar artery (arrow). Note that the patent right posterior inferior cerebellar artery supplies some blood flow to the right anterior inferior cerebellar artery and a small tonsillar loop branch to the contralateral left posterior inferior cerebellar artery.
B, Frontal middle phase DSA image shows selective injection of the left vertebral artery, which terminates in an extracranial muscular branch near the skull base (arrow). No flow is seen in the intracranial segment of the left vertebral artery indicating occlusion of this vessel segment.
C, Lateral projection, right ICA injection, middle arterial phase DSA image shows minimal retrograde filling of the distal basilar artery (arrow) through the posterior commu-nicating artery, but there is absence of flow in the remainder of the basilar artery, suggesting segmental occlusion of this vessel.
D, CTA was performed 1 day after DSA. This volume-rendered 3D CTA image in posteroanterior projection (anatomic orientation) shows bilateral distal vertebral artery occlusions (solid black arrows) and significant focal origin stenoses of both the left proximal P1 and the left superior cerebellar artery (white arrow). CTA image also demonstrates minimal flow in what appears to be a small segment of a hypoplastic distal right intracranial vertebral artery, distal to the origin of the right posterior inferior cerebellar artery. The CTA image shows that the basilar artery is entirely patent and stenosis-free (open black arrow). This was verified on the gray-scale 2D source image. E, Volume-rendered 3D CTA image, craniocaudal projection with anatomic orientation, demonstrates a prominent left posterior communicating artery (arrow) and absent right posterior communicating artery. The left P1 is small in caliber.
F, Targeted volume-rendered 3D CTA image in the anteroposterior projection demonstrates significant proximal focal left P1 and superior cerebellar artery stenoses (arrow).
erence standard for evaluation of intracranial stenosis and occlusion. This is due to the high spatial resolu-tion that this technique generates with a very small pixel size. Dynamic flow information of the cerebro-vascular arterial tree is provided with each injection. However, given the risks, costs, and limited availabil-ity of conventional angiography, the need for nonin-vasive techniques is growing.
TOF MRA is a widely available noninvasive tech-nique that requires no radiation exposure and no administration of contrast material. Limitations of TOF MRA include a lower spatial resolution, as com-pared with DSA and CTA, that may diminish the ability to depict severe stenosis in small vessels and a dependence of vascular flow signal intensity on the maintenance of proton spin coherence. Stenotic le-sions are sites where proton spin dephasing, and con-sequently flow signal intensity loss, commonly occur. This is due to complex, slow or in-phase flow, all flow characteristics commonly seen in stenotic intracranial vessels (8). In addition, the TOF technique requires comparatively long imaging times, frequently leading to patient motion artifacts and degradation of image quality. Although the literature demonstrates sensi-tivities in the range of 80% for accurately categorizing
stenotic or occlusive lesions with MRA (8, 9), these limitations create ambiguity. We occasionally found it very difficult to determine whether we were seeing flow artifact, true stenosis, or even occlusion in a vessel. If flow signal intensity decreases caused by disturbed flow dynamics are sufficient to create a flow gap on a TOF image, this may necessitate performing additional, possibly more invasive techniques such as DSA. Despite these limitations, TOF MRA with MIP requires minimal user interaction to acquire and pro-cess, and it uses a facile display mode. Our MRA results demonstrated a 70% sensitivity for detection of intracranial stenosis and an 81% sensitivity for detection of intracranial occlusion when compared with the reference standard of DSA, values compara-ble to those reported in the literature (8, 9). Our positive predictive value for the quantitation of intra-cranial stenosis by using TOF MRA (65%) was equal to that recently reported in the Stroke Outcomes and Neuroimaging of Intracranial Atherosclerosis study, which found a positive predictive value of 64% (10). Our current MRA postprocessing does not use tar-geted MIPs. Possibly our MRA results could have been improved through the use of such techniques. However, we did not experience instances where overlapping vessels precluded lesion detection or quantitation.
Helical CTA is a noninvasive technique that pro-vides good visualization of the intracranial vascula-ture (11). Our routine CTA protocol requires 60 seconds or less to perform and has higher spatial resolution relative to that of MRA, but lower than that of DSA. Limitations of CTA include radiation exposure as well as time and skill involved in image postprocessing. Other potential limitations to CTA include interpolation errors, contrast material entry phenomenon, possible venous contamination in a re-TABLE 5: Comparative analysis of CTA and MRA versus DSA for
intracranial stenosis
Performance Measure CTA MRA
Sensitivity 98 (98) 70 (70)
Specificity 98 (99) 99 (97)
Positive predictive value 78 (93) 63 (65)
Negative predictive value 100 (100) 98 (98)
[image:7.585.308.533.80.149.2]Note.—Data are percentages using DSA as the reference standard; numbers in parentheses are percentages corrected for DSA false-pos-itive stenosis by consensus reading. See Tables 7 and 9 for raw data.
TABLE 6: Intracranial occlusions at CTA versus DSA excluding DSA false-positive findings
CTA Occlusion
DSA Occlusion
Total
Yes No
Yes 20 0 20
No 0 634 634
Total 20 634 654
[image:7.585.54.283.81.143.2]Note.—Data are number of vessel segments and relate to the CTA performance measures in parentheses in Table 4.
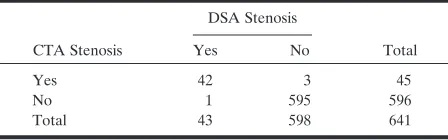
TABLE 7: Intracranial stenosis at CTA vs DSA excluding DSA false-positive findings
CTA Stenosis
DSA Stenosis
Total
Yes No
Yes 42 3 45
No 1 595 596
Total 43 598 641
[image:7.585.55.283.220.289.2]Note.—Data are number of vessel segments and relate to the CTA performance measures in parentheses in Table 5.
TABLE 8: Intracranial occlusions at MRA versus DSA excluding DSA false-positive findings
MRA Occlusion
DSA Occlusion
Total
Yes No
Yes 20 14 34
No 3 634 637
Total 23 648 671
Note.—Data are number of vessel segments and relate to the MRA performance measures in parentheses in Table 4.
TABLE 9: Intracranial stenosis at MRA versus DSA excluding DSA false-positive findings
MRA Stenosis
DSA Stenosis
Total
Yes No
Yes 30 16 46
No 13 595 608
Total 43 611 654
[image:7.585.306.534.220.288.2] [image:7.585.56.280.353.423.2]gion of interest, and the need for optimized contrast gradient-injection timing. Because CTA is essentially a vessel cast technique, it also provides no significant flow hemodynamic information.
We have not found venous contamination to be a significant problem when evaluating data sets. The veins are normally opacified in CTA studies per-formed on single detector helical scanners, since scan-ning time is approximately 30 – 60 seconds. Even if a vein overlaps an artery of interest in one or more planes, the arterial segment is usually accurately iden-tified by its smooth contour, higher HU attenuation, and characteristic spatial location.
Skutta et al (12) suggested that CTA may be supe-rior to MRA in depicting poststenotic or postocclu-sive arterial segments of low flow or turbulence. Our data agrees with this finding and further emphasizes the limitations of routine TOF MRA. Gadolinium-enhanced MRA of the intracranial vasculature, not currently widely available because of technical issues, may alleviate some of the limitations of TOF MRA by decreased dependence of flow signal intensity on TOF entry phenomenon and decreased T1 short-ening effects of fat and calcium, but spatial resolution issues remain.
A recent study compared the combined results of both CTA and MRA with those of the current refer-ence standard, DSA, for evaluation of intracranial stenosis (13). In that study, the CTA images were not blindly assessed for lesion presence, as the CTA le-sion location was determined according to the sus-pected location of stenosis on the previously read MRA images. Those authors found that the com-bined accuracy of MRA and CTA is equal to that of DSA in most cases. Results of another study indicate that CTA had difficulty in enabling identification of stenotic lesions in the vertebral artery, but otherwise suggest that CTA is a reliable method for detection of lesions in the posterior fossa and may replace DSA in many cases (14).
After initial blinded image analysis, the DSA, CTA, and MRA images in our study were reviewed in a side-by-side fashion by both readers to obtain consen-sus in cases of intermodality discordant readings. This approach enabled us to identify an imaging technique error independent of “reader error.” We encountered six instances in which DSA falsely demonstrated ar-terial occlusion in the posterior circulation, indicating a 23% rate of DSA false-positive findings for arterial occlusion, occurring in 21% of our patient popula-tion. MRA also had false-positive findings for occlu-sion in four of the six cases. Examination of the angiographic runs from these patients revealed that all of the DSA false-positive instances occurred in low- or balanced flow states in the setting of a severe stenosis in the posterior circulation (Figs 1 and 2) or in the setting of a relatively isolated posterior circulation (Fig 3). Four of the DSA false-positive findings occurred in the basilar artery and two in the vertebral artery.
We hypothesize the reason the vessel distal to the stenosis appeared occluded on DSA images, when
CTA clearly showed the vessel to be patent, is related to differences in image acquisition time for DSA and CTA modalities. Angiographic runs are obtained dur-ing the course of a sdur-ingle intracranial circulation cy-cle, typically 5–7 seconds on average, by using a 3– 4 frame per second filming rate, whereas CTA studies are acquired over approximately 60 seconds by using a single detector and 30 seconds by using a four detector helical scanner, allowing the contrast mate-rial to circulate up to 4 –12 times in the intracranial vessels before imaging, which permits flow of a larger volume of contrast material through a tight stenosis. This greater volume of contrast material distal to a tight stenosis coupled with the HU-based methods of transmission tomography, may help to make these vessel segments more conspicuous, thus rendering visibly stenotic, but patent, arterial segments on CTA images that appear occluded on DSA images. This comparative advantage of CTA may be lost with the newer generation, faster multi-detector row scanners, where routine protocol total scanning times may ap-proach conventional angiographic exposure times. Therefore, for instances in which a vertebrobasilar occlusion is suspected, we recommend a lower rate of table translation per unit time and/or delayed im-aging when patients are scanned with multi-detector row systems.
The ability to correctly identify a patent vessel has important clinical and therapeutic implications. If a vessel is truly occluded, it may not be necessary to initiate aggressive antithrombotic therapy, and the probability of successful endovascular therapeutic in-tervention is lower. However, if the vessel is in fact tightly stenotic but patent, a significant risk of throm-boembolic stroke may exist, thus justifying aggressive antithrombotic therapy. In addition, endovascular in-tervention, such as angioplasty or stent placement, and neurosurgical options, such as arterial bypass procedures, can be considered.
This study has several limitations and will benefit from confirmation with studies using larger samples. One limitation of our study is that our time limit for obtaining all three studies was 30 days. It is possible that a patient’s vessel may have been occluded at the time of DSA, but only stenosed at the time CTA was performed. The mean, median, and mode time dif-ference of our three imaging modalities was 1 day, but inclusion criteria permitted inclusion of patients with studies separated by a period of up to 1 month. The mean time difference in imaging studies for the six patients in which DSA false-positive findings oc-curred was 72 hours, and no changes in neurologic status were observed during the intervening time pe-riod in any of these patients to suggest a major change in circulation patterns had occurred. A systematic bias could have been introduced if one technique routinely preceded the other. However, we evaluated our data and did not find such a pattern.
means that the frequency of DSA false-positive find-ings in this study population cannot be generalized to all patients with symptomatic intracranial stenosis, since the criteria for ordering the imaging studies were not known for each case. The use of consensus readings in this study further introduces a possible reader bias. Another potential limitation was possible introduction of a systematic error through the use of MIP images for quantitation when MRA was being evaluated, but source oblique MPR images for CTA quantitation. This approach was taken because the source images for the MRA data sets were thought to provide vessel boundaries that were not easily mea-sured, leading to decreased confidence in vessel boundary determinations, and therefore lower cer-tainty in stenosis determinations. Finally, both CTA and MRA are techniques in evolution, and further protocol refinements could significantly alter study results. It is possible that interpretation of the CTA data by using volume-rendering techniques intro-duced a systematic error due to inherent technical advantages or limitations of volume rendering over MIP techniques used with MRA. We found volume rendering of the MRA data was not a feasible ap-proach owing to the lower spatial resolution and anisotropic nature of routine clinical TOF MRA sequences.
Previous articles have reported that CTA is limited in its ability to evaluate the petrous ICA (12), cavern-ous ICA (13), and vertebral artery (14). We did not encounter this problem in any of our patients. We suggest that prior difficulty may be eliminated by close attention to data acquisition and processing. This requires ensuring optimal contrast material opacification within the vessels through monitored timing injections or automated bolus detection soft-ware. It is our opinion that this results in better data sets than when no timing run is used, as others have reported significant variations in peak contrast mate-rial opacification across individuals (15). Other rec-ommendations for increasing conspicuity of the ves-sels are a fast injection rate (3– 4 mL/s), high contrast material concentration (350 –370 mmol), and a small FOV to decrease voxel size and increase spatial res-olution. Finally, all intraosseus vessel segment steno-ses and occlusions must be detected by using multi-planar or curved multimulti-planar 2D gray-scale images, by using appropriate window and level settings, rather than the 3D images, since the latter may not be able to discriminate between pixels belonging to bone and those belonging to arteries, due to the overlapping HU attenuation profiles of both structures.
The choice of postprocessing software and the manner in which postprocessing is performed is crit-ically important for accurate CTA interpretation. This is likely the most important factor accounting for the variable success of vessel characterization in the CTA literature. We favor using perspective volume rendering to view 3D data because this technique makes available for interrogation all the voxels within a volume, while avoiding potential arbitrary vessel border definition and extensive loss of information, a
limitation inherent to shaded surface display and MIP techniques (16, 17). Volume rendering is now the preferred rendering technique for CTA (18). Others have also found that perspective volume rendering is superior to MIP (19) and shaded surface display for evaluating vessels (20). Perspective volume rendering is the only postprocessing technique that allows visu-alization of both nonluminal and luminal vascular information, including a clear distinction between soft and calcific plaque versus contrast-opacified vessel. Detection of noncalcified plaque is important be-cause studies have shown that aggressively treated soft plaque may regress under maximal medical man-agement (21). We have found that 2D source MPR images or curved oblique MPR images are most op-timal for evaluating vessels surrounded by bone and the 3D volumetric windows are most optimal for evaluating vessels surrounded by brain. The reader can dynamically interact with the data set and freely adjust window and level settings to maximize vessel conspicuity in vessels bordered by bone structures, such as the petrocavernous segments of the ICA.
The learning curve required to postprocess CTA data is a limitation of the technique. If the window and level settings are not correct, a stenosis can be overestimated or underestimated (blooming effect). Failure to optimally adjust window and level settings may also result in inability to visualize calcific and soft plaque or contrast-opacified lumen and bone (despite the quite different HU). The correct window and level settings are defined as the settings that will optimize conspicuity of the vessel without resulting in significant blooming or margin obscuration by adja-cent bone or soft tissues. For this study, 3D image review was conducted with values set at a window of approximately 250 HU and level of 150 HU, whereas for the 2D image data the window and level settings were approximately 1000 and 500 HU, respectively.
Our goal is that this analysis may help clarify the relative value of each technique in the evaluation of patients with intracranial steno-occlusive disease. In our study, each of the six patients in whom CTA demonstrated a posterior circulation artery to be patent and not occluded, as suggested by DSA, received aggressive medical therapy with Couma-din and/or Lovenox. In addition, one patient un-derwent stent placement. This indicates that the CTA results had a significant effect on patient clinical management.
We suggest CTA be considered as the primary study in the setting of suspected posterior circulation occlusion. If CTA demonstrates that the artery is patent, then DSA can be considered for evaluation of flow hemodynamics and possible intervention.
Conclusion
evaluation of stenotic and occluded intracranial vessel segments. CTA has a high interoperator reliability for quantitation of stenotic lesions when expert readers are used. Helical CTA is superior to DSA in the demonstration of arterial patency in posterior circu-lation arteries when very low- or balanced-flow states are present due to a severe stenosis. CTA results had a significant effect on patient clinical management.
References
1. Sacco RL, Kargman DE, Gu Q, Zamanillo MC.Race-ethnicity and determinants of intracranial atherosclerotic cerebral infarction: the Northern Manhattan Stroke Study.Stroke1995;26:14 –20 2. Lutsep HL, Clark WM.Association of intracranial stenosis with
cortical symptoms or signs.Neurology2000;55:716 –718
3. Clark WM, Barnwell SL, Nesbit G, et al.Safety and efficacy of percutaneous transluminal angioplasty for intrancial atheroscle-rotic stenosis.Stroke1195;26:1200 –1204
4. Gomez CR, Misra VK, Liu MW, et al.Elective stenting of syp-tomatic basilar artery stenosis.Stroke2000;31:95–99
5. Cloft HJ, Joseph GJ, Dion JE.Risk of cerebral angiography in patients with subarachnoid hemorrhage, cerebral aneurysm, and arteriovenous malformation.Stroke1999;30:317–320
6. Wollschlaeger G, Wollschlaeger PB, Lucas FV, Lopez VF. Expe-rience and result with postmortem cerebral angiography per-formed as routine procedure of the autospy.AJR Am J Roentgenol 1967;101:68 – 87
7. Bennett B.On comparisons of sensitivity, specificity and predictive value of a number of diagnostic procedures. Biometrics 1972;28:793– 800
8. Furst G, Hofer M, Sitzer M, et al.Factors influencing flow induced signal loss in MR angiography: an in vitro study.J Comput Assist Tomogr1995;19:692– 699
9. Korogi Y, Takahashi M, Nakagawa T, et al.Intracranial vascular stenosis and occlusion: MR angiographic findings.AJNR Am J Neuroradiol1997;18:135–143
10. Feldmann E, Wilterdink J, Sarafin J, Cloft HJ, Rogg J, Nichols F. Stroke outcomes and neuroimaging of intracranial atherosclerosis (SONIA) (abstr).Presented at the 29th International Stroke Con-ference, San Diego, February 5–7, 2004
11. Katz DA, Marks MP, Napel SA, et al.Circle of Willis: evaluation with spiral CT angiography, MR angiography, and conventional angiography.Radiology1995;195:445– 449
12. Skutta B, Furst G, Eilers J, Ferbert A, Kuhn F.Intracranial stenooc-clusive disease: double-detector helical CT angiography versus digital subtraction angiography.AJNR Am J Neuroradiol1999;20:791–799 13. Hirai T, Korogi Y, Ono K, et al.Prospective evaluation for
sus-pected stenoocclusive disease of the intracranial artery: combined MR angiography and CT angiography compared with digital sub-traction angiography.AJNR Am J Neuroradiol2002;23:93–101 14. Graf J, Skutta B, Kuhn F, Ferbert A. Computed tomographic
angiography findings in 103 patients following vascular events in the posterior circulation: potential and clinical relevance.J Neu-rology2000;247:760 –766
15. Villablanca JP, Jahan R, Hooshi P, et al.Detection and characteriza-tion of very small cerebral aneurysms by using 2D and 3D helical CT angiography.AJNR Am J Neuroradiol2002;23:1187–1198
16. Kuszyk BS, Heath DG, Ney DR, et al.CT angiography with volume rendering: imaging findings.AJR Am J Roentgenol1995;165:445– 448 17. Johnson PT, Heath DG, Kuszyk BS, Fishman EK.CT angiography with volume rendering: imaging findings.Radiology1996;200:564 –568 18. Kuszyk BS, Heath DG, Johnson PT, Fishman EK.CT angiography with volume rendering: in vitro optimization and evaluation of accu-racy in quantifying stenosis.AJR Am J Roentgenol1999;173:449 – 457 19. Mallouhi AFS, Chemelli A, Dessl A, et al.Detection and charac-terization of intracranial aneurysms with MR angiography: com-parison of volume-rendering and maximum-intensity projection algorithms.AJR Am J Roentgenol2003;180:55– 64
20. Kobayashi Y, Nakazawa J, Sakata M.Comparison of the depiction of pancreaticoduodenal arcades and dorsal pancreatic artery, us-ing three-point scale with volume renderus-ing (VR), maximum inten-sity projection (MIP), and shaded surface display (SSD) (in Jap-anese).Nippon Hoshasen Gijutsu Gakkai Zasshi2002;58:297–300 21. Russell JC.Reduction and prevention of the cardiovascular