RESEARCH ARTICLE
Sticklebacks adapted to divergent osmotic environments show
differences in plasticity for kidney morphology and candidate gene
expression
M. Mehedi Hasan1,2,*, Jacquelin DeFaveri2,*, Satu Kuure3, Surjya N. Dash4, Sanna Lehtonen4, Juha Merilä2and R. J. Scott McCairns2,5,‡
ABSTRACT
Novel physiological challenges in different environments can promote the evolution of divergent phenotypes, either through plastic or genetic changes. Environmental salinity serves as a key barrier to the distribution of nearly all aquatic organisms, and species diversification is likely to be enabled by adaptation to alternative osmotic environments. The threespine stickleback (Gasterosteus aculeatus) is a euryhaline species with populations found both in marine and freshwater environments. It has evolved both highly plastic and locally adapted phenotypes due to salinity-derived selection, but the physiological and genetic basis of adaptation to salinity is not fully understood. We integrated comparative cellular morphology of the kidney, a key organ for osmoregulation, and candidate gene expression to explore the underpinnings of evolved variation in osmotic plasticity within two populations of sticklebacks from distinct salinity zones in the Baltic Sea: the high salinity Kattegat, representative of the ancestral marine habitat; and the low salinity Bay of Bothnia. A common-garden experiment revealed that kidney morphology in the ancestral high-salinity population had a highly plastic response to salinity conditions whereas this plastic response was reduced in the low-salinity population. Candidate gene expression in kidney tissue revealed a similar pattern of population-specific differences, with a higher degree of plasticity in the native high-salinity population. Together these results suggest that renal cellular morphology has become canalized to low salinity, and that these structural differences may have functional implications for osmoregulation.
KEY WORDS: Osmoregulation, Local adaptation, Adaptive plasticity, Kidney morphology
INTRODUCTION
Widely distributed species frequently face differing and localized environmental challenges. Plasticity in physiological function may help to facilitate acclimatization to and/or colonization of novel environments whereas inter-individual variability and associated
bioenergetic costs and trade-offs may ultimately lead to adaptive evolution (Watt, 1985; Schulte, 2001; Dalziel et al., 2009). However, complete understanding of divergent evolutionary trajectories in response to the dominant abiotic factors experienced by such cosmopolitan species remains a central challenge in biology, requiring integration of analyses at all levels, from molecules within cells to whole-organism performance in relation to the broad range of conditions comprising a species’ physiological niche (Pough, 1989). For aquatic organisms, the maintenance of plasma ion concentrations represents a unique set of physiological challenges. For example, freshwater species inhabit a hypotonic environment where they tend to gain water and lose salts via exposed membranes. In contrast, marine species live in a hypertonic environment in which salts are gained and water lost to the external environment. Osmoregulation under both conditions is energetically costly and necessitates active ion transport against a concentration gradient employing a variety of molecular pumps and channels (Perry and Fryer, 1997). In fishes, these physiological mechanisms are coordinated between gills, intestines and kidneys (Eddy and Handy, 2012). Specifically, ionic balance is maintained in seawater through a combination of branchial and renal excretion of salts, and oral ingestion and intestinal uptake of water (Evans, 2008). The opposite occurs in hypotonic environments such as weakly brackish or freshwater: salts are reabsorbed across the gills and intestines whereas excess water is filtered by the highly vascularized kidney (Hickman and Trump, 1969; Perry and Fryer, 1997; Hentschel et al., 2000). These specific mechanisms have been studied in great detail in the gill (Evans et al., 1999, 2005; Hwang et al., 2011) and intestine (Lahlou, 1983; Grosell, 2006) of marine and freshwater fishes, and have revealed various degrees of plasticity in response to salinity transfer. However, the extent of associated cellular remodeling and/or transcriptional changes in the kidney has received less attention (but see Perry et al., 2003; Wang et al., 2014), especially in euryhaline species that can tolerate a wide range of salinities.
The main functions of the kidney include filtering wastes, absorbing nutrients and water, and maintaining body fluid concentrations (Eaton, 2012). These are achieved by the nephron, the functional unit of the kidney, which is composed of several structural subunits. Chief among these are the blood-filtering glomeruli, which mark the beginning/head of nephrons, and the connected tubules, which ultimately discharge urea and water via the collecting duct. The tubular epithelium can be further distinguished into distinct proximal and distal segments, which in turn have unique roles in modifying the salt and water composition of urine via specific solute transport activities (Hickman and Trump, 1969; Reimschuessel, 2001). These kidney structures are also known to vary both within and among species, depending on their
Received 11 July 2016; Accepted 27 March 2017
1Fisheries and Marine Resource Technology Discipline, Khulna University, Khulna 9208, Bangladesh.2Ecological Genetics Research Unit, Department of Biosciences, University of Helsinki, Helsinki 00014, Finland.3Institute of Biotechnology & Laboratory Animal Centre, University of Helsinki, Helsinki 00014, Finland. 4Department of Pathology, University of Helsinki, Helsinki 00014, Finland.5ESE, Ecology and Ecosystem Health, INRA, Agrocampus Ouest, Rennes 35042, France. *These authors contributed equally to this work
‡Author for correspondence ([email protected])
R.J.S.M., 0000-0002-0392-7413
Journal
of
Experimental
local habitats (Hickman and Trump, 1969). For example, nephrons of freshwater fish typically have large, well vascularized glomeruli and tubules to retain salts and produce dilute urine for elimination of excess water (Hickman and Trump, 1969). In contrast, marine fishes lose water to the external environment; therefore, they tend to have poorly developed glomeruli and lower glomerular filtration rates to maximize water retention (Reimschuessel, 2001). In some cases, certain marine and estuarine species are entirely devoid of glomeruli and/or distal tubules (Hickman and Trump, 1969; Reimschuessel, 2001). In general, cellular form may influence not only immediate renal function, but ultimately the type of environment to which an animal may acclimatize. Hence, studying aspects of renal function in these divergent anatomical structures can provide insights to their potential role in local adaptation.
The threespine stickleback (Gasterosteus aculeatus Linnaeus 1758) has emerged as a premier model in the study of adaptive evolution (Bell and Foster, 1994; Gibson, 2005; Jones et al., 2012). A marine species in origin, the ancestral phenotype has been highly conserved since the Miocene Epoch; however, repeated colonization of freshwater throughout the species’ global distribution has resulted in pronounced evolutionary changes. Given the species’capacity to acclimatize and adapt to a wide range of salinities–its distribution extends throughout coastal marine and lowland freshwaters of the boreal and temperate northern hemisphere (Bell and Foster, 1994) – it is an ideal model for studies of kidney structure and function. Whilst the kidney has been the target of many physiological studies aimed at understanding the mechanisms of ion transport in various species of marine and freshwater fishes (Yancheva et al., 2016), it has received considerably less attention in sticklebacks. Earlier comparative studies revealed that the renal structures of freshwater sticklebacks are better developed than those from the marine environment (Ogawa, 1968; Wendelaar Bonga, 1973). Likewise, upon freshwater transfer, the kidneys of anadromous sticklebacks undergo structural modifications, acquiring characteristics of freshwater fish, suggesting a high degree of renal plasticity in marine/anadromous sticklebacks (Hickman and Trump, 1969; Wendelaar Bonga, 1973). Interestingly, no studies to date have explored whether this morphological plasticity is maintained in sticklebacks adapted to freshwater or weakly brackish environments. Moreover, whereas studies at the functional level have described transcriptional responses to salinity in both marine/anadromous and freshwater sticklebacks (McCairns and Bernatchez, 2010; Judd, 2012; Taugbøl et al., 2014; Divino et al., 2016), most have focused on gill rather
than kidney tissue. Although a recent transcriptome-wide assay of salinity-induced changes in stickleback kidneys has provided a fresh insight into this important model system (Wang et al., 2014), its use of wild-caught test fish limits the ability to unambiguously discern genetically based divergence in expression from confounding environmental factors.
Locally adapted populations of sticklebacks in the Baltic Sea represent an ideal system to differentiate genetic from environmental sources of variation in kidney morphology and function. The Baltic Sea is characterized by a pronounced east–west and north–south salinity gradient (Fig. S1), with its northern arm, the Gulf of Bothnia, being almost freshwater (Olenin and Leppäkoski, 1999), and the Danish Straits being nearly marine (20 ppt). The threespine stickleback is one of the most abundant fishes of the Baltic Sea, and fine-scale population structuring in this area appears to be associated with existing salinity gradients (DeFaveri et al., 2013; Guo et al., 2015). In the face of such environmental variation, it is expected that populations from different environments would have a wide variation in kidney morphology, ranging from highly developed kidney structures in populations residing in areas of low salinity to poorly developed kidneys in those native to high salinity (Reimschuessel, 2001). Fitness-based tests of whole-organism response to reciprocal salinities have established that populations are indeed adapted to local conditions (DeFaveri and Merilä, 2014); likewise, marker-based tests of selection in candidate genes associated with osmoregulation have also been suggestive of adaptive divergence to the different salinity regimes across the Baltic Sea (Shimada et al., 2011; DeFaveri et al., 2013). For example, divergence at theNHE3
locus, a solute carrier that has an important role in osmoregulatory processes (Evans, 2008), was found to be three times higher than in neutral markers when comparing populations from the Danish Straits and the Bay of Bothnia (FST=0.033 versus 0.011; data from DeFaveri et al., 2013). Similar divergence was also seen in loci associated with ion transport (ATP1A1; FST=0.055) and water channel proteins (AQP3A;FST=0.032). Whether genetic divergence in candidate genes is also accompanied by differentiation in their expression remains a question in need of further study. It is, however, expected that divergent populations will have evolved differential expression in many osmoregulatory candidate genes (McCairns and Bernatchez, 2010; Whitehead et al., 2013). For example, ion transporters and co-transporters such asATP1A1and
NKCCare expected to show increased expression in high-salinity conditions whereas Na+/H+exchangers and water channel proteins likeNHE3BandAQP3Aare expected to have higher transcriptional levels in low salinity. Yet, given the euryhaline nature of the species, such changes might also be reflected in their inherent physiological plasticity (McCairns and Bernatchez, 2010; Whitehead et al., 2013). Nevertheless, limits to plasticity are almost certainly imposed by energetic costs and trade-offs (Van Tienderen, 1997; DeWitt et al., 1998; Van Kleunen and Fischer, 2005), which may differ among populations of a given species (DeWitt et al., 1998). Thus, stickleback populations from divergent osmotic conditions may also serve as ideal models to determine the relative role of plasticity during the process of adaptation, and whether this plasticity differs between populations that are adapted to different salinities.
In this study, we compared the difference in renal morphology and inferred renal function between two stickleback populations adapted to different salinity conditions in the Baltic Sea area (viz. high salinity Danish Strait, 20 ppt; low salinity Bay of Bothnia, 5 ppt). After rearing multiple families from each population under native and reciprocal salinity conditions, we quantified gross-scale List of abbreviations
ACTG1 actinγ1
AQP3A aquaporin 3a
ATP1A1A.4 Na+/K+-transporting ATPase,α1a polypeptide, tandem duplicate 4 (i.e.ATP1A1)
CD2AP CD2-associated protein
KIRREL3L kin of IRRE-like 3-like (i.e.NEPH3)
SLC9A3.2 solute carrier family 9 (sodium/hydrogen exchanger), member 3, tandem duplicate 2 (i.e.NHE3B)
SLC12A1 solute carrier family 12, member 1 (i.e.NKCC2) DIC deviance information criterion
G×E genotype-by-environment interaction KAS(L) Kaskinen–low-salinity population MAR(H) Mariager Fjord–high-salinity population PDI posterior density interval
ppt parts per thousand (‰)
VG genetic variance (broad-sense)
Journal
of
Experimental
kidney cell morphology and mRNA abundance in candidate osmoregulatory genes in order to document plastic (i.e. purely environmentally mediated) responses to salinity in contrast to genetically based divergence (including genetic differences in plasticity, i.e. genotype-by-environment interactions) that have evolved between these populations. Three candidate genes were selected based on their known osmoregulatory function as important ion-transporting and water channel proteins (ATP1A1,
AQP3AandNHE3B), which have been shown to play integral roles in maintaining osmotic and ionic balance across key osmoregulatory organs, including the kidney (Cutler and Cramb, 2001; Perry et al., 2003; Finn and Cerdà, 2011). Additionally, previous work cataloging divergence among ecologically diverse stickleback populations in the Baltic Sea identified these genes as putatively selected outliers based on their genomic divergence between freshwater and marine populations within the study region (DeFaveri et al., 2011, 2013; Shimada et al., 2011). Three additional candidate genes (NKCC2,CD2APandNEPH3) were selected based on their known functional role in glomerular filtration (Shih et al., 1999; Lehtonen et al., 2000; Hentschel et al., 2007), and whose differential expression in relation to salinity has been demonstrated in glomerular podocytes and tubules of various fish species (Cutler and Cramb, 2001; Nishimura et al., 2004).
MATERIALS AND METHODS
Fish sampling, breeding and maintenance
Adult sticklebacks were sampled during the breeding season (May– June) of 2011 from two demes inhabiting different salinity conditions in the Baltic Sea: Mariager Fjord, Denmark (MAR; 56°38′58″N, 09°57′05″E, see also Fig. S1), a region of high salinity (20 ppt mean annual salinity; range 17–24 ppt); and the Gulf of Bothnia, near the municipality of Kaskinen, Finland (KAS; 62°23′ 02″N, 21°13′30″E, see also Fig. S1), a region of low salinity (3– 5 ppt mean annual salinity). In the text, population codes are followed by (H) and (L) – denoting high and low salinity, respectively – to highlight the environmental status of each. While neutral genetic divergence among these two populations is roughly one per cent, divergence in candidate gene-based markers with putative osmoregulatory roles is five times higher (data from DeFaveri et al., 2013). Differential responses to salinity treatment have also been documented in these specific populations, notably a reduction in fitness (i.e. larval survival, juvenile growth) in fish native to the low-salinity region (KAS) reared at high salinity (DeFaveri and Merilä, 2014). Ten ‘purebred’ F1 families were established within in each population; see DeFaveri and Merilä (2014) for details on crossing and rearing. Briefly, each family was divided and individuals from each family were reared in either of two salinity treatments (i.e. 5 and 20 ppt), chosen to reflect the local salinities at each of the two sampling sites to which source populations are adapted. Fish were maintained in this full factorial design for one year, at which time eight families were randomly selected per treatment. Although sticklebacks can come into reproductive condition at this age, we were careful to select individuals that were not showing any visible signs of sexual maturity (i.e. no nuptial coloration or gravidity) and no discernible gonads during dissections (i.e. most probably immature males). This is particularly important because the kidneys of males undergo major structural and functional changes during breeding (De Ruiter and Wendelaar Bonga, 1985); however, this is unlikely to affect the current results as only immature fish were used. In total, five individuals per family were sampled for gene expression analysis (N=160). Due to logistic constraints only three families per
treatment were used for morphological analysis, from which two individuals per family and treatment were sampled (N=24). Immediately after euthanization by decapitation, the kidney was quickly dissected from the body and preserved either in 10% formalin (if used for kidney tissue morphology analysis) or flash-frozen in liquid nitrogen and stored at −80°C (if used in gene expression analysis). Wild fish were collected in accordance with national fishery regulations, and experiments were conducted under a license from the National Animal Experiment Board of Finland.
Gross-scale cellular morphology of kidneys
Following tissue fixation, kidneys were embedded in paraffin. Several 5 µm cross-sections were made with a microtome throughout the entire length of each kidney sample and stained (haematoxylin and eosin; Fischer et al., 2008) for visualization and characterization of the different cell types (namely glomeruli and tubules). Kidney sections were examined under a Nikon Eclipse 800 light microscope (Nikon Nordic, Vantaa, Finland), and a digital photograph of each was taken with a Spot Image digital camera at ×40 magnification (Olympus BX61, Olympus Finland, Espoo, Finland). Measurements were taken from digital photographs using IMAGEJ (Abràmoff et al., 2004). As we could not identify distal and proximal ends, nine cross-sections throughout the length of each kidney were chosen to capture within-kidney variation in structural components. From each section, five tubules were chosen randomly and measured for total tubule diameter, lumen diameter and cell height (Fig. S2). Due to the limited numbers of available glomeruli, only five from each sample were measured. In all cases, each structural element was measured eight times from differing starting points around the entire circumference of the structure–in this way we captured elements of both intra-structural variation and measurement area in subsequent analyses.
Candidate gene selection and primer design
As detailed in the Introduction, candidate genes were selected based on their osmoregulatory function as important ion-transporting and water channel proteins (ATP1A1,AQP3AandNHE3B), as well as their functional role in glomerular filtration (NKCC2,CD2APand
NEPH3). A summary of the putative osmoregulatory function of each candidate gene is presented in Table 1. Actin (ACTG1) was used as a reference gene for normalizing transcription because its expression in the kidney does not change in response to environmental salinity (Lu et al., 2011). Primers for each gene were designed based on their respective cDNA sequences reported in the stickleback genome (Ensembl Genome Browser, database version 78.1; accessed July 2014). For each gene, sequential exon pairs were exported to Primer3 software (Untergasser et al., 2012) to design unique primers that spanned the exon–exon boundary, to avoid amplification of any residual genomic DNA. Predicted primers were BLAST searched against the stickleback genome to ensure the uniqueness of the targeted transcript. Details of the primer sequences are given as supplementary material (Table S1).
RNA extraction, cDNA synthesis and quantification of candidate gene expression
Total RNA was extracted from kidney tissue using an RNeasy Mini Kit, following the manufacturer’s instructions (Qiagen, GmbH– Germany). Initial RNA concentration was determined by using a Qubit™ assay kit, according to the manufacturer’s instructions (Invitrogen, Carlsbad, CA, USA), and then standardized to equimolar concentration (84 ng µl−1) before cDNA synthesis. Twelve µl of total RNA from each sample was reverse transcribed
Journal
of
Experimental
to cDNA using the QuantiTect Reverse Transcription Kit, according to the manufacturer’s instructions (Qiagen, GmbH–Germany).
Candidate gene expression was inferred by relative quantification of mRNA, measured with quantitative PCR (qPCR) using a Bio-Rad PCR system. Each qPCR contained 2 µl of diluted (1:10) cDNA, 3 µl of primers (150 nmol l−1each) and 5 µl of PCR master mix (Bio-Rad, iQ™SYBER®Green Supermix), in a final reaction volume of 10 µl. PCRs were run on 384-well plates containing two cDNA samples from each individual, with one sample used for amplification of a given candidate gene, and the other used for the reference gene (ACTG1); a reference individual ( positive control) and a negative control (water+PCR reagents) were also included in all plates. In total, three technical replicates were run for each candidate gene on three separate plates.
Raw amplification data were used to calculate initial mRNA concentration (N0) for each PCR with the LinRegPCR software (Čikošet al., 2007). Following baseline correction, a window-of-linearity was used to perform regression analysis of the fluorescence data from the exponential phase. To capture experimental error and random variation among runs/plates, eachN0value for a candidate gene was normalized againstN0values of the reference gene in all plates corresponding to that given candidate gene’s reaction. For example, the technical replicate on plate 1 was normalized against the reference replicates on plates 1, 2 and 3, likewise for technical replicates 2 and 3. The final data set consisted of nine pseudo-replicate normalized values per individual.
Data analysis
All data analysis was performed in the R computing language (R Foundation for Statistical Computing; https://www.r-project.org). Both kidney cell measurements and gene expression data were analysed via general mixed-effects models employed in the
‘MCMCglmm’package (Hadfield, 2010). For both data sets (i.e.
kidney structure and mRNA expression), population of origin (here used as a proxy for locally adapted genotypes; G), rearing environment (E) and genotype-by-environment interaction (G×E) were assigned as fixed effects; however, random effects differed between data sets. For kidney data, random effects included variation among full-sibling families, variation among longitudinal sections, and repeated measures of each structure (herein termed measurement error,Vmeas). For mRNA data, random effects included variation among families, variation due to repeated measures and variation among PCR plates, nested within the suite of repeated measures of a given individual (Vplate)–for the latter, three pseudo-replicate values (calculated from each reference gene) were generated for each plate containing a given technical replicate. For kidney cell morphology data, models were run for 200,000 iterations, with a burn-in of 100,000 and a thinning interval of 100 to yield 1000 posterior estimates from each sampling chain; for gene expression data, these parameters were 2,000,000, 1,000,000 and 1000, respectively. In both cases, default priors were used, and model convergence was verified by visual inspection of trace, density and autocorrelation plots. Significance of fixed effects was profiled from the posterior distributions of model coefficients. For plotting, we estimated/predicted fixed-effects means conditioned on random effects.
For each trait, three models were tested: (i) a minimal/null model for which random effects only included technical variation (e.g. kidney section, PCR plate) and repeated measurement; (ii) a model including broad-sense genetic variation (i.e. including all sources of genetic variance, as opposed to a decomposed expression of only additive genetic variance) for trait expression, modeled as among-family variation in model intercepts; and (iii) maximal model, wherein random effects also included a family-specific environmental response (i.e. slope, βTreat|Fam) as a proxy for broad-sense genetic variation in plasticity. Model selection was based on the deviance information criterion (DIC).
RESULTS
Kidney cell morphology
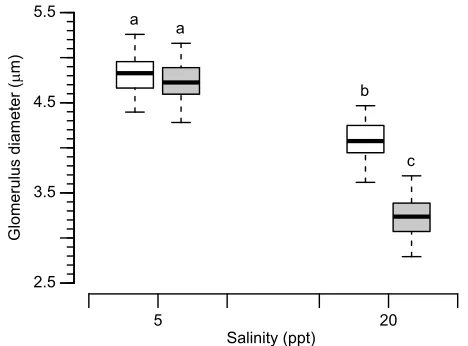
Nephron morphology responded in a population-specific manner to the effects of environmental salinity. In both populations, glomerulus diameter was significantly reduced in the high-salinity treatment (20 ppt; Fig. 1; Table 2 – representative histological images can be seen in Fig. S3). This effect was most pronounced in the native high-salinity population MAR(H), whose mean glomerulus diameter was reduced by 31.5% compared with a 15.6% reduction observed in the low-salinity population KAS(L). This led to a significant difference between populations in the high-salinity treatment, where mean glomerulus diameter was 20.6% smaller in MAR(H) compared with KAS(L) individuals (P=0.026; Table 2). In the low-salinity treatment (5 ppt), mean glomerulus diameter did not differ significantly between populations (P=0.706; Table 2).
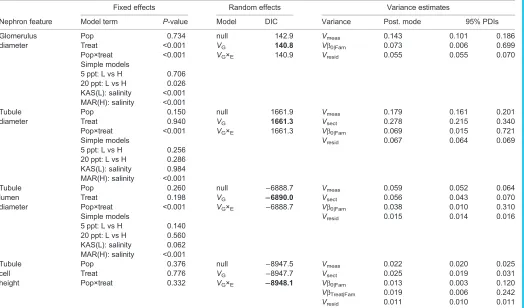
None of the tubule measurements differed between salinity treatments in the KAS(L) population (overall tubule diameter,
P=0.984; lumen diameter,P=0.062, Table 2). In contrast, MAR(H) individuals exhibited significantly smaller tubules (overall tubule diameter: 19.9%,P<0.001; lumen diameter: 28.6%,P<0.001) when reared at 20 ppt (Table 2; Fig. 2A,B; see Fig. S4 for representative sections). Mean tubule cell height did not differ between populations, nor was it affected by salinity (Table 2); however, variance appears to have increased for individuals reared at 20 ppt (Fig. 2C).
[image:4.612.48.302.71.334.2]Inclusion of family as a random effect produced modest improvements in model fit for all nephron measurements Table 1. Putative osmoregulatory function of candidate genes
Candidate
gene Putative osmoregulatory function
AQP3A Water channel protein involved in maintaining osmotic balance; expressed in kidney tubules (Cutler et al., 2007; Engelund and Madsen, 2011). Outlier between freshwater and marine stickleback populations (DeFaveri et al., 2011; Shimada et al., 2011).
ATP1A1 Active ion transport across plasma membranes; expressed in both gill and kidney tissues during osmoregulation (Perry et al., 2003; Wang et al., 2014). Outlier between freshwater and marine stickleback populations (DeFaveri et al., 2011; Shimada et al., 2011).
CD2AP Maintenance of filtration by glomerulus; expressed in both glomeruli and tubules (Lehtonen et al., 2000; Li et al., 2000; Hentschel et al., 2007).
NEPH3 Glomerulus development and filtration; expressed in glomerulus and tubules (Wang et al., 2012; Ristola and Lehtonen, 2014).
NHE3B Na+ion regulation in low salinity; expressed in gills and in mammalian kidneys–renal osmoregulation in teleosts hypothesized (Cutler and Cramb, 2001; Yan et al., 2007; Chang et al., 2013). Outlier between freshwater and marine stickleback populations (Shimada et al., 2011; DeFaveri et al., 2013).
NKCC2 Freshwater osmoregulation–dilution of urine to conserve ions; expressed in kidney tubules (Kato et al., 2011; Wang et al., 2014).
Note that for sake of brevity, other putative functions beyond maintenance of homeostasis have not been listed. All genes selected have been shown to be expressed in the kidneys of at least one other teleost species.
Journal
of
Experimental
(Table 2). This was restricted to variation in the intercept for most traits, with the exception of tubule cell height, which also exhibited family-specific variation in coefficients describing the effect of rearing salinity–this is also reflected in the broader density interval estimates observed in the 20 ppt environment (Fig. 2C). However, given the small numbers of families sampled, posterior density interval estimates for family-level variation ranged over an order of magnitude. Based on point estimates (i.e. the posterior mode), variance due to measurement error was generally greater than that associated with family, although relative to the scale of structures measured was not excessive–from 9% to 16% when expressed as standard deviation relative to the global mean. Similar levels of variation were observed among the various kidney sections.
Candidate gene expression
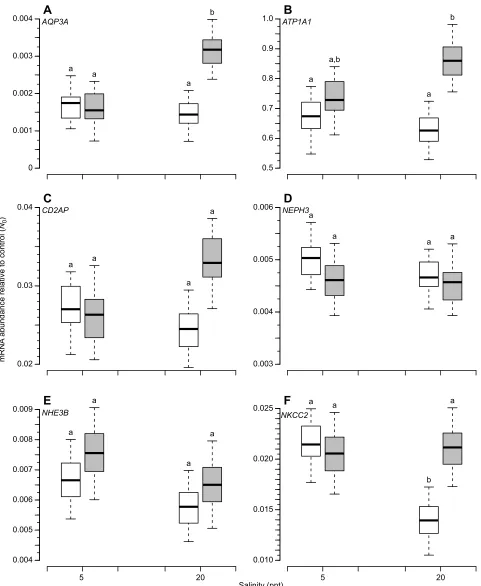
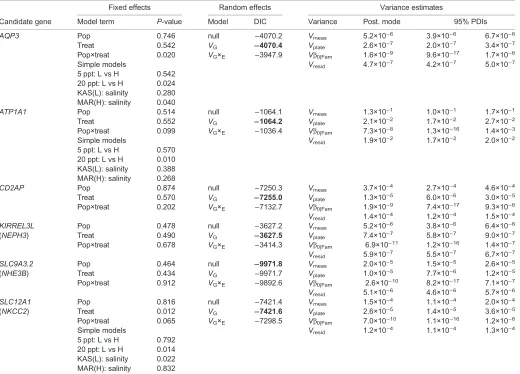
When reared at 5 ppt salinity, transcript abundance did not differ significantly between populations for any of the six candidate genes. Four of the candidate genes did exhibit population-specific trends in their transcriptional response to salinity (Fig. 3), although under a stringent threshold (α=0.05), a population-by-treatment interaction was significant only forAQP3Aexpression (Table 3). Similar trends were seen forATP1A1andNKCC2under a more liberal significance threshold (α=0.1), and qualitatively forCD2AP. MAR(H) showed a 1.7-fold increase in AQP3A transcription in response to salinity (P=0.024) whereas KAS(L) showed no change (Fig. 3A). This was also reflected in a 2.4-fold difference in transcript abundance between populations reared at 20 ppt (P=0.024). BothATP1A1and
CD2APappeared to be upregulated in MAR(H) individuals reared under high salinity (Fig. 3B,C), although neither observation was significant (P=0.268 and P=0.250, respectively). Nevertheless, within the 20 ppt treatment,ATP1A1transcript abundance was 1.4-fold higher in MAR(H) than KAS(L) (Table 3;P=0.010). In contrast,
NKCC2expression was significantly reduced in KAS(L) individuals reared at high salinity (Fig. 3F;P=0.022) whereas no salinity effects were observed for MAR(H). Consequently, NKCC2 transcript abundance was 1.5-fold greater in MAR(H) compared with KAS(L) at 20 ppt. No significant salinity effects or population differences were observed forNEPH3(Fig. 3D) orNHE3B(Fig. 3E).
Model fit was only marginally improved by incorporating family as a random term; for NHE3B the model accounting only for measurement error was preferred (Table 3). No candidate gene exhibited family-specific variation in their transcriptional response to salinity. Conversely, variance due to measurement error was substantially greater than that attributable to broad-sense genetic variation in expression.
DISCUSSION
The main objective of our study was to shed light on putative osmoregulatory mechanisms in the threespine stickleback, focusing on wild populations adapted to divergent conditions within a natural salinity gradient of the Baltic Sea (DeFaveri and Merilä, 2013, 2014). Specifically, we aimed to determine if there were structural and functional differences in the kidney between populations native to different salinity environments, and whether this variation was genetically based. Current results are insufficient for a formal test to distinguish selection from drift in the evolution of these populations; however, the observation of broad-sense genetic variation underlying traits essential to osmoregulatory function alludes to population-specific responses to selective pressures exerted by divergent salinity conditions. Although the Bay of Bothnia from which the low-salinity population originate is not fully freshwater, the low-salinity conditions are stable throughout the year (Håkansson et al., 1996). Moreover, the waters of this region are hypotonic (5 ppt salinity; 100–150 mOsm kg−1) relative to the blood plasma of sticklebacks (ca. 330 mOsm kg−1; De Ruiter and Wendelaar Bonga, 1985), a contrast that has produced osmotic stress in kidney-derived cell lines of the euryhaline spotted scat (Gui et al., 2016) and at the whole-organism level in other marine species, such as the green crab (Lovett et al., 2001, 2006). Likewise, this weak salinity has been proven to limit survival in other marine/ estuarine fishes such as the estuary seahorse (Hippocampus kuda; Hilomen-Garcia et al., 2003), cobia (Rachycentron canadum; Resley et al., 2006) and weakfish (Cynoscion regalis; Lankford and Targett, 1994), all of which experienced significant mortality upon exposure to 5 ppt. Conversely, marine killifish (Fundulus heteroclitus) exposed to 5 ppt did not exhibit a loss of osmotic balance (Whitehead et al., 2011), suggesting that the degree to which 5 ppt represents a truly hypotonic stress likely varies among species. Nevertheless, when taken together with earlier results of contrasting tolerance in sticklebacks also reared under the same high and low salinities (DeFaveri and Merilä, 2014), there is evidence to suggest that these osmotic conditions indeed represent divergent selective pressures.
Our analyses also revealed a high degree of plasticity in the kidneys of individuals native to a high-salinity habitat, as most morphological features and some gene expression patterns showed significant responses (in the expected direction) to salinity treatment. However, this plasticity appears to be reduced in sticklebacks residing in a low-salinity environment, as most of the renal morphological and transcriptional traits examined did not show salinity-dependent responses. This suggests that pre-existing plasticity in the marine population has enabled the ancestral population to respond to abrupt salinity stress, but this ability has been lost in the locally adapted low-salinity population.
Kidney morphology
In line with earlier observations (Ogawa, 1968; Wendelaar Bonga, 1973), we also noted a high degree of plasticity in the glomeruli and nephron tubules from sticklebacks native to the high-salinity environment of the Kattegat. Specifically, when reared under
low-5 20
2.5 3.5 4.5
5.5 a
a
b
c
Glomerulus diameter (
µ
m)
[image:5.612.58.292.57.230.2]Salinity (ppt)
Fig. 1. Mean glomerulus diameter, conditioned on broad-sense genetic variation and random variation due to measurement error.N=12 per treatment. KAS(L) is plotted in white, MAR(H) in gray. Whiskers denote 95% PDIs; boxes indicate the quartile range of posterior estimates. Estimates that differ significantly are indicated by different lowercase letters. KAS, Kaskinen; L, low salinity; MAR, Mariager Fjord; H, high salinity; PDI, posterior density interval estimates.
Journal
of
Experimental
salinity conditions, most renal morphological traits showed a significant increase in diameter. In fact, the tubules of the high-salinity population were even larger than those of the low-high-salinity population when both were reared in low salinity, reflecting their enhanced ability to respond to changes in environmental salinity, in this case by likely increasing filtration rate in low salinity to conserve filtrated electrolytes and re-absorb ions (Hickman and Trump, 1969). Accordingly, many studies have reported similar or better performance (e.g. hatching success, larval survival, growth) of marine/anadromous sticklebacks reared in low as compared with high salinity (McCairns and Bernatchez, 2010; McGuigan et al., 2011; DeFaveri and Merilä, 2014), suggesting that ancestral sticklebacks maintain the functional plasticity that likely permitted exploitation of novel freshwater habitats during initial colonization. Hence, our results indicate that part of this plasticity is likely achieved through modification of key renal structures.
To the best of our knowledge, no histological study to date has investigated the effects of high salinity transfer on the kidney of freshwater/low-salinity sticklebacks. In this regard, our study provides novel insights into the reduction of plasticity in derived populations: although there was a treatment effect on glomeruli diameter in KAS(L) fish reared under high salinity, the reduction in glomerulus size was significantly less pronounced than that observed from conspecifics of marine origin. This could suggest a
[image:6.612.49.573.79.387.2]reduced osmoregulatory capacity in high-salinity conditions, as structural differences in the kidney are widely recognized to reflect functional differences in ion transport (Hickman and Trump, 1969; Lam and Leatherland, 1969; Wendelaar Bonga, 1976; Reimschuessel, 2001). Indeed, reducing glomerulus size is one means by which marine teleosts reduce plasma filtration to produce more concentrated urine (McDonald, 2007). Likewise, in contrast to marine fish which reduced overall tubule and tubule lumen diameter when reared under high salinity, no modifications were observed in the tubules of KAS(L) fish. As there is a direct relationship between tubule diameter and glomerular filtration rate (Wong and Woo, 2006), reduction in tubule size is associated with osmoregulation in hypertonic environments. Moreover, as water reabsorption from urine occurs in the tubules (McDonald, 2007), it stands to reason that a reduction in tubule diameter should prolong exposure to the villi responsible for absorption. Thus, failure to sufficiently reduce glomerular filtration rate and/or increase tubular water reabsorption may represent a disruption to normal homeostasis that could explain fitness reductions observed when freshwater/low-salinity sticklebacks are reared in high salinity, including reduced hatching rates (Gutz, 1970; Marchinko and Schluter, 2007), increased mortality (McCairns and Bernatchez, 2010; DeFaveri and Merilä, 2014) and smaller body size (DeFaveri and Merilä, 2014).
Table 2. Evaluation of mixed-effects models describing variation in nephron features as a function of population of origin (Pop), salinity exposure (Treat) and their interaction
Nephron feature
Fixed effects Random effects Variance estimates
Model term P-value Model DIC Variance Post. mode 95% PDIs
Glomerulus Pop 0.734 null 142.9 Vmeas 0.143 0.101 0.186
diameter Treat <0.001 VG 140.8 Vβ0|Fam 0.073 0.006 0.699
Pop×treat <0.001 VG×E 140.9 Vresid 0.055 0.055 0.070
Simple models
5 ppt: L vs H 0.706 20 ppt: L vs H 0.026 KAS(L): salinity <0.001 MAR(H): salinity <0.001
Tubule Pop 0.150 null 1661.9 Vmeas 0.179 0.161 0.201
diameter Treat 0.940 VG 1661.3 Vsect 0.278 0.215 0.340
Pop×treat <0.001 VG×E 1661.3 Vβ0|Fam 0.069 0.015 0.721
Simple models Vresid 0.067 0.064 0.069
5 ppt: L vs H 0.256 20 ppt: L vs H 0.286 KAS(L): salinity 0.984 MAR(H): salinity <0.001
Tubule Pop 0.260 null −6888.7 Vmeas 0.059 0.052 0.064
lumen Treat 0.198 VG −6890.0 Vsect 0.056 0.043 0.070
diameter Pop×treat <0.001 VG×E −6888.7 Vβ0|Fam 0.038 0.010 0.310
Simple models Vresid 0.015 0.014 0.016
5 ppt: L vs H 0.140 20 ppt: L vs H 0.560 KAS(L): salinity 0.062 MAR(H): salinity <0.001
Tubule Pop 0.376 null −8947.5 Vmeas 0.022 0.020 0.025
cell Treat 0.776 VG −8947.7 Vsect 0.025 0.019 0.031
height Pop×treat 0.332 VG×E −8948.1 Vβ0|Fam 0.013 0.003 0.120
VβTreat|Fam 0.019 0.006 0.242
Vresid 0.011 0.010 0.011
For features with a significant population-by-treatment interaction, results of reduced models with contrasting population differences (L vs H) in each salinity, as well as salinity effects within each population, are also presented. All models account for measurement error as variance attributable to repeated measures of the same feature (Vmeas), and for tubule measurements, variation among histological sections (Vsect).Vresiddenotes residual/error variance. The significance of random model terms was evaluated in a forward step-wise process, first incorporating broad-sense genetic variation (VG) as among-family variation in the model intercept (Vβ0|Fam), followed by inclusion of family-specific slopes (VβTreat|Fam) to capture broad-sense genotype-by-environment interactions (VG×E). Variance estimates are profiled from the parsimony model, indicated by the deviance information criterion (DIC) value in bold font; the posterior mode (Post. mode) and 95% posterior density interval estimates (95% PDIs) are presented.
Journal
of
Experimental
These contrasting patterns suggest that plasticity in renal development and/or capacity for remodeling has been significantly reduced (glomerulus size)–and to some extent perhaps even lost (tubule diameter)–in the population residing permanently in a low-salinity environment. Loss/reduction of plasticity would seem to be a common feature in sticklebacks following colonization of freshwater, with similar patterns observed at both the transcriptional and morphological level in separate systems (Wund et al., 2008; McCairns and Bernatchez, 2010), and speaks to the broader role of plasticity potentially facilitating the transition to permanent freshwater residency (West-Eberhard, 2005; Crispo, 2008). One explanation could be that osmoregulatory plasticity may be costly to maintain, but nevertheless adaptive for populations such as MAR(H) that reside in fluctuating environments characterized by daily salinity variations due to tidal cycles (salinity ranges from 17 to 24 ppt) and even more dramatic seasonal changes associated with spawning and egg rearing in freshwater. Adaptation to the relative osmotic stability of the low-salinity environment should select for more canalized and/or specialist genotypes (DeWitt et al., 1998; Kvitek and Sherlock, 2013; Murren et al., 2015). Conversely, residency in a less heterogeneous environment may simply reflect a relaxation of selection, which in turn might yield a loss of plasticity via random mutational processes (Masel et al., 2007; Maughan et al., 2007). In the absence of data on bioenergetic and/or fitness costs associated with plasticity (or the lack thereof ), we cannot provide a definitive explanation for the contrasting patterns observed between marine and low-salinity populations. However, given the preponderance of observations involving the loss of plasticity across multiple phenotypes in the stickleback system, we would encourage their inclusion in future studies.
Gene expression
In general, variation in the expression patterns of most candidate genes studied here coincided with the structural changes discussed above. Although not significant, similar trends were observed in the high-salinity population, which was able to downregulate three genes (AQP3A,ATP1A1andCD2AP) in the low-salinity treatment, suggesting some degree of plasticity in ion-transporting mechanisms in this population. Such transcriptional modifications were not observed in the low-salinity population (with the exception ofNKCC2). Similar patterns have been reported in other fishes from the Baltic Sea area. For example, microarray analysis of liver tissues in flounder from the North Sea (33 ppt) uncovered 2.3% of genes that were differentially expressed after long-term exposure to different salinity treatments (33 and 9 ppt); although a formal enrichment analysis was not conducted, it was reported that many genes were known to play a role in osmoregulation (Larsen et al., 2007). In contrast, only 0.5% (an amount that could be expected by chance alone) were differentially expressed in flounder originating from the low brackish conditions of the inner Baltic Sea (9 ppt). Subsequent validation of candidate gene expression (including
ATP1A1) in kidney and gill tissues from the same samples also revealed patterns of reduced responsiveness of Baltic Sea fish to salinity challenge, relative to their truly marine conspecifics from the North Sea (Larsen et al., 2008). Assays ofATP1A1transcription in gill tissues of Atlantic cod also showed a concordant result: significant changes were observed in response to salinity treatment in the North Sea population but not in the Baltic Sea population (Larsen et al., 2012). In general, it appears that populations of fishes have become locally adapted to the low-salinity conditions of the Baltic Sea, and this is reflected in their inability to modify transcriptional responses to salinity changes.
3.1 3.4 3.7 4.0 4.3 4.6 4.9
a,b a
a,b
b
A
T
u
bule diameter (
µ
m)
0.9 1.1 1.3 1.5 1.7 1.9 2.1
a,b a
a,b
b
B
T
ubule lumen diameter (
µ
m)
5 20
0.8 1.0 1.2 1.4 1.6
a
a a a
C
T
ubule cell height (
µ
m)
[image:7.612.56.293.55.652.2]Salinity (ppt)
Fig. 2. Tubule characteristics, conditioned on broad-sense genetic variation, longitudinal variation within a given kidney and random variation due to measurement error (N=12 per treatment).KAS(L) is plotted in white, MAR(H) in gray. Whiskers denote 95% PDIs; boxes indicate the quartile range of posterior estimates. (A) Tubule diameter; (B) lumen diameter; (C) cell height. Estimates that differ significantly are indicated by different lowercase letters. KAS, Kaskinen; L, low salinity; MAR, Mariager Fjord; H, high
salinity; PDI, posterior density interval estimates.
Journal
of
Experimental
Of the six genes tested here, expression ofATP1A1is perhaps the most studied in the context of osmoregulation – not just among sticklebacks (e.g. McCairns and Bernatchez, 2010; Judd, 2012; Taugbøl et al., 2014; Wang et al., 2014; Divino et al., 2016), but also
in many other euryhaline species, such as killifish (F.heteroclitus; Whitehead et al., 2012), Japanese eel (Anguilla japonica; Tang et al., 2012), Senegalese sole (Solea senegalensis; Armesto et al., 2014), Atlantic salmon (Salmo salar; Bystriansky and Schulte, 0
0.001 0.002 0.003 0.004
a a
a b
A
AQP3A
0.5 0.6 0.7 0.8 0.9 1.0
a a,b
a b
B
ATP1A1
0.02 0.03 0.04
a a
a a
C
CD2AP
0.003 0.004 0.005 0.006
a
a
a a
D
NEPH35 20 0.004
0.005 0.006 0.007 0.008 0.009
a a
a a
E
NHE3B
5 20
0.010 0.015 0.020
0.025 a a
b a
F
NKCC2
mRNA
abundance relative to control (
N0
)
[image:8.612.69.550.55.641.2]Salinity (ppt)
Fig. 3. Mean initial mRNA concentrations (N0), conditioned on broad-sense genetic variation and random variation due to measurement error (N=30–40
per group).KAS(L) is plotted in white, MAR(H) in gray. Whiskers denote 95% PDIs; boxes indicate the quartile range of posterior estimates. Estimates that differ significantly are indicated by different lowercase letters. KAS, Kaskinen; L, low salinity; MAR, Mariager Fjord; H, high salinity; PDI, posterior density interval estimates.
Journal
of
Experimental
2011) and sockeye salmon (Oncorhynchus nerka; Shrimpton et al., 2005); see Havird et al. (2013) for a meta-analysis. A common finding among these studies is the upregulation in seawater/high salinity (20–33 ppt) as compared with freshwater/low salinity (but see McCairns and Bernatchez, 2010), a trend that was also seen in our study–although only in the population native to high salinity. However, in sticklebacks, the population-specificity of ATP1A1
expression is less consistent among studies that have used gill tissue rather than kidney. For example, some report that plasticity has been retained in freshwater populations, which are able to upregulate Na+/K+-ATPases in seawater (compared with freshwater) at a similar level as native seawater populations (e.g. Judd, 2012; Taugbøl et al., 2014). Interestingly, a recent study of wild-caught sticklebacks did note changes inATP1A1expression in the kidneys of freshwater sticklebacks acclimated to different salinities (0, 11 and 33 ppt), although these expression patterns were dissimilar to the current study; that is, whereas we observed no significant effect of salinity onATP1A1transcription in fish originating from a low-salinity environment (a slight trend for mean expression to decrease was observed, Fig. 3B), Wang et al. (2014) demonstrated a monotonic decrease in expression of freshwater fish when exposed to increasing salinity. Nevertheless, there are also similarities between studies, including both elevated levels ofATP1A1mRNA
in saltwater fish exposed to a hypertonic environment, relative to their low-salinity conspecifics, as well as generally greater variability in levels of expression for fish of marine origin.
In addition to ion transport, osmotic balance is also maintained through regulation of cell water volume, a function performed by aquaporins. Not surprisingly, the most significant transcriptional change we observed was inAQP3A, for which mRNA levels were 2.4-fold higher in the high-salinity treatment. Similar toATP1A1
and CD2AP, this upregulation in the high-salinity treatment was only observed in the high-salinity population. Interestingly, this expression pattern is opposite to what is generally observed: with the exception of a small sample of tilapia (Oreochromis mossambicus; Watanabe et al., 2005), most euryhaline fish tend to upregulate
AQP3isoforms in freshwater (see Cutler et al., 2007 for a review of
[image:9.612.49.569.79.453.2]AQP3 in teleosts). Such expression differences could reflect localized functional differences in various tubule segments, e.g. the proximal versus distal renal tubules, which have different roles in fluid secretion and water permeability (Beyenbach, 2004). The role ofAQP3in the kidney of teleosts has been suggested to re-absorb water/fluid from the distal tubular segment (Cutler et al., 2007); importantly, however, the distal nephron appears to be absent in sticklebacks (Elger et al., 2000). Therefore, further study may be needed to clarify the precise role ofAQP3in teleost kidneys. Using Table 3. Evaluation of mixed-effects models describing variation in initial mRNA concentration as a function of population of origin (Pop), salinity exposure (Treat) and their interaction
Candidate gene
Fixed effects Random effects Variance estimates
Model term P-value Model DIC Variance Post. mode 95% PDIs
AQP3 Pop 0.746 null −4070.2 Vmeas 5.2×10⁻⁶ 3.9×10⁻⁶ 6.7×10⁻⁶
Treat 0.542 VG −4070.4 Vplate 2.6×10⁻⁷ 2.0×10⁻⁷ 3.4×10⁻⁷
Pop×treat 0.020 VG×E −3947.9 Vβ0|Fam 1.6×10⁻⁹ 9.6×10⁻¹⁷ 1.7×10⁻⁶
Simple models Vresid 4.7×10⁻⁷ 4.2×10⁻⁷ 5.0×10⁻⁷
5 ppt: L vs H 0.542 20 ppt: L vs H 0.024 KAS(L): salinity 0.280 MAR(H): salinity 0.040
ATP1A1 Pop 0.514 null −1064.1 Vmeas 1.3×10⁻¹ 1.0×10⁻¹ 1.7×10⁻¹
Treat 0.552 VG −1064.2 Vplate 2.1×10⁻² 1.7×10⁻² 2.7×10⁻²
Pop×treat 0.099 VG×E −1036.4 Vβ0|Fam 7.3×10⁻⁸ 1.3×10⁻¹⁶ 1.4×10⁻³
Simple models Vresid 1.9×10⁻² 1.7×10⁻² 2.0×10⁻²
5 ppt: L vs H 0.570 20 ppt: L vs H 0.010 KAS(L): salinity 0.388 MAR(H): salinity 0.268
CD2AP Pop 0.874 null −7250.3 Vmeas 3.7×10⁻⁴ 2.7×10⁻⁴ 4.6×10⁻⁴
Treat 0.570 VG −7255.0 Vplate 1.3×10⁻⁵ 6.0×10⁻⁶ 3.0×10⁻⁵
Pop×treat 0.202 VG×E −7132.7 Vβ0|Fam 1.9×10⁻⁹ 7.4×10⁻¹⁷ 9.3×10⁻⁶
Vresid 1.4×10⁻⁴ 1.2×10⁻⁴ 1.5×10⁻⁴
KIRREL3L Pop 0.478 null −3627.2 Vmeas 5.2×10⁻⁶ 3.8×10⁻⁶ 6.4×10⁻⁶
(NEPH3) Treat 0.490 VG −3627.5 Vplate 7.4×10⁻⁷ 5.8×10⁻⁷ 9.0×10⁻⁷
Pop×treat 0.678 VG×E −3414.3 Vβ0|Fam 6.9×10⁻¹¹ 1.2×10⁻¹⁶ 1.4×10⁻⁷
Vresid 5.9×10⁻⁷ 5.5×10⁻⁷ 6.7×10⁻⁷
SLC9A3.2 Pop 0.464 null −9971.8 Vmeas 2.0×10⁻⁵ 1.5×10⁻⁵ 2.6×10⁻⁵
(NHE3B) Treat 0.434 VG −9971.7 Vplate 1.0×10⁻⁵ 7.7×10⁻⁶ 1.2×10⁻⁵
Pop×treat 0.912 VG×E −9892.6 Vβ0|Fam 2.6×10⁻¹⁰ 8.2×10⁻¹⁷ 7.1×10⁻⁷
Vresid 5.1×10⁻⁶ 4.6×10⁻⁶ 5.7×10⁻⁶
SLC12A1 Pop 0.816 null −7421.4 Vmeas 1.5×10⁻⁴ 1.1×10⁻⁴ 2.0×10⁻⁴
(NKCC2) Treat 0.012 VG −7421.6 Vplate 2.6×10⁻⁵ 1.4×10⁻⁵ 3.6×10⁻⁵
Pop×treat 0.065 VG×E −7298.5 Vβ0|Fam 7.0×10⁻¹⁰ 1.1×10⁻¹⁶ 1.2×10⁻⁶
Simple models Vresid 1.2×10⁻⁴ 1.1×10⁻⁴ 1.3×10⁻⁴
5 ppt: L vs H 0.792 20 ppt: L vs H 0.014 KAS(L): salinity 0.022 MAR(H): salinity 0.832
Layout and estimates are the same as in Table 2; note that plate effects (Vplate) are also included in models and variance estimates.
Journal
of
Experimental
RNA sequencing, Wang et al. (2014) identified AQP4, another member of the aquaporin family, as a salt-responsive gene in the kidneys of sticklebacks, although significant differences were only observed in seawater when comparing marine and freshwater sticklebacks acclimated to seawater (33 ppt). Notably, no significant differences were observed in the expression levels among freshwater sticklebacks acclimated to different salinities (0, 11 and 33 ppt; Wang et al., 2014), a trend we also observed inAQP3A
(Fig. 3A). Hence, this lack of transcriptional response to salinity in freshwater sticklebacks aligns with our results for aquaporins. Unfortunately, Wang et al. (2014) were not able to include data from marine sticklebacks acclimated to salinities other than their native seawater, so the plasticity of aquaporin expression in this population of marine sticklebacks cannot be assessed.
Linking gene expression and the morphological remodeling of kidney tissue
Structural remodeling of the kidney has been associated with changes in levels of mRNA expression in a number of animals, including changes in tubule size in Xenopus (Cerqueira et al., 2014) and glomerulus structure in mice (Hayashi et al., 2014). Conversely, mechanically induced remodeling independent of genetic causes may also induce changes in transcription (Mammoto et al., 2013), an observation that further emphasizes caveats against conflating correlation and causation. Yet such patterns can nevertheless be informative; and although organ size precluded the simultaneous measurement of mRNA abundance and kidney structure in the same individual, our observations are suggestive of such a correspondence. With the exception of NKCC2, we observed no significant transcriptional changes in the low-salinity population when reared under high salinity, a pattern also coincident with the observation of far less plasticity in the kidney structure of this group. However, the high-salinity population demonstrated a marked response to salinity both in renal structures and transcript abundance. Both observations suggest correlation and/or causation between cellular remodeling and active transport mechanisms during osmotic acclimation. Indeed, similar links have been shown in the gill epithelium of killifish, which can transition from a seawater to freshwater phenotype in less than one day, with corresponding changes in ion-transporting functions (Whitehead et al., 2012, 2013). Although less well studied in fishes, structural changes in the kidney can also implicate activity-associated modifications in ion transport and metabolism (Hickman and Trump, 1969; Beyenbach, 2004). For example, changes in the volume of multiple cell types, which affect water flow and/or solute concentrations, can be achieved by activating various channels and transporters, including sodium and potassium transporters such asATP1A1andNKCC2(Okada, 2004). Likewise, epithelial remodeling in the kidney of puffer fish (Tetraodon biocellatus) acclimated to different salinities revealed concordance between claudin tight junction protein mRNA abundance and structural changes observed in nephron tubules and tight junctions (Duffy et al., 2011). It is therefore possible that similar links are also important in stickleback kidneys. For example, given that aquaporins are associated with both tubule cell volume regulation and water reabsorption (Day et al., 2014), the pattern of increased expression in high salinity (Fig. 3A) could potentially be correlated with changes in tubule structure found in our study (Fig. 2). Hence, the effects of varying and/or silencing aquaporin expression on kidney structure and function poses one potential mechanistic link worth future study. Again, we must reiterate that separating cause and correlation requires work well beyond that undertaken here, and a clear link between cellular remodeling and
expression in sticklebacks remains to be confirmed. Although as tools for targeted mutagenesis and RNA silencing become more prevalent, such a link may prove attainable.
Considerations, perspectives and conclusions
There are several points worth considering when interpreting the results presented here. Firstly, as we only used F1-generation individuals, it is not possible to rule out variation attributable to maternal, complex developmental or epigenetic effects. Further studies with multi-generation controlled breeding might help to more carefully differentiate between these sources of variation. Secondly, there are distinct roles in active secretion and reabsorption of various ions and water in different parts of the kidney tubules and collecting ducts. The distal segment is absent in sticklebacks, and we were not able to distinguish different proximal segments and collecting ducts (using standard antibodies, e.g. Calbindin, Pax2, PNA, HRP, TH and Na+/K+-ATPase; S.K. and M.M.H., unpublished data). Therefore, the inferences made from kidney tubule morphology are an approximation over the entire tubule, rather than precise morphological analysis of different tubular segments. Thirdly, gene expression was measured by quantification of mRNA abundance. Although there can be a generally high correspondence between mRNA and protein expression (Greenbaum et al., 2003), this has yet to be verified in this study. It should be noted, however, that in sticklebacks ATP1A1 enzyme activity has been demonstrated to increase in response to salinity challenge (Divino et al., 2016). Nevertheless, until mRNA concentration can be demonstrated to correspond to either the abundance and/or the functional activity of the protein in all candidate genes, our results should be interpreted with caution. Finally, rather than several candidate genes, complex genetic networks are involved in gene expression-driven adaptive divergence (Pavey et al., 2010; Whitehead et al., 2013). Therefore, further studies investigating the whole transcriptome may help to build a more comprehensive understanding of the complex physiological processes involved with osmoregulatory plasticity and adaptation.
Acknowledgements
We would like to thank Sara Neggazi for assistance with collecting broodstock and maintaining experimental animals, and Ulla Kiiski for her skills with the microtome.
Competing interests
The authors declare no competing or financial interests.
Author contributions
Conceptualization: J.D., J.M., R.J.S.M.; Formal analysis: M.M.H., R.J.S.M.; Investigation: M.M.H., S.K., S.N.D., R.J.S.M.; Resources: J.D., S.K., S.L., J.M.; Data
curation: R.J.S.M.; Writing - original draft: M.M.H., J.D., R.J.S.M.; Writing–review
and editing: M.M.H., J.D., S.K., S.N.D., S.L., J.M., R.J.S.M.; Supervision: R.J.S.M.; Project administration: R.J.S.M.; Funding acquisition: R.J.S.M., J.M.
Funding
This work was funded by grants from the Otto A. Malm Foundation [DW-13684805974, R.J.S.M.] and the European Research Council [242820, S.L.]. J.M. [218343], R.J.S.M. [259944], S.K. [138283] and S.L. [218021] were supported by the Suomen Akatemia. Additional support was provided to S.K. by the Sigrid Juselius Foundation. M.M.H. was supported by the University of Helsinki Research Foundation.
Supplementary information
Supplementary information available online at
http://jeb.biologists.org/lookup/doi/10.1242/jeb.146027.supplemental
References
Abràmoff, M. D., Magalhães, P. J. and Ram, S. J.(2004). Image processing with
ImageJ.Biophotonics Int.11, 36-42.
Armesto, P., Campinho, M. A., Rodrıguez-Rú ́a, A., Cousin, X., Power, D. M.,
Manchado, M. and Infante, C. (2014). Molecular characterization and
Journal
of
Experimental
transcriptional regulation of the Na+/K+ ATPase α subunit isoforms during
development and salinity challenge in a teleost fish, the Senegalese sole (Solea
senegalensis).Comp. Biochem. Physiol. B Biochem. Mol. Biol.175, 23-38.
Bell, M. A. and Foster, S. A.(1994). Introduction to the evolutionary biology of
stickleback. InThe Evolutionary Biology of the Threespine Stickleback(ed. M. A.
Bell and S. A. Foster), pp. 1-27. Oxford: Oxford University Press.
Beyenbach, K. W.(2004). Kidneys sans glomeruli.Am. J. Physiol. Renal Physiol.
286, F811-F827.
Bystriansky, J. S. and Schulte, P. M.(2011). Changes in gill H+-ATPase and Na+/
K+
-ATPase expression and activity during freshwater acclimation of Atlantic
salmon (Salmo salar).J. Exp. Biol.214, 2435-2442.
Cerqueira, D. M., Tran, U., Romaker, D., Abreu, J. G. and Wessely, O.(2014).
Sterol carrier protein 2 regulates proximal tubule size in theXenopuspronephric
kidney by modulating lipid rafts.Dev. Biol.394, 54-64.
Chang, W.-J., Wang, Y.-F., Hu, H.-J., Wang, J.-H., Lee, T.-H. and Hwang, P.-P.
(2013). Compensatory regulation of Na+
absorption by Na+
/H+
exchanger and
Na+-Cl−cotransporter in zebrafish (Danio rerio).Front. Zool.10, 46.
Čikoš, Š., Bukovská, A. and Koppel, J.(2007). Relative quantification of mRNA:
comparison of methods currently used for real-time PCR data analysis.BMC Mol.
Biol.8, 113.
Crispo, E.(2008). Modifying effects of phenotypic plasticity on interactions among
natural selection, adaptation and gene flow.J. Evol. Biol.21, 1460-1469.
Cutler, C. P. and Cramb, G.(2001). Molecular physiology of osmoregulation in eels
and other teleosts: the role of transporter isoforms and gene duplication.Comp.
Biochem. Physiol. A Mol. Integr. Physiol.130, 551-564.
Cutler, C. P., Martinez, A.-S. and Cramb, G.(2007). The role of aquaporin 3 in
teleost fish.Comp. Biochem. Physiol. A Mol. Integr. Physiol.148, 82-91.
Dalziel, A. C., Rogers, S. M. and Schulte, P. M.(2009). Linking genotypes to
phenotypes and fitness: how mechanistic biology can inform molecular ecology.
Mol. Ecol.18, 4997-5017.
Day, R. E., Kitchen, P., Owen, D. S., Bland, C., Marshall, L., Conner, A. C., Bill,
R. M. and Conner, M. T.(2014). Human aquaporins: regulators of transcellular
water flow.BBA Gen. Subjects1840, 1492-1506.
De Ruiter, A. J. H. and Wendelaar Bonga, S. E. (1985). Consequences of
nestbuilding behaviour for osmoregulation in male three-spined sticklebacks.
Behaviour93, 8-20.
DeFaveri, J. and Merilä, J.(2013). Evidence for adaptive phenotypic differentiation
in Baltic Sea sticklebacks.J. Evol. Biol.26, 1700-1715.
DeFaveri, J. and Merilä, J.(2014). Local adaptation to salinity in the three-spined
stickleback?J. Evol. Biol.27, 290-302.
DeFaveri, J., Shikano, T., Shimada, Y., Goto, A. and Merilä, J.(2011). Global
analysis of genes involved in freshwater adaptation in threespine sticklebacks (Gasterosteus aculeatus).Evolution65, 1800-1807.
DeFaveri, J., Jonsson, P. R. and Merilä, J.(2013). Heterogeneous genomic
differentiation in marine threespine sticklebacks: adaptation along an
environmental gradient.Evolution67, 2530-2546.
DeWitt, T. J., Sih, A. and Wilson, D. S.(1998). Costs and limits of phenotypic
plasticity.Trends Ecol. Evol.13, 77-81.
Divino, J. N., Monette, M. Y., McCormick, S. D., Yancey, P. H., Flannery, K. G.,
Bell, M. A., Rollins, J. L., von Hippel, F. A. and Schultz, E. T. (2016).
Osmoregulatory physiology and rapid evolution of salinity tolerance in threespine
stickleback recently introduced to fresh water.Evol. Ecol. Res.17, 179-201.
Duffy, N. M., Bui, P., Bagherie-Lachidan, M. and Kelly, S. P.(2011). Epithelial
remodeling and claudin mRNA abundance in the gill and kidney of puffer fish (Tetraodon biocellatus) acclimated to altered environmental ion levels.J. Comp. Physiol. B Biochem. Syst. Environ. Physiol.181, 219-238.
Eaton, D. C.(2012). Frontiers in renal and epithelial physiology–grand challenges.
Front. Physiol.3, 2.
Eddy, F. B. and Handy, R. D.(2012).Ecological and Environmental Physiology of
Fishes. Oxford, UK: Oxford University Press.
Elger, M., Hentschel, H., Dawson, M. and Renfro, J. L.(2000). Urinary Tract. In
The Laboratory Fish(ed. G. K. Ostrander), pp. 385-413. London: Academic Press.
Engelund, M. B. and Madsen, S.(2011). The role of aquaporins in the kidney of
euryhaline teleosts.Front. Physiol.2, 51.
Evans, D. H.(2008). Teleost fish osmoregulation: what have we learned since
August Krogh, Homer Smith, and Ancel Keys. Am. J. Physiol. Regul. Integr.
Comp. Physiol.295, R704-R713.
Evans, D. H., Piermarini, P. M. and Potts, W. T. W.(1999). Ionic transport in the fish
gill epithelium.J. Exp. Zool.283, 641-652.
Evans, D. H., Piermarini, P. M. and Choe, K. P.(2005). The multifunctional fish gill:
dominant site of gas exchange, osmoregulation, acid–base regulation, and
excretion of nitrogenous waste.Physiol. Rev.85, 97-177.
Finn, R. N. and Cerdà, J.(2011). Aquaporin evolution in fishes.Front. Physiol.2, 44.
Fischer, A. H., Jacobson, K. A., Rose, J. Zeller, R.(2008). Hematoxylin and eosin
staining of tissue and cell sections.Cold Spring Harb. Protoc.2008,3, pdb.
prot4986. .
Gibson, G.(2005). The synthesis and evolution of a supermodel.Science307,
1890-1891.
Greenbaum, D., Colangelo, C., Williams, K. and Gerstein, M.(2003). Comparing
protein abundance and mRNA expression levels on a genomic scale.Genome
Biol.4, 117.
Grosell, M.(2006). Intestinal anion exchange in marine fish osmoregulation.J. Exp.
Biol.209, 2813-2827.
Gui, L., Zhang, P., Liang, X., Su, M., Wu, D. and Zhang, J.(2016). Adaptive
responses to osmotic stress in kidney-derived cell lines fromScatophagus argus,
a euryhaline fish.Gene583, 134-140.
Guo, B., DeFaveri, J., Sotelo, G., Nair, A. and Merilä, J.(2015). Population
genomic evidence for adaptive differentiation in Baltic Sea three-spined
sticklebacks.BMC Biol.13, 19.
Gutz, M.(1970). Experimental studies on adaptation to salinity shown by the
different races of the three-spined stickleback (Gasterosteus aculeatus L.).
Internat. Rev. Gesamten Hydrobiol. Hydrogr.55, 845-894.
Hadfield, J. D.(2010). MCMC methods for multi-response generalized linear mixed
models: the MCMCglmm R package.J. Stat. Softw.33, 1-22.
Håkansson, B., Alenius, P. and Brydsten, L.(1996). Physical environment in the
Gulf of Bothnia.AmbioSpecial Report no. 8, 5-12. http://www.jstor.org/stable/
25094544
Havird, J. C., Henry, R. P. and Wilson, A. E.(2013). Altered expression of Na+/K+–
ATPase and other osmoregulatory genes in the gills of euryhaline animals in response to salinity transfer: a meta-analysis of 59 quantitative PCR studies over
10years.Comp. Biochem. Physiol. D Genomics Proteomics8, 131-140.
Hayashi, K., Sasamura, H., Nakamura, M., Azegami, T., Oguchi, H., Sakamaki,
Y. and Itoh, H. (2014). KLF4-dependent epigenetic remodeling modulates
podocyte phenotypes and attenuates proteinuria.J. Clin. Invest.124, 2523-2537.
Hentschel, H., Elger, M., Dawson, M. and Renfro, J. L.(2000). Urinary Tract. In
The Laboratory Fish(ed. G. K. Ostrander), pp. 181-187. London: Academic Press.
Hentschel, D. M., Mengel, M., Boehme, L., Liebsch, F., Albertin, C., Bonventre,
J. V., Haller, H. and Schiffer, M.(2007). Rapid screening of glomerular slit
diaphragm integrity in larval zebrafish.Am. J. Physiol. Renal Physiol. 293,
F1746-F1750.
Hickman, C. P. and Trump, B. F.(1969). The kidney. InFish Physiology. Volume
I. Excretion, Ion Regulation and Metabolism(ed. W. S. Hoar and D. J. Randall), pp. 91-239. New York, NY: Academic Press.
Hilomen-Garcia, G. V., Delos Reyes, R. and Garcia, C. M. H.(2003). Tolerance of
seahorseHippocampus kuda(Bleeker) juveniles to various salinities.J. Appl.
Ichthyol.19, 94-98.
Hwang, P.-P., Lee, T.-H. and Lin, L.-Y.(2011). Ion regulation in fish gills: recent
progress in the cellular and molecular mechanisms.Am. J. Physiol. Regul. Integr.
Comp. Physiol.301, R28-R47.
Jones, F. C., Grabherr, M. G., Chan, Y. F., Russell, P., Mauceli, E., Johnson, J.,
Swofford, R., Pirun, M., Zody, M. C. and White, S.(2012). The genomic basis of
adaptive evolution in threespine sticklebacks.Nature484, 55-61.
Judd, S. (2012). Na+
/K+
-ATPase isoform regulation in three-spine stickleback (Gasterosteus aculeatus) during salinity acclimation. MSc thesis, College of Science and Health, DePaul University, Chicago, IL.
Kato, A., Muro, T., Kimura, Y., Li, S., Islam, Z., Ogoshi, M., Doi, H. and Hirose, S.
(2011). Differential expression of Na+-Cl− cotransporter and Na+-K+-Cl−
cotransporter 2 in the distal nephrons of euryhaline and seawater pufferfishes.
Am. J. Physiol. Regul. Integr. Comp. Physiol.300, R284-R297.
Kvitek, D. J. and Sherlock, G. (2013). Whole genome, whole population
sequencing reveals that loss of signaling networks is the major adaptive
strategy in a constant environment.PLoS Genet.9, e1003972.
Lahlou, B.(1983). Intestinal transport and osmoregulation in fishes. InIntestinal
Transport(ed. M. Gilles-Baillien and R. Gilles), pp. 341-353. Berlin: Springer.
Lam, T. J. and Leatherland, J. F.(1969). Effects of prolactin on the glomerulus of
the marine threespine stickleback,Gasterosteus aculeatusL., form trachurus,
after transfer from seawater to fresh water, during the late autumn and early winter.
Can. J. Zool.47, 245-250.
Lankford, T. E. and Targett, T. E.(1994). Suitability of estuarine nursery zones for
juvenile weakfish (Cynoscion regalis): effects of temperature and salinity on
feeding, growth and survival.Mar. Biol.119, 611-620.
Larsen, P. F., Nielsen, E. E., Williams, T. D., Hemmer-Hansen, J., Chipman, J. K., Kruhøffer, M., Gronkjaer, P., George, S. G., Dyrskjøt, L. and Loeschcke,
V. (2007). Adaptive differences in gene expression in European flounder
(Platichthys flesus).Mol. Ecol.16, 4674-4683.
Larsen, P. F., Nielsen, E. E., Williams, T. D. and Loeschcke, V. (2008).
Intraspecific variation in expression of candidate genes for osmoregulation, heme biosynthesis and stress resistance suggests local adaptation in European
flounder (Platichthys flesus).Heredity101, 247-259.
Larsen, P. F., Nielsen, E. E., Meier, K., Olsvik, P. A., Hansen, M. M. and
Loeschcke, V.(2012). Differences in salinity tolerance and gene expression
between two populations of Atlantic cod (Gadus morhua) in response to salinity
stress.Biochem. Genet.50, 454-466.
Lehtonen, S., Ora, A., Olkkonen, V. M., Geng, L., Zerial, M., Somlo, S. and
Lehtonen, E.(2000).In vivointeraction of the adapter protein CD2-associated
protein with the type 2 polycystic kidney disease protein, polycystin-2.J. Biol.
Chem.275, 32888-32893.