Proposals for
Nothofagus antarctica
diameter growth
estimation: simple vs. global models
H. Ivancich
1, G.J. Martínez Pastur
1, M.V. Lencinas
1, J.M. Cellini
2, P.L. Peri
31Centro Austral de Investigaciones Científicas (CONICET), Ushuaia, Tierra del Fuego,
Argentina
2Laboratorio de Investigaciones de Sistemas Ecológicos y Ambientales (LISEA-UNLP),
La Plata, Buenos Aires, Argentina
3Instituto Nacional de Tecnología Agropecuaria – Universidad Nacional de la Patagonia
Austral, Río Gallegos, Santa Cruz, Argentina
ABSTRACT: Tree growth is one of the main variables needed for forest management planning. The use of simple models containing traditional equations to describe tree growth is common. However, equations that incorporate different factors (e.g. site quality of the stands, crown classes of the trees, silvicultural treatments) may improve their accuracy in a wide range of stand conditions. The aim of this work was to compare the accuracy of tree diameter growth models using (i) a family of simple equations adjusted by stand site quality and crown class of trees, and (ii) a unique global equation including stand and individual tree variables. Samplings were conducted in 136 natural even-aged Nothofagus antarctica (Forster f.) Oersted stands in Southern Patagonia (Argentina) covering age (20–200 years), crown class and site quality gradients. The following diameter growth models were fitted: 16 simple equations using two independent variables (age and one equation for each stand site quality or crown class) based on Richards model, plus a unique global equation using three independent variables (age, stand site quality and crown class). Simple equa-tions showed higher variability in their accuracy, explained between 54% and 92% of the data variation. The global model presented similar accuracy like the better equations of the simple growth models. The unification of the sim-ple growth models into a unique global equation did not greatly improve the accuracy of estimations, but positively influenced the biological response of the model. Another advantage of the global equation is the simple use under a wide range of natural stand conditions. The proposed global model allows to explain the tree growth of N. antarctica trees along the natural studied gradients.
Keywords: growth models; site quality; crown class
Supported by the Agencia Nacional de Promoción Científica y Tecnológica (Argentina), Project No. PID2005-35648
JOURNAL OF FOREST SCIENCE, 60, 2014 (8): 307–317
Tree growth is one of the main variables consid-ered for the forest management planning (García 1988). In the past, it was estimated using fi xed values for the whole stand level (Piterbarg 1965). During the last years, models with diff erent complexity have been developed (Vanclay 1994), where diff erent biometric variables of easy mensuration that infl u-ence tree growth were included (Pretzsch 2009). As abstractions of reality (Hari 1996), models try to simplify the natural complexity of the forest system (García 1988). Usually, the forest modellers made one model for each stand condition, generating the family of diff erent equations. However, the
chal-lenge of tree growth modelling resides in isolating the main variables, and including them in a unique model with an acceptable error of estimation (Mar-tínez Pastur et al. 2008).
using traditional equations are commonly used to describe tree growth (e.g. Crecente-Campo et al. 2010; Vanclay 2010), but families of equations that incorporate different factors (e.g. site quality of the stands, crown classes of the trees, silvicul-tural treatments) improve the accuracy of growth estimation at a landscape level (Martínez Pas-tur, Fernández 1997; Trasobares et al. 2004; Adame et al. 2008; Subedi, Sharma 2011).
Another option is to modify the traditional equation proposals by the inclusion of more vari-ables, e.g. Ek (1971) was the first who proposed to incorporate the site index with the age to esti-mate height growth, which was successfully used for several forest timber species during the last decades (Payandeh, Wang 1994; Wang, Payan-deh 1994). These models were also successfully applied for native Nothofagus forests in Southern Patagonia (Martínez Pastur et al. 1997, 2005, 2008; Lencinas et al. 2002; Ivancich et al. 2011) and were used for different purposes around the world during the last 20 years. The aim of this work was to compare the accuracy of both pro-posals using (i) the family of simple equations ad-justed by stand site quality and tree crown classes, and (ii) a global unique equation including both stand and individual tree variables. The following questions were asked: (i) Is it possible to simplify the diameter growth model estimation using a unique global equation instead of a family of sim-ple equations? (ii) Does this simplification greatly influence the accuracy of the estimation? and (iii) Does this simplification influence the biological response of the models?
MATERIAL AND METHODS
Data and forest structure characterization. Sam-plings were conducted in 136 natural even-aged Nothofagus antarctica (Forster f.) Oersted stands in Southern Patagonia (Argentina): (1) Santa Cruz (51°13'–51°41'S, 72°15'–72°03'W) and (2) Tier-ra del Fuego (53°54'–54°28'S, and from 66°44' to 67°42'W). Sampling was designed to cover the nat-ural species gradients of: (i) age (20 to 220 years) and (ii) site quality of the stands. Site quality (SQ) followed the proposal of Ivancich et al. (2011), who used a site index at the base age of 50 years (SI50): 1 = SI50 > 9.3 m, 2 = SI50 > 7.2 and ≤ 9.3 m, 3 = SI50 > 5.1 and ≤ 7.2 m, 4 = SI50 ≤ 5.1 m, and age measured at a height of 1.30 m (diameter at breast height, DBH). Sampling included only stands with arborescent morphotype trees (Ramírez et al.
1985; Donoso 2006). In each stand, one forest inventory plot was measured by point sampling method using Criterion RD-1000 (Laser Technol-ogy, Inc., Centennial, USA) with a variable K coef-fi cient between 3 and 6 (Bitterlich 1984). Sam-pling areas were selected according to the following requirements: (a) homogeneous and even-aged patches, (b) stocked areas without canopy gaps, (c) areas without presence of recently dead trees, and (d) K coeffi cient that allows the sampling of 10–15 trees in each plot. All trees were sampled with an increment borer, and their DBH using a diameter tape and total height (TH) using a TruPulse 200 hypsometer (Laser Technology, Inc., Centennial, USA) were measured and they were classifi ed by crown classes (dominant, co-dominant, intermedi-ate and suppressed). Only one core was taken with the borer from each tree, all samples being oriented to the centre of the plot. In each core, tree-rings were counted, measuring 4-year periodic growth during the last 20 years. It was considered that during this period mortality did not occur due to the absence of dead trees in the sampled area. We also estimated density (DEN), basal area (BA), to-tal over bark volume (TOBV) (according to Lenci-nas et al. 2002), percentage of stand density index (%SDI) (according to Ivancich et al. 2009) and site quality of the stands, using the stand age and the height of 2–3 dominant trees (according to Ivan-cich et al. 2011).
Data analyses. Data base included 8,059 age-DBH points belonging to 1,635 trees along the sampled site quality, age and crown class gradients (4–5 pseudo-replicates of 4-year period for each tree). Diameter growth models were fi tted using this data base: (i) a family of 16 simple traditional equations (4 stand site qualities × 4 tree crown classes) based on Rich-ards model (RichRich-ards 1959; Rayner 1991; Zeide 1993) with 1 independent variable (age) (Eq. 1), which was successfully used previously for N. antarctica by Martínez Pastur and Fernández (1997), and (ii) a global unique equation based on Martínez Pastur et al. (2005) with 3 independent variables (age, stand site quality and tree crown class) (Eq. 2). Th is latter model is a modifi cation of Richards equation based on previous successful proposals (Ek 1971; Payan-deh, Wang 1994; Wang, Payandeh 1994).
(1)
where:
DBH – diameter at breast height (cm),
a–c – parameters of the equation,
n – base of natural logarithm,
t – age (yr).
c bt n a =
) ) 6 ( ( ) ( ) 1 )( ) 6 ( )( ) 5 (
(a CC b c SQd n et f SQg =
DBH – – – – – (2)
where:
DBH – diameter at breast height (cm),
a–g – parameters of the equation,
n – base of natural logarithm,
t – age (yr),
CC – crown class of the trees (1 – dominant, 2 – co-dominant, 3 – intermediate, 4 – supressed), SQ – site quality of the stands (1 = SI50 > 9.3 m,
2 = SI50 > 7.2 and ≤ 9.3 m, 3 = SI50 > 5.1 and ≤ 7.2 m, 4 = SI50 ≤ 5.1 m).
Statistical evaluation of the models. Th e model was fi tted with non-linear regression using the Marquardt algorithm (Fekedulegn et al. 1999; Lei, Zhang 2004; Khamis et al. 2005). Adjusted R-squared (R²-adj), es-timation mean error (EME) (Eq. 3), absolute mean er-ror (AME) (Eq. 4), and residual standard erer-ror (RSE) (Eq. 5) were employed to describe the model adjust-ment. Residual analyses along stand site qualities and DBH frequencies of the trees were conducted using EME and AME (Eq. 3 and 4), and also expressed as a percentage of the predicted DBH (6 and 7).
EME =
n i i n e 1 ) / )(( (3)
AME =
n i i n e 1 ) / )(( (4)
RSE = (5)
EME (%) = (6)
AME (%) =
n i i i x n e 1 ) / ) /(( (7)
where:
n – number of observations,
ei – residual (observed ‒ predicted values),
xi – DBH of the trees.
Th e model also was analyzed according to its biolog-ical response along the studied natural gradients, and not only by the statistics. For the biological responses we consider the shape of the curves compared with the other curves in the gradients (e.g. site quality and crown classes) as well as interactions among them.
RESULTS
Forest structure and data characterization
[image:3.595.65.532.466.710.2]Th e forest structure changed along site quality gradients and age of the stands (Table 1). In gen-eral, while DBH, basal area and total over bark vol-ume increased with age and decreased with stand site quality, density showed the opposite trend. Th e stand density index tended to increase with age, and then to decrease in the high site quality stands, while it maintained or increased its values in me-dium and low site quality stands.
Table 1. Forest structure (mean ± standard deviation) of sampling plots classifi ed by stand site quality and age (years)
Site quality Age N DBH (cm) DEN (thousand·ha–1) BA (m²·ha–1) TOBV (m3·ha–1) SDI (%)
1
< 40 4 5.5 ± 1.0 19.5 ± 6.0 44.5 ± 8.0 167.8 ± 39.9 63.2 ± 11.4 40–80 11 10.9 ± 2.4 7.6 ± 3.6 61.6 ± 10.0 299.5 ± 48.5 87.5 ± 14.2 80–120 6 25.6 ± 2.8 1.4 ± 0.5 68.1 ± 14.4 455.9 ± 89.5 96.6 ± 20.5 > 120 12 38.6 ± 9.3 0.6 ± 0.2 62.1 ± 10.2 451.7 ± 80.9 88.2 ± 14.5
2
< 40 11 6.5 ± 2.0 18.0 ± 8.6 51.6 ± 14.5 176.2 ± 61.7 73.3 ± 20.5 40–80 12 10.0 ± 2.5 7.9 ± 3.9 53.5 ± 12.5 228.4 ± 80.0 75.9 ± 17.7 80–120 4 31.9 ± 4.3 0.8 ± 0.2 65.0 ± 12.2 411.7 ± 95.0 92.2 ± 17.4 > 120 6 32.1 ± 10.2 1.1 ± 1.1 62.3 ± 9.0 402.6 ± 62.1 88.5 ± 12.7
3
< 40 14 5.7 ± 1.4 15.3 ± 5.3 36.9 ± 14.8 101.8 ± 51.0 52.4 ± 21.0 40–80 15 11.5 ± 4.2 5.7 ± 4.0 43.4 ± 14.5 154.5 ± 58.3 61.7 ± 20.6 80–120 3 28.2 ± 5.4 0.9 ± 0.4 53.7 ± 1.5 285.2 ± 21.9 76.2 ± 2.2
> 120 10 35.1 ± 4.5 0.8 ± 0.4 71.5 ± 11.2 426.7 ± 47.4 101.5 ± 15.9
4
< 40 3 7.1 ± 3.7 13.8 ± 5.4 49.2 ± 31.9 104.0 ± 66.2 69.8 ± 45.3 40–80 5 12.6 ± 4.5 4.8 ± 3.4 44.0 ± 7.9 123.7 ± 25.8 62.5 ± 11.2 80–120 7 18.5 ± 6.4 2.7 ± 1.6 53.1 ± 11.3 192.9 ± 50.1 75.4 ± 16.0 > 120 13 25.6 ± 7.4 1.3 ± 0.9 53.3 ± 13.4 225.0 ± 72.2 75.6 ± 19.0 1 – SI50 > 9.3 m, 2 – SI50 > 7.2 and ≤ 9.3 m, 3 – SI50 > 5.1 and ≤ 7.2 m, 4 – SI50 ≤ 5.1 m, N – number of sampled stands, DBH – diameter at breast height or 1.30 m height, DEN – tree density, BA – basal area, TOBV – total over bark volume, SDI – stand density index
n i i n e 1 2 ) / ) ((
n i ii x n
The sampling included between 28 and 42 stands per each site quality (Table 1). However, age-DBH points showed an unequal distribution along the stand site quality gradient (Table 2). This sam-pling corresponded to the natural tree occurrence in N. antarctica forests of Southern Patagonia at a landscape level, where lower and upper site qual-ity classes were less frequent (1,481 for SQ 1 and 1,614 for SQ 4 data pairs) than intermediate class-es (2,420 for SQ 3 and 2,544 for SQ 2). Similarly, dominant and co-dominant trees were more rep-resented (2,925 and 2,635 data pairs) than inter-mediate and supressed trees (1,710 and 789 data pairs). Finally, young trees were more frequent in the data base (2,172 and 2,182 data pairs for the tree age < 30 and 30–60 years) than older trees (1,245 and 712 data pairs for the tree age 120–150 and > 150 years).
Diameter growth models
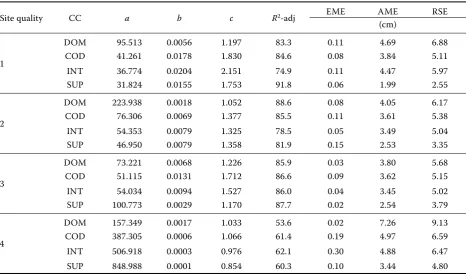
Th e Family of simple traditional equations (Eq. 1) fi tted for each combination of stand site quality and tree crown classes explained between 54% and 92% of the total data base variation (Table 3). Th e accuracy was higher in upper site quality classes than in lower site quality ones (e.g. R2-adj varied between 75% and
92% in SQ 1, and between 54% and 62% in SQ 4). Mean error values for the entire family of simple traditional equations were: EME = 0.09 cm, AME = 4.07 cm and RSE 5.88 cm. Model Eq. 1 presented a small underes-timation (observed – predicted values), where EME varied between 0.02 and 0.30 cm, being greater at lower site quality classes. AME and RSE values varied along site quality and crown class gradients (between 1.99 and 7.26 cm, and between 2.55 and 9.13 cm, respectively), being greater in upper crown classes of the trees for each stand site quality.
Th e global unique equation (Eq. 2) explained 83% of the total data base variation (Table 4), which approximately represented the average within the entire family of simple equations. For example, 10 simple models presented higher and 6 simple models lower R2-adj (Table 3). Error values of the global equation were comparable with the average values of the family of simple traditional equations: EME = 0.04 cm, AME = 4.11 cm and RSE = 6.00 cm.
[image:4.595.65.530.446.729.2]Observed vs. predicted values showed a typical data dispersion for forest samples, where small diameters generated less dispersion than larger ones. Both model types presented a similar pat-tern, where the slope of the mean values for the family of simple traditional equations (Eq. 1) was 0.993 (Fig. 1a), and 0.996 for the global unique equation (Eq. 2) (Fig. 1b).
Table 2. Tree sample distribution classifi ed by stand site qualities and crown classes and age of sampled trees
Site quality Crown class Tree age (years)
< 30 30–60 60–90 90–120 120–150 > 150
1
DOM 97 210 70 82 120 44
COD 105 161 78 53 66 64
INT 55 116 41 71 36 22
SUP 20 52 9 14 10 18
2
DOM 318 247 81 113 50 126
COD 334 300 76 163 78 55
INT 161 124 33 68 39 4
SUP 56 64 26 19 5 4
3
DOM 300 278 38 33 130 61
COD 217 239 56 46 115 33
INT 211 186 39 31 92 63
SUP 113 78 7 4 29 21
4
DOM 25 32 61 125 179 105
COD 46 39 65 102 110 34
INT 62 35 34 49 105 33
SUP 52 20 23 39 81 25
Biological response of the models
Diameter growth increased with: (i) tree age following a sigmoid shape curve, (ii) site quality of the stands, and (iii) crown classes of the trees. Generally, the performance of both models in-cluded these three key points (Figs 2 and 3). How-ever, the global unique equation (Eq. 2) presented a more desirable biological response than the fam-ily of simple equations (Eq. 1), because each curve was proportional to site quality and crown class gradients along tree ages. Simple equations pre-sented a non-proportional response along these gradients, including well-shaped curves (e.g.
su-pressed, intermediate and co-dominant trees of SQ 1), and curves without a clear tendency (e.g. dominant trees of SQ 2 with a more straight line compared with the other crown classes).
[image:5.595.64.532.72.349.2]It was expected that maximum annual diameter in-crement (MADI) values were proportional to the site quality of the stands and crown classes of the trees (Table 5). However, the diff erent model types present-ed dissimilar responses: (i) MADI of the global equa-tion (Eq. 2) decreased, as was expected, from high site quality stands and upper crown classes of the trees to lower site quality stands and lower crown classes of the trees; (ii) MADI of the family of simple equations (Eq. 1) did not present a clear tendency along the
Table 3. Coeffi cients and statistics of diameter growth models (Eq.1) classifi ed by stand site qualities and tree crown classes
Site quality CC a b c R2-adj EME AME RSE
(cm)
1
DOM 95.513 0.0056 1.197 83.3 0.11 4.69 6.88
COD 41.261 0.0178 1.830 84.6 0.08 3.84 5.11
INT 36.774 0.0204 2.151 74.9 0.11 4.47 5.97
SUP 31.824 0.0155 1.753 91.8 0.06 1.99 2.55
2
DOM 223.938 0.0018 1.052 88.6 0.08 4.05 6.17
COD 76.306 0.0069 1.377 85.5 0.11 3.61 5.38
INT 54.353 0.0079 1.325 78.5 0.05 3.49 5.04
SUP 46.950 0.0079 1.358 81.9 0.15 2.53 3.35
3
DOM 73.221 0.0068 1.226 85.9 0.03 3.80 5.68
COD 51.115 0.0131 1.712 86.6 0.09 3.62 5.15
INT 54.034 0.0094 1.527 86.0 0.04 3.45 5.02
SUP 100.773 0.0029 1.170 87.7 0.02 2.54 3.79
4
DOM 157.349 0.0017 1.033 53.6 0.02 7.26 9.13
COD 387.305 0.0006 1.066 61.4 0.19 4.97 6.59
INT 506.918 0.0003 0.976 62.1 0.30 4.88 6.47
SUP 848.988 0.0001 0.854 60.3 0.10 3.44 4.80
1 – SI50 > 9.3 m, 2 – SI50 > 7.2 and ≤ 9.3 m, 3 – SI50 > 5.1 and ≤ 7.2 m, 4 – SI50 ≤ 5.1 m, CC – tree crown classes, DOM –
domi-nant, COD – co-domidomi-nant, INT – intermediate, SUP – supressed, a–c – parameters of the equation, R2-adj – adjusted value
of the coeffi cient of determination, EME – estimation mean error, AME – absolute mean error, RSE – residual standard error
Fig. 1. Observed vs. predicted values for the family of growth models using Eq. 1 (a), and global diameter growth model using Eq. 2 (b)
0 20 40 60 80
0 20 40 60 80
Ob
ser
ve
d v
al
u
es
(c
m
)
Predicted values (cm)
(b)
0 20 40 60 80
0 20 40 60 80
O
bser
ve
d v
aues
(c
m)
Predicted values (cm)
[image:5.595.84.531.607.762.2]studied gradients, where several interactions can be observed (e.g. supressed trees of SQ 4 presented high-er increments than inthigh-ermediate trees of the same site
quality stands or supressed trees of SQ 3); and (iii) for
the entire age period MADI increased with SQ but not varied among crown classes in the unique global equation (Eq. 2), while the family of simple equations (Eq. 1) did not present a clear gradient with SQ and crown classes of the trees, where several interactions were observed.
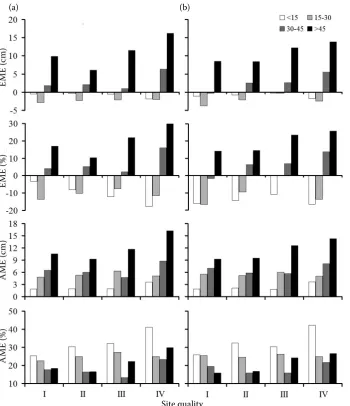
Residual analyses
Residual analyses were done using the same data base (auto-validation) in order to compare the re-sponse of both model proposals along site quality and DBH frequencies (Fig. 4). Both model types presented
similar responses: (i) when EME were analysed, both
models overestimated at low DBH frequencies (< 30 cm) and underestimated at high DBH frequencies (>
30 cm) along all the site quality gradient; (ii) EME
increased when site quality decreased at high DBH
frequencies (> 30 cm); (iii) AME (cm) increased with
DBH frequency and was slightly higher in the family of simple equations (Eq. 1) than in the global
equa-tion (Eq. 2); and (iv) in general AME (%) decreased
with DBH frequencies and increased with site quality of the stands.
DISCUSSION
Forest structure and data base characterization
The sampling included the entire natural
gradi-ent of the Nothofagus antarctica in Southern
Pa-tagonia (Peri et al. 2010) from stands with high to low SQ, and young secondary to old-growth mature stands. Maximum tree ages reached 200 years, being much lower than other Patagonian
Nothofagus species. On example, N. pumilio and
N. betuloides trees reached 400–500 years of age (Donoso 2006; Martínez Pastur et al. 2008). The stands with low representation were those belonging to the lower site quality classes, be-cause they were usually growing in extreme en-vironmental conditions (low rainfall or areas ex-posed to strong winds).
[image:6.595.64.289.85.213.2]Most of the forest growth studies selected indi-vidual trees for sampling (Klepac 1976; Everard, Christie 1995; Kariuki et al. 2006; Derose, Seymour 2009) according to their health and
Fig. 2. Diameter simple growth models (Eq. 1) classifi ed by site quality of the stands (I – SI50 > 9.3 m, II – SI50 > 7.2 and ≤ 9.3 m, III – SI50 > 5.1 and ≤ 7.2 m, IV – SI50 ≤ 5.1 m) and crown classes of the trees
0 15 30 45 60
75 dominant I
co-dominant
intermediate
supressed
0 15 30 45
60 II
0 15 30 45 60 75
0 50 100 150 200
Age (yr) II
I
0 15 30 45 60 75
0 50 100 150 200
IV
Crown classes of the trees
DBH (
[image:6.595.91.487.522.724.2]cm)
Table 4. Coeffi cients and statistics of the global unique growth model (Eq. 2)
Coeffi cients Statistics
a = 0.5802 R2-adj = 83.0
b = 0.3840 EME = 0.04
c = 84.1835 AME = 4.11
d = 0.1599 RSE = 6.00
e = 0.0045
f = 1.3429
g = –0.0111
a–g – parameters of the equation, R2-adj – adjusted value
of the coeffi cient of determination, EME – estimation mean error (cm), AME – absolute mean error (cm), RSE – residual standard error (cm)
(a) (b)
individual tree characteristics. In t his work, we employed a less frequent method, where all trees of the entire plot were included in the sampling (Martínez Pastur et al. 2008; Subedi, Sharma 2011), which allowed to fit precise models with greater biological response.
Another non-common characteristic of the em-ployed sampling design is the considered growth period included in the analyses (the last 20 years). This design presents fewer auto-replications (4–5 auto-replicates per tree) than using the entire age
[image:7.595.103.477.55.266.2]gradient for each tree, decreasing autocorrelation errors. A serial correlation was expected when au-to-replications were used, violating the assump-tion of independent error terms in most statisti-cal methods (Cochran 1977; Koak 1997). In this work, the number of age-DBH points was larger compared with the number of re-measurements of each tree. Therefore, the assumption of non-serial correlation should be reasonable in this sit-uation (Vanclay 1991, 1995; Zhao et al. 2004). On the other hand, plots were widely spaced at
Fig. 3. Global diameter growth model (Eq. 2) classified by site quality of the stands (I – SI50 > 9.3 m, II – SI50 > 7.2 and ≤ 9.3 m, III – SI50 > 5.1 and ≤ 7.2 m, IV – SI50 ≤ 5.1 m) and crown classes of the trees
Table 5. Maximum annual diameter increment (cm·yr–1) and observed age period (yr) (in brackets) for stand site
qualities and tree crown classes for the studied diameter growth models
Model Site
quality DOM COD INT SUP
Eq. 1
1 0.37
(32–33)
0.38 (34–35)
0.37 (38–39)
0.26 (36–37)
2 0.34
(28–29)
0.32 (46–47)
0.27 (35–36)
0.23 (38–39)
3 0.34
(29–30)
0.36 (41–42)
0.29 (45–46)
0.21 (53–54)
4 0.24
(18–19)
0.19 (56–57)
0.20 (0–1)
0.26 (0–1)
Eq. 2 DBH=(a(5–CC)b)(c(6–SQ)d)(1–n(–et))(f(6–SQ)g)
1 0.37
(25–26)
0.33 (25–26)
0.28 (25–26)
0.22 (25–26)
2 0.34
(31–32)
0.31 (31–32)
0.26 (31–32)
0.20 (31–32)
3 0.32
(38–39)
0.28 (38–39)
0.24 (38–39)
0.19 (38–39)
4 0.26
(55–56)
0.23 (55–56)
0.20 (55–56)
0.15 (55–56)
family of simple growth models (Eq.1) and global diameter unique growth model using (Eq. 2); 1 – SI50 > 9.3 m, 2 – SI50 > 7.2 and
≤ 9.3 m, 3 – SI50 > 5.1 and ≤ 7.2 m, IV – SI50 ≤ 5.1 m, DOM – dominant, COD – co-dominant, INT – intermediate, SUP – supressed c
bt n a =
DBH (1 ( ))
– –
0 10 20 30 40 50 60 70 80
0 10 20 30 40 50 60 70 80
0 50 100 150 200 250
DBH
(c
m)
0 50 100 150 200 250
Age (yr) Crown classes of the trees
dominant
co-dominant
intermediate
supressed
I II
II
I IV
(a) (b)
[image:7.595.66.532.494.728.2]a landscape level and the plot correlation should therefore be small. Thus, we assume that the spa-tial correlation did not significantly occur in the adjusted models (Zhao et al. 2004).
Family of simple traditional equations or global unique models?
During the last years, growth models with a high number of independent variables were pro-posed in the forest science (Lessard et al. 2001; Weiskittel et al. 2007), considering factors re-lated to stand and tree levels (e.g. site quality of the stands or tree crown class of the trees). One successful example was the evolution of the pro-posals for height growth models used for site quality estimation. Most of these proposals were based on Richards (1959), where the age of the trees defines height, but each stand type needs one equation for dominant trees. Ek (1971) pro-posed a modified equation where independent
[image:8.595.65.416.53.460.2]variables included age and site index, which sim-plified the use of this kind of equations. This last proposal defined a model which can be used in a wide range of stand conditions. After that, other authors (Payandeh, Wang 1994; Wang, Payan-deh 1994) proposed modifications to increase the accuracy of these estimations. This last method-ology was successfully applied in Southern Pata-gonian forests, e.g. in N. antarctica (Ivancich et al. 2011) and N. pumilio (Martínez Pastur et al. 1997). Also, global models based on these proposals were applied in volume models for N. antarctica (Lencinas et al. 2002), and tree diameter (Martínez Pastur et al. 2005) and volume stand growth (Martínez Pastur et al. 2008) for N. pumilio forests. The major advantage in the use of global unique equation is the simplic-ity of the use under a wide range of stand condi-tions. According to these results, it was possible to simplify the diameter growth model estimation using a unique global equation instead a family of simple equations.
Fig. 4. Auto-validation anal-yses for the family of growth models using Eq.1 (a) and global diameter growth model using Eq.2 (b), clas-sifi ed by stand site quality (I – SI50 > 9.3 m, II – SI50 > 7.2 and ≤ 9.3 m, III – SI50 > 5.1 and ≤ 7.2 m, IV – SI50 ≤ 5.1 m) and tree age (yr). EME – estimation mean error (cm and %) and AME – absolute mean error (cm and %)
Site quality
A
ME (%)
A
ME (
cm)
E
ME (%)
E
ME (
cm)
Th e infl uence of simplifi cation over the accuracy of models
The accuracy of models in forestry is related to the forest structure variability, being higher in natural forests without silvicultural manage-ment (Zeide 1978). In our study, the adjustmanage-ments were comparable to those found in the literature, e.g. Subedi and Sharma (2011), who presented diametric models for Picea mariana and Pinus banksiana, obtained R² between 69% and 76%, and Lhotka and Loewenstein (2011) proposed global models for several Quercus species with R² between 40% and 57%. Our family of simple growth models (Eq. 1) showed higher variability in their R²-adj, explained between 54% and 92% in each model. The global growth model (Eq. 2) in-cluded more variables and presented similar accu-racy to the better equations of the simple growth models family. According to our results, the uni-fication of a family of simple growth models into a unique global equation did not have a greater influence on the accuracy of the estimation.
Biological response of the models
Th e Richards model is a widely-used and fl ex-ible sigmoid function for growth modelling which has been extensively used in several forest spe-cies around the world (Zeide 1993). However, this fl exibility increases the risk to reduce the biologi-cal response of the adjusted models (e.g. with the Richards models it is possible to obtain from a sig-moid curve to a straight line). Th e family of simple growth models introduced several inconsistencies among the models and across the studied gradients (e.g. site quality of the stands and crown class of the trees). Th e global model was fi tted with the en-tire data base, avoiding these inconsistencies and increasing the biological response of the model. Another inconsistency was observed in the MADI determination and age occurrence, where MADI must have occurred before in better growing con-ditions (Klepac 1976), as was described for the Nothofagus species before (Peri, Martínez Pas-tur 1996; Martínez PasPas-tur, Fernández 1997; Ivancich et al. 2011). Th e global unique model presented better performance in the Madi estima-tion than the family of simple tradiestima-tional growth models. According to our results, the use of a glob-al equation positively infl uenced the biologicglob-al re-sponse compared to the use of a family of simple traditional growth models.
CONCLUSIONS
Global growth unique models constitute a sim-ple tool to support decision taking in forest man-agement compared to the application of a fam-ily of simple equations. The use of global unique growth models: (i) simplifies the calculation of tree growth, (ii) does not greatly influence the ac-curacy of the global estimation, and (iii) positively influences the biological response of the models. The proposal of global unique models with great-er complexity and highgreat-er numbgreat-er of independent variables allows researchers to better explain tree growth in general environmental conditions, but maintaining the rationality within the entire data base.
R e f e r e n c e s
Adame P., Hynynen J., Cañellas I., Del Río M. (2008): Individual-tree diameter growth model for rebollo oak (Quercus pyrenaica Willd.) coppices. Forest, Ecology and Management, 255: 1011–1022.
Bitterlich W. (1984): The Relascope Idea. London, Com-monwealth Agricultural Bureaux: 242.
Cochran W. (1977): Técnicas de muestreo. [Sampling Techniques.] Ciudad de México, Editorial Continental: 513. Crecente-Campo F., Soares P., Tomé M.,
Diéguez-Aran-da U. (2010): Modelling annual individual-tree growth and mortality of Scots pine with data obtained at irregular measurement intervals and containing missing observa-tions. Forest, Ecology and Management, 260: 1695–1974. Derose R.J., Seymour R.S. (2009): The effect of site quality
on growth efficiency of upper crown class Picea rubens and Abies balsamea in Maine, USA. Canadian Journal of Forest Research, 39: 777–784.
Donoso Z.C. (2006): Las especies arbóreas de los bosques Templados de Chile y Argentina. [Tree Species of Tem-perate Forests of Chile and Argentina.] Valdivia, Marisa Cuneo: 678.
Ek A. (1971): A formula for white spruce site index curves. University of Wisconsin Forestry Research Note, 161: 2. Everard J., Christie J.M. (1995): Sweet chestnut: silvi-culture, timber quality and yield in the forest of Dean. Forestry, 68: 133–144.
Fekedulegn D., Mac Siurtain M.P., Colbert J.J. (1999): Parameter estimation of nonlinear growth models in forestry. Silva Fennica, 33: 327–336.
García O. (1988): Growth modelling – a (re)view. New Journal of Zealand Forestry, 33: 14–17.
Ivancich H., Soler Esteban R., Martínez Pastur G., Peri P.L. Bahamonde H. (2009): Índice de densidad de rodal aplicado al manejo silvopastoril en bosques de ñire (Nothofagus antarctica) en Patagonia sur. [Stand density index for silvopastoral management in antarctic beech (Nothofagus antarctica) forests of southern Patagonia.] In: Proceedings of Primer Congreso Nacional de Sistemas Silvopastoriles. Posadas, 14.–16. May 2009. Buenos Aires, INTA: 245–250.
Ivancich H., Martínez Pastur G., Peri P.L. (2011): Mod-elos forzados y n o forzados para el cálculo del índice de sitio en bosques de Nothofagus antarctica en Patagonia. [Constrained and non-constrained models for site index estimation in Nothofagus antarctica forests of Southern Patagonia.] Revista Bosque, 32: 135–145.
Kariuki M., Rolfe M., Smith R., Vanclay J.K., Kooyman R.M. (2006): Diameter growth performance varies with spe-cies functional-group and habitat characteristics in subtropi-cal rainforests. Forest, Ecology and Management, 225: 1–14. Khamis A., Zuhaimy I., Khalid H. (2005): Nonlinear growth
models for modeling oil palm yield growth. Journal of Math-ematics and Statistics, 1: 225–233.
Klepac D. (1976): Crecimiento e incremento de árboles y masas forestales. [Growth and Increment of Trees and Forests.] Ciudad de México, Universidad Autónoma de Chapingo: 367.
Koak A. (1997): Eff ects of multicollinearity and autocorrela-tion on the variable-exponent taper funcautocorrela-tions. Canadian Journal of Forest Research, 27: 619–629.
Lei Y.C., Zhang S.Y. (2004): Features and partial derivatives if Bertalanff y-Richards growth model in forestry. Non-linear Analysis: Modelling and Control, 9: 65–73.
Lencinas M.V., Martínez Pastur G., Cellini J.M., Vukasovic R., Peri P.L., Fernández C. (2002): Incor-poración de la altura dominante y la calidad de sitio a ec-uaciones estándar de volumen para Nothofagus antarctica (Forster f.) Oersted. [Incorporation of dominant height and site class in standard volume models for Nothofagus antarctica (Forster f.) Oersted.] Revista Bosque, 23: 5–17. Lessard V.C., Mcroberts R.E., Holdway M.R. (2001):
Diameter growth models using Minnesota forest inventory and analysis data. Forest Science, 47: 301–310.
Lhotka J.M., Loewenstein E.F. (2011): An individual-tree diameter growth model for managed uneven-aged oak-shortleaf pine stand in the Ozark Highlands of Missouri, USA. Forest, Ecology and Management, 261: 770–778. Martínez Pastur G., Fernández C. (1997): Crecimiento
di-amétrico de Nothofagus antarctica en Tierra del Fuego para diferentes sitios y status de competición. [Diameter growth of Nothofagus antarctica in Tierra del Fuego for diff erent site quality and crown classes.] Interciencia, 22: 87–91. Martínez Pastur G., Peri P.L., Vukasovic R., Vaccaro S.,
Piriz Carrillo V. (1997): Site index equation for Nothofagus pumilio forests. Phyton, 6: 55–60.
Martinez Pastur G., Cellini J.M., Peri P.L., Capiel I. (2005): Ecuación estándar de crecimiento diamétrico individual para árboles de Nothofagus pumilio. [Standard equation of indi-vidual diameter growth for Nothofagus pumilio trees.] Revista de la Asociación Forestal Argentina, 59: 17–24.
Martínez Pastur G., Cellini J.M., Lencinas M.V., Peri P.L. (2008): Stand growth model using volume increment/ basal area ratios. Journal of Forest Science, 54: 102–108. Payandeh B., Wang Y. (1994): Modified site index
equa-tions for major Canadian timber species. Forest, Ecology and Management, 64: 97–101.
Peri P.L., Martínez Pastur G. (1996): Crecimiento dia-métrico de Nothofagus pumilio para dos condiciones de copa en un sitio de calidad media en Santa Cruz, Argen-tina. [Diameter growth of Nothofagus pumilio for two crown classes at a middle site quality stand in Santa Cruz, Argentina.] Investigación Agraria: Sistemas y Recursos Forestales, 5: 201–212.
Peri P.L., Gargaglione V., Martínez Pastur G., Lenci-nas M.V. (2010): Carbon accumulation along a stand development sequence of Nothofagus antarctica forests across a gradient in site quality in Southern Patagonia. Forest, Ecology and Management, 260: 229–237. Piterbarg R. (1965): Inventario y ordenación de un bosque
de lenga (Nothofagus pumilio) en Tierra del Fuego, y prim-eros resultados de su explotación. [Forest ordination and inventory of lenga (Nothofagus pumilio) forest at Tierra del Fuego, and first outputs of their harvesting.] Revista Forestal Argentina, 9: 105–113.
Pretzsch H. (2009): Forest Dynamics, Growth and Yield: from Measurement to Model. Berlin, Springer: 664. Ramírez C., Correa M., Figueroa H., San Martin J.
(1985): Variación del hábito y hábitat de Nothofagus an-tarctica en el sur de Chile. [Habitat variation and habitat of Nothofagus antarctica at the Southern Chile.] Revista Bosque, 6: 55–73.
Rayner M. (1991): Site index and dominant height curves for re-growth karri (Eucalyptus diversicolor F. Muell.) in south-western Australia. Forest, Ecology and Manage-ment, 44: 261–283.
Richards J.F. (1959): A flexible growth functions for em-pirical use. Journal of Experimental Botany, 10: 290–300. Subedi N., Sharma M. (2011): Individual-tree diameter growth models for black spruce and jack pine plantations in northern Ontario. Forest, Ecology and Management, 261: 2140–2148. Trasobares A., Tomé M., Miina J. (2004): Growth and
yield model for Pinus halepensis Mill. in Catalonia, North-East Spain. Forest, Ecology and Management, 203: 49–62. Vanclay J. (1991): Aggregating tree species to develop
diameter increment equations for tropical rainforests. Forest, Ecology and Management, 42: 143–168.
Vanclay J. (1995): Growth models for tropical forests: A synthesis of models and methods. Forest Science, 41: 7–42.
Vanclay J. (2010): Robust relationships for simple planta-tion growth models based on sparse data. Forest, Ecology and Management, 259: 1050–1054.
Wang Y., Payandeh B. (1994): A bi-segmental curve fitting approach to improve the accuracy of site index equations. Forest, Ecology and Management, 67: 35–38.
Weiskittel A.R., Garber S.M., Johnson G.P., Maguire D.A., Monserud R.A. (2007): Annualized diameter and height growth equations for Pacific Northwest
plantation-grown Douglas-fir, western hemlock, and red alder. For-est, Ecology and Management, 250: 266–278.
Zeide B. (1978): Standardization of growth curves. Forestry,
76: 289–292.
Zeide B. (1993): Analysis of growth equations. Forest Sci-ence, 39: 594–616.
Zhao D., Borders B., Wilson M. (2004): Individual tree diameter growth and mortality models for bottomland mixed-species hardwood stands in the lower Mississippi alluvial valley. Forest, Ecology and Management, 199: 307–322.
Received for publication February 21, 2014 Accepted after corrections June 12, 2014
Corresponding author: