The economy of the Democratic Republic of the Congo – a nation endowed with a vast potential wealth – is slowly recovering from the decades of decline. A systemic corruption since the independence in 1960 and the conflict that began in May 1997 has dramati-cally reduced the national output and the government revenue, increased the external debt, and resulted in the deaths of more than 5 million people from the violence, famine, and disease (CIA Factbook).
1960–1965: Political chaos and economic disrup-tion. This period witnessed a decline in the output because of the disruption in the transport network and the departure of many foreign entrepreneurs following the political turmoil, the civil strife, and the failed secession of the Katanga Province. The real GDP declined by about 4% between 1960 and 1965.
1966–1974: Stability and growth. This period was characterized by an increased involvement of the state in the productive sectors of the economy. Thanks to the La Politique des Grands Travaux1, the public investment quadrupled. In 1971, the first Mobutu plan (Plan Décennal 1971–80) was launched, which aimed at rising the real GDP growth rate to about 7% per year. Against this backdrop, in 1973–1974 the
government took steps toward the nationalization of all small, medium-sized, and large foreign enterprises.
Increasing the state control of the economy was accompanied by an impressive economic expansion, with the real GDP growing at an average annual rate of 5.1% during 1966–1974. However, following the adverse terms of the trade shocks caused by both the reversal in copper prices and the oil crisis of 1973, the centralized economy, unable to adjust, soon revealed its severe limitations.
1975–1982: Economic recession and debt crisis.
The ill-advised economic policies and public invest-ments of the early 1970s precipitated a debt crisis with a damaging impact on the economic activity. In 1975, the country stopped servicing its debt and requested an IMF-supported program for the first time to help extricating the DRC from its economic crisis. Because of the overall downturn, the pub-lic investment program was grounded, the capital invested in the “white elephants” was lost, and the maintenance of the infrastructure and productive capital was neglected or postponed indefinitely. As a result, the economic activity experienced a severe decline, compounded by the invasions of the Shaba
The least developed countries – the case of the Congo
D.R.
Vladimír JENÍČEK, Šárka GRÓFOVÁ
Faculty of International Relation, University of Economics, Prague, Czech Republic
Abstract: Th e article is focused on food problem in the least developed countries, on the chosen areas where the overall situation is the most problematic. It deals with the Democratic Republic of the Congo, belonging to the low income food defi cit countries with one of the world’s lowest rates of the gross domestic product per capita. Th e paper defi nes the food security situation in a global connection, representing a wide complex of economic, social, demographic, technologic and political aspects of production, distribution, shift and consumption of foodstuff s. Despite some progresses in the political situation, the eff ects of the economic crisis and the widespread food insecurity are expected to persist. Te humanitarian assistance is now needed to support the needs of the most vulnerable. In the longer term, the countries have the signifi cant goal of consolidating peace and security and strengthening the overall governance, while at the same time reconstructing and rehabilitating their economy.
Key words: agriculture, confl ict, economic growth, food security, poverty
1La Politique des Grands Travaux was an ambitious plan for the economic development aimed at implementing
pres-tigious and large-scale projects.
Province (the heart of the mining activities) in 1977 and 1978. Altogether, the real GDP fell by 12%.
1983–1989: Adjustment supported by the IMF and the stop-and-go policies. To improve the eco-nomic and financial situation, and to eliminate the significant distortions that had grown in the preced-ing period, the government started to implement in September 1983 a strong stabilization and liberaliza-tion program. This strategy had a positive impact as the real GDP, which had declined by 2.2% in 1982, recovered with an average annual growth rate of 2.6% during the period, 1984–1986.
In 1987, with the support of the IMF and the WB, the government launched a structural adjustment program aimed at establishing the basis for the long-term economic growth and a sustainable external financial position. The program also benefited from the improved terms of trade, mostly reflecting a strong upturn in the copper prices beginning in early 1987. However, with the more favourable external environment, the government all but ceased its ad-justment efforts. As a result, the country’s financial performance deteriorated markedly. The annual real GDP growth decelerated to 0.5% in average during the period 1987–1989.
1990–2000: Hyperinflation and collapse of the economic and political system. In the midst of the failed attempts at the political liberalization, the control over economic policies was lost, and the country fell into the grip of an unprecedented circle of hyperinflation, currency depreciation, increasing dollarization and financial disintermediation, declin-ing savdeclin-ings, deterioratdeclin-ing economic infrastructure, and a broad-based output decline. The alarming economic and social situation was compounded by the full-fledged war that broke out on August 2, 1998.
In this context, a large part of the country’s capital stock was destroyed, and the investment was discour-aged. As a result, the real GDP contracted cumulatively by some 43% during the decade, and the per capita real GDP plummeted from US$224 in 1990 to US$85 (23 cents a day) in 2000. Over the same period, con-sumer prices rose at an annual average rate of 684%. The government revenue fell by 80%, and the external debt rose to about 300% of the GDP (or almost US$13 billion) (Akiboto and Cinyabuguma 2004).
2000–2010: Output recovery. Since the end of the civil conflict in 2000, the Republic of the Congo has taken important steps towards consolidating the peace and rebuilding the state.A new Constitution was adopted in 2002,legislative elections were held
in 2002 and 2007 and presidential elections in 2002 and 2009, which sawthe re-election of Denis Sassou Nguesso. All political parties have renounced violence, accepted allelection results since the end of the war, and are pursuing their agenda for social change through theParliament and decentralized legislative bodies. Almost all key political leaders exiled during the periodof conflict have returned to Congo and are participating in the reconciliation process. The disarmamentof the last remaining rebel group has been completed, and the social and economic rein-tegration of therebels in their communities started in 2009) (Congo Employment … 2011).
The global recession cut the economic growth in 2009 to less than one half its 2008 level, but the growth returned to 6–7% in 2010–2011. The DRC signed a Poverty Reduction and Growth Facility with the IMF in 2009 and received $12 billion in the multilateral and bi-lateral debt relief in 2010 (CIA Factbook). Strengthened macroeconomic policies, in the context of a steadily improving security situation, have contributed to the improved economic performance. The consumer price inflation decelerated significantly, helped by a more reliable supply line from Pointe-Noire to Brazzaville. The inflation, which averaged 7% in the late 1990s, decreased to an average of 3.2% between 2000 and 2010 (Akitoby and Cinyabuguma 2004).
Aimed at the GDP composition, the country’s economy is dominated by the agriculture and for-estry sector, creating 30% of the GDP in 2009, as is illustrated by Figure 1.
Extractive industries. The DRC is endowed with exceptional mineral resources; it contains some of the Africa’s largest deposits of copper, cobalt, and
GDP per capita (USD constant 2000) GDP growth (%)
400
350
300
250
200
150
100
50
0
25 20
15 10 5
0 –5
–10 –15 –20
[image:2.595.306.533.548.723.2]1963 1967 1971 1975 1979 1983 1987 1991 1995 1999 2003 2007 2009
Figure 1. Real GDP growth and per capita GDP
coltan (80% of the world’s deposits) and significant reserves of gold, diamonds, cadmium, zinc, cassiter-ite, magnesium, and other minerals. In the past, the DRC has been unable to harness its mineral wealth for economic development, due largely to the corrupt management and political interference in the para-statal mining companies, and to the inappropriate policies that limited the private sector investment. The economy remains dominated by oil. Since the start of the oil exploitation in the late 1950s, the once diversified economy with large services and manufacturing sectors has experienced a structural change and is now dominated by the oil sector. In 2010, the oil production and exports contributed 85% to exports and 79% to the government revenues. The oil dependency makes the country vulnerable to economic shocks. Furthermore, a possible decline in the oil reserves necessitates the diversification away from oil (Congo Employment … 2011).
Agriculture and forestry. Combined with forestry, animal husbandry, and fishing, agriculture provides a direct employment to more than 50% of the labour force and accounts in average for about 30% of the real GDP. The sector has been experiencing problems of various kinds, in particular with the market ac-cess, moving products from the field, conservation, and the production of quality seeds. Agriculture has an untapped potential as a source of the economic growth, the export diversification, and the gainful employment (Akitoby and Cinyabuguma 2004).
The forestry sector represents one of the major resources for the economy; it is an important em-ployer and produces the only other significant export commodity. Forestry products, which accounted for
2.4% of the GDP in 2008, but only 1.2% of the GDP in 2010, mainly due to the effect of the global finan-cial crisis, are the country’s second-largest export commodity, accounting in average for 6.5% of the total goods exports between 2000 and 2010 (Congo Employment … 2011).
Transport and communication. The transport sector accounted in average for about 5% of the real GDP. Given the large size of the country, its limited access to the sea, and the remoteness of its mineral deposits, the transport network is of a vital impor-tance to the present and future economic activity. However, the sector’s performance remains less than satisfactory and the difficulties in transportation constitute a major obstacle to the realization of the DRC’s agro-industrial and mining potential. In the late 1990s, the civil war took a toll on the trans-port sector and the infrastructure collapsed. As a result, farmers have a great difficulty in selling any surplus, while the food prices in urban centres are high. Interregional connections are often limited to the minimal air transport; as a result the country has essentially broken down into a set of economic enclaves (Akitoby and Cinyabuguma 2004).
The construction and public works. The activ-ity is benefiting from the ending of the conflict, as the local businesses and the government undertook reconstruction works. The activity in the sector has boomed since 2005, with the government using part of the oil revenue windfall to improve the country’s dilapidated infrastructure. There are now large pro-jects in the energy, transport and housing sectors under way, and the activity in the sector is expected to remain buoyant in the coming years, as the gov-ernment continues to increase the capital spending (Congo Employment … 2011.
Wholesale and retail trade. The contribution of the domestic commerce sector (wholesale and retail trade) to the GDP during both the two years has been supported by the growing small business activity all around the country, although with a critical share of the informal sector. It could also be explained, as well as the one for the agriculture, by the improv-ing traffic of goods and services as the result of the implementation of infrastructure works including the feeder roads (Mushobekwa 2010).
Food security
Food security refers to the food supply as well as to the demand for food products. While the food supply
Transport and communication
5%
Construction and public works
19%
Agriculture and forestry
30%
Extractive industries
9% Wholesale and
retail trade 24% Others
[image:3.595.64.275.563.720.2]13%
Figure 2. Distribution of GDP by main sector in 2009
is mostly a function of the local food production and food imports, the demand for food products depends on the number of people and their purchasing power. The access to food is determined by the latter factor through income. Therefore, the generalized poverty of the population is a serious impediment to the food consumption (Figure 2).
History of food production
In 1908 the Belgian government annexed the Congo; not until 1960 was the Congo granted independence. Over those 52 years, the Congo developed into a source for rice (produced for the East Asian market), manioc for tapioca, peanuts, palm oil, cotton and bananas. In 1954 Belgian colonial administrators implemented a system of cooperative farming called paysannats. “The policy was to concentrate on crops yielding high cash returns in order improve the standard of living of the farmers” (Hesse 2007).
At independence, the country had achieved the net self-sufficiency in food, partly through the use of the taxation schemes and the forced growing programs in the 1950s, and the cash crops earned 40% of the total foreign exchange. Following the independence, the political instability and the flight of experienced technicians caused a rapid fall in the production and private investments in agriculture. Contributing fur-ther to the decline were the mismanagement and the failure by the government to invest in the transporta-tion, the agricultural extension, and the communi-cation networks needed to support the agricultural sector. The place of agricultural exports in the overall economy decreased sharply in the first five years of independence; over time, the capacity of citizens to feed their families in the face of a growing urban population was becoming increasingly problematic. The development of agriculture and the achieve-ment of self-sufficiency in the food supply were the “priority of priorities” of the Mobutu government from the mid-1970s. However, the program called Zairianization2 further aggravated the situation. In November 1973, the government, concerned over the failing production, announced it was national-izing those agricultural operations with the annual revenues of more than 1 million zaires ($2 million). More than 100 farms and plantations were affected. In less than two years, the Zairianization was a
com-plete failure and was reversed. The failure was attrib-uted to several factors. The Congolese who received the Zairianized properties were generally politically well-connected individuals who knew little about farming. They came to be known as the acquéreurs. The departure of experienced managers led to the disruption of the marketing system. The acquéreurs
tended to view their new property merely as a source of revenue and did not invest in its maintenance and the long-term growth.
The production continued to decline, and in De-cember 1974, the government announced the policy of the Retrocession, whereby 40% foreign partici-pation would be allowed in the large operations, but smaller plantations would be reserved for the Congolese. The lack of response to these measures led the government a few years later to allow up to 60% private ownership in the sector. The govern-ment announced the Agricultural Recovery Plan of 1979–1980 in mid-1977 as the result of the continued stagnation of agriculture.
In 1983, the government implemented a series of measures to encourage the Congolese to invest in farming. Price controls on food products were eased and the foreign currency disbursement by the Central Bank for the imported food was severely restricted. The government also instituted programs to increase the production of rice, manioc, vegetables, and meat, and launched projects to improve roads and bridges, particularly in the Western Congo, in order to improve the farm-to-market networks. As a result, Congo produced 50 000 tons of wheat in 1985, according to the government figures, or roughly one half of the total demand, and 1.5 million head of cattle or three fourths of the demand. The government announced that production has returned to the pre-independence levels. However, the population growth continued to outpace the production gains and a severe setback in the early 1990s, brought on by the inflation and the shortages of fuel and spare parts, caused the per capita production in agriculture to decline (Figure 3) (Kisangani and Bobb 2010).
During the 1990s, the economy and the political system continued to deteriorate, with this decade marked by two large lootings (“pillages”) in the capital (1991 and 1993), the hyperinflation, and the eventual overthrow of President Mobutu Sese Seko by Laurent Kabila in 1997. The overthrow of Mobutu, who had been in power for over three decades, marked the
collapse of a corrupt economic and political system. President Laurent Kabila was assassinated in 2000 and replaced by his son, Joseph. Since 2001, the Congolese economy has stabilized macro-economically, due to the decline of the 1998 war, the liberalization of the economy, and the implementation of the GoDRC EIP (Enhanced Interim Program) in 2001–2002.
The macroeconomic stabilization measures were fol-lowed by the HIPC (Heavily Indebted Poor Countries) debt relief initiative in 2003, which began the process for the debt relief. The war formally ended in 2003. However, there were many worrying economic signs in the wake of the DRC’s celebration of its 50th year of independence in June 2010. These included the continuing levels of conflict in the East, particularly in the North Kivu, parts of the South Kivu, and in the North-East Orientale, with the resulting popula-tion displacements, and the agricultural underper-formance. The per capita food production declined steadily by 2.3 % in the late 1970s, 0.7% in the early 1980s, 1.2% in the early 1990s and less than 1% in the early 2000s. As a result, food exports also declined by 5.8% in the early 1980s and by 7.6% from 1985 to 1993. By 2006, the DRC’s food exports had declined to represent only 0.2% of the total exports (DRC 2010).
Food production today
Three climatic regions lie within Congo: the equato-rial region where the oil palm, coffee, cocoa, bananas and rice are grown; the tropical region of wooded savannahs where the cotton, peanuts, and manioc are grown; and the high plains where the potatoes, leeks and Arabica coffee are grown and the livestock are raised (Kisangani and Bobb 2010).
Since the colonial times, two types of agriculture production systems have coexisted in the DRC: the traditional agriculture and the modern agriculture.
In addition, a new type of production which might be called the “group agriculture” has appeared in the recent decades. The traditional agriculture primarily focuses on food crops, and accounts for over 80% of the country’s production. Almost all farms are small-scale (less than one hectare) and fall under the traditional agriculture characterization. The modern agriculture began in the colonial times; it is based on modern means of production. This type of agri-culture is limited in the DRC, and it mainly includes the large agribusiness companies that operate large areas with high yields. The modern agriculture is most commonly used for export crops. The “group agriculture” involves group farming supported by the cooperatives (and, in some cases, religious or-ganizations). This type of agriculture arose from a long-standing absence or ineffectiveness of national rural development services that favour labourers.
[image:5.595.71.338.98.238.2]In the view of the land tenure systems, the land for food crop agriculture in the DRC is mostly al-located via the traditional systems through the vil-lage chiefs. Soil fertility depends on the population density, among other factors; in the areas where the population pressure is too high, the fallow periods are disrespected and soil fertility cannot be maintained. These areas would benefit if the land tenure system was changed, and the farmers owned the land, so that they will invest in organic or inorganic fertilizers, nitrogen-fixing crops, and other improved methods. Soil fertility is less of a problem in the North and South Kivu, where the rich volcanic soil permits a more or less continuous cultivation, despite these areas’ high population density. The average farm size varies across the country, with the North and South Kivu having the smallest farm size per household, mostly due to these areas’ high agricultural produc-tivity and the high population density. In the areas where land is available, the unused sections are left fallow or planted with cash crops (DRC 2010).
Figure 3. Total and per capita food pro-duction index (2004–2006 = 100)
Source: FAOSTAT 240
220 200 180 160 140 120 100 80 60 40 20 0
1961 1963 1965 1967 1969 1971 1973 1975 1977 1979 1981 1983 1985 1987 1989 1991 1993 1995 1997 1997 2001 2003 2005 2007 2009
Figure 4 presents the production of the most im-portant food and agricultural commodities (cho-sen by the highest export value – 1000$ in 2010). Cassava, the first most important crop in the view of the production export value and also production in million tons is not included in the graph for a bet-ter lucidity. According to the FAOSTAT, the annual production of cassava, the economic and dietary staple of the Congolese farmers, was 15.049 million MT in 2010, compared to 18.715 million MT in 1990. From Figure 4, it is evident that the production of plantations has decreased – from 2.26 million MT in 1994 to 1.35 million MT in 1996.
Cassava (manioc) is cultivated throughout the coun-try. Four provinces account for almost two-thirds (64%) of the national cassava production: Bandundu, Katanga, Orientale and Equateur. Traditionally inter-cropped with maize, groundnuts and rice using low-quality cuttings, cassava offers numerous advantages to the smallholder: productive even in poor soils, low labour requirements, drought tolerance, a flexible harvesting period throughout the year, storage in the ground (which deters theft), the deterrence to pests and the consumption of both roots and leaves. There are two main types of cassava: bitter and sweet, and although the bitter cassava possesses a much greater risk of the cyanide poisoning (konzo), the bitter cas-sava is preferred by producers because of the higher resistance to pests and the preferred qualities for producing the fufu and chikwangue. The production can only meet one half of the country’s estimated national need of 30 million MT.
Plantains and other bananas are grown across the country, but the banana production is the highest in the Orientale, North Kivu, Equateur, South Kivu and Bas-Congo. Plantains account for about one half of
the banana production, with beer bananas and sweet bananas accounting for the other half. The banana beer
(kasikisi) production is an important income source
in the North Kivu. Bananas are a dietary staple in very specific areas, particularly in the tropical forest. Banana fields, and the food security of farming com-munities that rely on them, are severely threatened by mainly the Banana Xanthomonas Wilt (BXW) and also the Banana Bunchy Top Disease (BBTD).
Most maize is produced in the Katanga, Bandundu, the Kasais, Equateur and Orientale. Maize is also imported from Zambia and Uganda. The seed qual-ity is poor except for the communities and producer groups that have received the improved seed from international organizations. Maize is often consumed as flour. The preparation of maize-based beverages
musululu and kanyanga provides income for poor
households.
[image:6.595.67.339.97.262.2]The rain-fed rice cultivation is concentrated in the forested areas of Northern and Central DRC, most notably the Orientale, Maniema, Equateur and Northern Kasai Oriental. To meet the growing urban demand, irrigated rice production is increasingly practiced around the urban areas, including Kinshasa. In Maniema and Sankuru (in Kasai Oriental), rice is a staple food; elsewhere it is only commonly consumed in urban areas. Rice is imported from the United States and Asia mainly, so there is an unmet demand, if the locally produced rice can be competitive with imports. Groundnuts constitute about two-thirds (64%) of the legume production, with the other third attributed to beans, cowpeas and soybeans. The Bandundu, Orientale, Katanga and Kasai Oriental are the main producers of groundnuts. Beans are most important to the North Kivu and South Kivu. Cowpeas and soybeans are grown throughout the country. Palm Figure 4. National agricultural production (MT)
Source: FAOSTAT
1 Plantains 2 Maize
3 Groundnuts, with shell 4 Rice, paddy
5 Bananas
6 Vegetables fresh nes
7 Mangoes, mangosteens, guavas 8 Game meat
9 Meat nes 1
2
3
5 6 7 8 9
4 2 500 000
2 000 000
1 500 000
1 000 000
500 000
0
oil production is greatest in the Bandundu, Equateur, Orientale and Kasai Occidental. Most palm trees are kept for the cooking oil consumption. Sugar cane is produced in the largest quantities in the Bas-Congo, Kivu and Orientale. Most of it is produced for the home consumption or the preparation of beer, and for the industrial production of cane sugar.
Horticultural production is especially promising in the urban and peri-urban areas where the cultivation is practiced (e.g., the peri-urban Kinshasa), and in the proximity to waterways that enable irrigation. Fruit production is mostly done at the level of the households (USAID 2010).
A special part of food production represents the food of animal origin. According to the FAOSTAT, the game meat constitutes a significant source of the food production export value (with almost 240 million $, the third highest value after cassava – 1 556 million $; and plantains – 260 million $ in 2010).
The causes of food insecurity
The DRC is still recovering from the years of war and political troubles, and the country is still facing huge humanitarian challenges. The people continue to live in the crisis condition in many parts of the DRC. The estimated 4.5 million people are in the food and livelihood crises. The DRC, according to the International Food Policy Research Institute, is among the four countries in the world where the food situation is described as being “extremely alarming”. The causes of this high level of food insecurity in-clude the population displacements associated with the insecurity, the lack of access to the basic social services such as the water and health services, a low agricultural productivity, the lack of the roads infrastructure and the chronic poverty. The Eastern regions are still plagued with violence, with the ci-vilians targeted by the marauding armed groups. The people have to flee from one place to another desperately trying to escape the harassment from dif-ferent militia. They are still suffering from rape, the looting of goods, food and crops, the abduction and all kind of the physical and psychological harassment. This unrest and displacement threatens not just their immediate physical safety, but also the food security of the whole communities, as it disrupts the normal harvesting activities. At the end 2011, more than 1.7 million people were displaced, according to the OCHA. In early 2012, new mass displacements have
taken place in the North and South Kivu and in the North Katanga. The Western part of the country is also quite unstable, with political tensions and the inter-ethnic conflicts mostly over the land dispute. People are living in the extreme poverty with a little support from the state (WFP 2012).
Relationships between the causes of food insecurity
Food insecurity in the DRC follows a circular cause-and-effect pattern of a very low and shrinking food production levels and the extreme and rising poverty. The decade-long downward trend of this spiral results from the effects of the mismanagement, war and the continuing insecurity, and the lack of access to the land and markets.
Food insecurity is a situation in which people are at the risk of not having an adequate physical, social or economic access to sufficient food that is both safe and meets their dietary needs and food prefer-ences for an active and healthy life. Moreover, it is the product of political structures, institutions and processes. Structures, institutions, organizations and processes, or the wider governance environment that regulates the household’s access to and the use of as-sets, define their livelihood strategies. When looking at the interaction between the food insecurity and the conflict, this is an important aspect to consider. In complex political emergencies (COPE), violence not only influences the availability of resources and the possible options and choices of households; it also has an impact on the existing institutional context through which the households negotiate the use of assets and the configuration of livelihoods strategies.
Ensuring food security for all involves not just en-suring the availability of the adequate food in total, but that all people have the access, at all times, to safe, nutritious food. Reducing poverty is a key ele-ment in the policy for food security, because poor people spend such a large share of their incomes on food, leaving them vulnerable to high food prices, and many poor people obtain much of their income from farming, leaving them vulnerable to the declines in agricultural output.
food insecurity and conflict. Conflicts tend to modify the institutional framework regulating the land ac-cess through the introduction of new mechanisms of protection and acquisition, and new strategies of the economic control. Moreover, the land tenure insecurity, because of the contestable property rights or the potential confiscation, also contributes to the increased risk exposure of the households making it also a determinant of food insecurity.
A second important mediating structure in the relation to food security is the market. Conflicts, the overall insecurity and the altered mechanisms of protection also change the rules of the game of the market. These changes seriously affect rural households of whom many engage in agriculture which implies that they are both producers and con-sumers. In several regions, the main problem is not the food availability but rather the lack of market opportunities, caused by the insecurity, the lack of roads, shifts in the food prices, the lack of cash, etc. Against this reality, there stands the fact that most food security interventions still tend to focus on the food availability rather than the access to food and markets (Vlassenroot 2003).
Poverty and inequality
According to the Poverty Reduction Strategy Paper 2007 (IMF 2007), 71% of the population lives below the poverty line; this is an extremely high figure also in comparison to other central African countries. The same holds true as regards the depth (32%) and severity (18%) of poverty3. The incidence of poverty is greater in rural areas (76%) than in urban areas (61%). The same phenomenon occurs in respect of the depth and severity of poverty. People living in urban areas thus are better off than those living in rural areas. The same pattern may be observed with regard to the vulnerability to poverty. This evidence tends to favour urban migration in the DRC.
The incidence of poverty is the highest in the prov-inces of the Equateur, Bandundu, and South Kivu (85% or more). As opposite, the city/province of Kinshasa
(42%) is the least poor in the country. Self-employed workers and apprentices are the poorest. The least poor is the management and collaborative personnel. The most vulnerable groups are the IDPs, widows, orphans and the disabled, street children and child soldiers, people with chronical diseases, and the indigenous groups.
The spatial disparities and the disparities at the level of socio-professional groups also characterize the socio-demographic groups. Poverty especially affects the households where the head of the household is between 30 and 65 years of age (over 70% are poor). In contrast, there are relatively fewer poor in the young households (60%) and old households (65%).
The relationship between the household size and the poverty indexes supports the thesis that large households have a tendency to be poorer than small households. Thus, the households with 10 or more members are the poorest (the incidence of over 80 %) and make the greatest contribution to the poverty of these socio-demographic groups. However, below 10 members, the incidence of poverty drops off signifi-cantly, down to 44% poverty among the households with three members.
In rural areas, poverty is i.e. perceived as the absence of peace, the presence of soil erosion, the inability to obtain agricultural inputs, the difficult access to safe drinking water, high work demands on women, malnutrition, the problems with accessing markets and the lack of transport infrastructure. Hence, pov-erty in rural areas is closely linked to the conflicts, the availability and quality of natural resources, and livelihood opportunities. In urban areas, poverty is perceived as i.e. the lack of money, jobs, electric-ity, transportation, decent housing, drinking water and sanitation. In urban areas, therefore, poverty is linked with job opportunities and the access to services and infrastructure (Democratic Republic of Congo … 2008).
Generally speaking, the Gini index of inequality is quite high (42%). This suggests the existence of distributive injustice, discrimination, and virtually endemic exclusion in the country. As in the case of the poverty index, inequality is characterized by sizable
3The traditional instruments for measuring poverty (Foster-Greer-Thorbecke indices) make it possible to quantify three
disparities. The two Kasai provinces and the Katanga Province have the highest inequality rates (with Gini coefficients in excess of 40%). Inequality is relatively low in the provinces of Bas-Congo and Sud-Kivu. The city/province of Kinshasa is also characterized by a high inequality (39%).
Population growth
The DRC average annual rate of population change is now (2005–2010) growing about 2.8%, this is well over the LDCs average value 2.2% in the same period (as an opposite, the rates are even higher in Burundi – 2.9%). With the rates of 65 966 inhabitants in 2010, the DRC belongs to the world most populous coun-tries. Its rapid demographic growth can represent a serious obstacle to improvements in the food security (World Population … 2010).
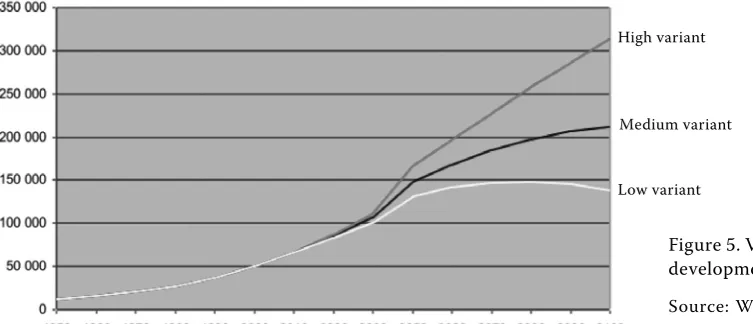
The latest UN Department of Economic and Social Affairs population projections to 2100 for the DRC indicate that the deceleration of the country’s popu-lation growth may be even faster than thought only a few years earlier. The medium variant projection puts the DRC population for 2100 at 212 113 inhab-itants (Figure 5).
Aside from the total size, the most important de-mographic characteristic of a population is its age and gender structure, or the proportion of people at each age, by gender. The age-gender structure determines the potential for the future growth of the specific age groups, as well as the total population. For these reasons, the age structure has significant government policy implications. A population of young people needs a sufficient number of schools and, later, enough jobs to accommodate them.
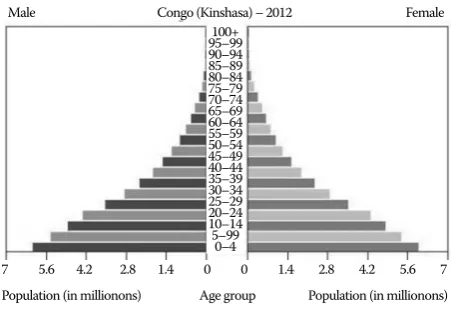
The age-gender structure of a country can be studied through the population pyramids. The overall shape of the pyramid indicates the potential for the future growth. The pyramid, representing the population of the Democratic Republic of Congo, with its wide base and narrow top, is typical of a young population. This shape is the result of high birth rates that feed more and more people into the lowest bars and in turn shrink the relative proportion at the oldest ages. As the death rate declines, more people survive to the reproductive ages and beyond. The births they have further widen the base of the pyramid. This shape is common in many less developed countries that have experienced improvements in the life ex-pectancy but continue to have high birth rates. It reflects both a history of the rapid population growth and the potential for the future rapid growth (Human Population … 2012). Figure 6 serves as an illustration of age structure in the DRC population (in Kinshasa).
[image:9.595.65.442.587.749.2]Few countries in the Sub-Saharan Africa region seem to have entered the transition, while several are at its very early stage; many more have not yet even begun it. Prominent in the category of the non-starters is the Democratic Republic of Congo. Its fertility was on a very high level in the second half the 20th century and remained nearly unchanged today. In 2005–2010 (45 births per 1000 inhabitants), the gross birth rate has attained practically the same level as in 1950–1955 (47 births per 1000 inhabitants). The highest values were observed in 1990–1995 – 51 births per 1000 inhabitants. A similar situation is in the aspect of the total fertility rate. In 1950–1955, the TFR reached 5.98 children per 1 woman. Its peak was in the decade 1990–2000 – 7.14 resp. 7.04 children per 1 woman. Now the levels are slightly decreasing – 6.07 children per 1 woman in 2005–2010 (U.S. Census … 2012).
Figure 5. Variants of population development
Source: World Population Pros-pects... (2010)
High variant
Medium variant
The birth rate in the Congo has not significantly declined, as it would have been expected in con-formity with the orthodoxy of the theory of the de-mographic transition, when the country enters the process of modernization. The breakdown of the fertility-inhibiting customs, and the emergence of the modern infant feeding practices, as well as the improvement of the reproductive conditions through advances in the medical care and nutrition, are some of the important aspects of modernization, which are expected to bring about a rise in fertility before the family planning takes hold.
The infant mortality rates (the probability of dying between the birth and the exact age 1) has decreased from 167 infant deaths per 1000 live births in 1950– 1955 to 116 in the 2005–2010 period.
The net migration rate was the highest in the years corresponding to the duration of the civil conflict (6 per 1000 inhabitants in 1990–1995 and –6 per 1000 inhabitants in 1995–2000). Aiming at the international migration, there has been an outflow and influx of refugees. Several hundreds of thousands of refugees from the DRC fled to Tanzania, the Republic of Congo, Zambia, Rwanda, the Central African Republic, Angola and Uganda. There were smaller numbers in Burundi, Cameroon and Malawi. About 1 million people fled to the DRC from Rwanda in the mid-nineties follow-ing the Rwandan genocide. There were 1 540 814
internally displaced persons in the DRC in September 2011, most of them in the North Kivu and South Kivu Province. The total number of refugees from the DRC in Africa created 403 646 persons.
The urban population is estimated at 2.3 million or 62% versus 1.4 million in rural areas (38%) as of 2007. 2.1 million people live in the main urban centres, Brazzaville and Pointe-Noire, representing about 57% of the total population. This is confirmed by the Employment and Informal Sector Survey (Enquête
sur l’emploi et lesecteur informel au Congo – EESIC)
carried out in 2009, finding that 2.2 million people live in Brazzaville and Pointe-Noire, of which 29% are between 15 and 29.
Development aid
Aimed at the uses of the ODA in the DRC, it is devoted to the humanitarian aid (18.1%), health and population (12.7%), the economic infrastructure and services (14.1%), the action relating to debt (14.1%), the program assistance (5.5%), other social sectors (23.7%) and other (11.8%) (AidFlows 2012).
The DRC is the 3rd world largest ODA recipient, after Afghanistan and Ethiopia. The net ODA4 was 3413 million USD in 2010 and 3% of the total ODA (a significant increase from 245 million in 2001) (Development Aid … 2012).
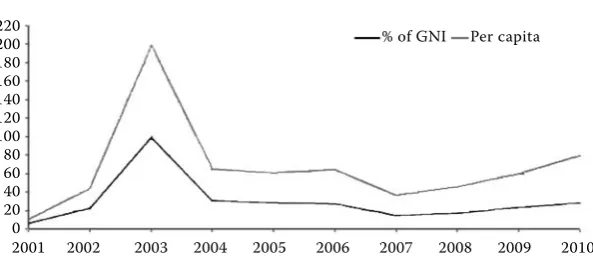
The top ten multilateral and bilateral donors of the gross ODA in the same year were the IDA (International Development Association) with 1188 mil. USD, followed by the IMF, Belgium, the EU insti-tutions, the United States, the African Development Bank, the United Kingdom, Netherlands, Spain and Germany. The net ODA share in the DRC GNI was 27.8%, increased from 5.7% in 2001, as is illustrated by Figure 7 (AidFlows 2012).
Humanitarian aid
The humanitarian mechanism in the DRC is large and well established. It operates in the tandem with 100+
95–99 90–94 85–89 80–84 75–79 70–74 65–69 60–64 55–59 50–54 45–49 40–44 35–39 30–34 25–29 20–24 10–14 5–99
0–4
[image:10.595.63.289.94.253.2]Population (in millionons) Age group Population (in millionons) 7 5.6 4.2 2.8 1.4 0 0 1.4 2.8 4.2 5.6 7 Male Congo (Kinshasa) – 2012 Female
Figure 6. Population pyramid
Source: U.S. Census Bureau – International Data Base (IDB)
the peace-keeping, stabilization, reconstruction, peace consolidation, peace building and development efforts. Hundreds of humanitarian organizations are working together to deliver assistance and protection. They include the UN agencies and programmes, the US programmes, the ICRC (International Committee of the Red Cross), the IFRC (International Federation of Red Cross and Red Crescent societies), the IOM (International Organization for Migration), 120 in-ternational NGOs, 475 national non-profit organiza-tions and 20 donor governments. The humanitarian community works in partnership with 25 government ministries and services at national and provincial levels (Democratic Republic … 2012).
The largest international operation is the United Nations Mission to the DRC (MONUC)5. The mis-sion was established on 30 November 1999 following the Lusaka Peace Agreement. While the MONUC’s mandate is to support the DRC peace process, a humanitarian affairs section was created to assist in efforts to improve the living conditions of the most vulnerable parts of the population. Activities of this section include providing the temporary shelter and protection to civilians threatened by armed conflicts; negotiating the access to vulnerable people by put-ting pressure on the belligerents and facilitaput-ting the transportation of non-governmental organizations (NGO) and the United Nations agency staff under-taking critical humanitarian missions.
Through its humanitarian affairs section, the MONUC engages with personnel from the United Nations Office for the Coordination of Humanitarian Affairs (OCHA), whose task it is to coordinate the humanitarian action, to mobilize resources, to ad-vocate for victims, to undertake humanitarian ne-gotiations and to lead joint assessment missions. Since the start of the war, a number of mechanisms
have been established that aim at coordinating the humanitarian activities. The main objective of these initiatives is to increase the efficiency of humanitar-ian interventions and the level of understanding of the local humanitarian situation and needs. At the provincial level, the OCHA centralizes information on humanitarian issues and interventions and invites the agencies to weekly meetings to exchange informa-tion and discuss the security situainforma-tion. The OCHA’s coordination mechanism also aims at facilitating the communication between the local politico-adminis-trative authorities and the aid agencies, strengthen-ing the coordination of interventions and definstrengthen-ing the priorities and zones of intervention through the organization of regular seminars.
The Humanitarian Aid Department of the Euro-pean Commission (ECHO) is the DRC’s largest donor of the humanitarian assistance, with an allocation of more than 180 million Euros between 2000 and 2005. The ECHO has focused exclusively on the emergency needs and is progressively withdrawing from more stable areas. The ECHO support is mainly provided through the NGOs and is concentrated in the “red zones”, which are defined as unstable regions still suffering from the conflict or emerging from a recent conflict, and in the “blue areas”, or regions where the intense fighting took place between 1998 and 2001, and which since then have gained a certain degree of the minimal contextual (Vlassenroot et al. 2003).
Since the start of the transition process , the
[image:11.595.66.363.87.218.2]European Union (EU) has become a critical player in the DRC. The EU’s approach is to help rebuilding of the country politically (governance) and physi-cally (transport infrastructure and healthcare). The EC also supports the regional initiatives and meas-ures to protect the environment. The multi-annual indicative programme in the DRC for the current
Figure 7. Net ODA disbursements
Source: http://www.aidflows.org/
5In accordance with the Security Council resolution 1925 of 28 May 2010, the MONUC was renamed as of 1 July the
United Nations Organization Stabilization Mission in the Democratic Republic of the Congo (MONUSCO). 2001 2002 2003 2004 2005 2006 2007 2008 2009 2010
220 200 180 160 140 120 100 80 60 40 20 0
spending round has budgeted €561.7 million for these priorities. The EU’s activities in the DRC also involve the cross-cutting issues such as democracy, good governance, human rights, the rights of children and indigenous peoples, gender equality, long-term environmental protection and the fight against the HIV/AIDS (EC 2012).
Government of the DRC programmes
The GODRC has worked with donors and interna-tional public organizations to develop a number of policy and strategy frameworks for the agriculture, rural development, health and nutrition sectors. The
Poverty Reduction and Growth Strategy Paper (PRGSP) has provided the principal framework for the development efforts in the DRC since 2006. The PRGSP provides the overall framework for agriculture and rural development in the DRC and provided the structure for the multi-donor Country Assistance Framework (CAF) and the World Bank Country Assistance Strategy (CAS).
Several other activities should be noted related to agriculture and rural development. Released in 2009, the Agriculture and Rural Development Policy Note
identifies the general and specific strategies to imple-ment agriculture and rural developimple-ment along the five priority axes identified in the 2006 World Bank DRC Agriculture Sector Study. The forthcoming provincial agricultural development plans will build upon this Policy Note. The GODRC has initiated a
Medium Term Expenditure Framework Exercise, through which a medium term expenditure frame-work is being prepared to strengthen the budgetary planning and programming in the DRC. The MTEF should strengthen the alignment of the GODRC development planning and the national budgeting.
Finally, the Stabilization and Recovery Program for Conflict Affected Zones (STAREC) was launched by the GODRC in 2009, to stabilize and promote the recovery and development particularly in the East. The program operates in the North and South Kivu, Maniema, Orientale and Katanga.
The key GODRC policies, strategies and protocols related to nutrition include the National Nutrition Policy, the Master Nutrition Development Plan, the National Protocol for the Management of Acute Malnutrition, the National Strategy for Infant and Young Child Feeding and Women‘s Nutrition, and the National Health Policy.
The DRC launched the Comprehensive African Agriculture Development Program (CAADP) in June 2010. The MINAGRI houses the GODRC focal point for the CAADP, although the CAADP imple-mentation is conducted through the Food Security Steering Group mentioned above. The GODRC is developing a National Food Security Program, with the assistance from the AfDB and the FAO. This process dovetails closely with the CAADP process, which starts with the sector studies and extends to the development of the sector investment plans. It is envisioned that the agriculture development plans developed at the district and territory levels will dovetail with these provincial agriculture de-velopment plans. The initial product of this effort is the Agriculture Sector Study (Etude du Secteur Agricole, ESA), which aims to inform the provincial agricultural development plans.
The Rural Agricultural Management Committees
(Conseils Agricoles Rurals de Gestion, CARGs)
are being established at the national, provincial and territorial levels. The CARGs have been established with the external donor support, but the local admin-istrations are responsible for maintaining them. A product of the MINAGRI reform process, the CARGs aim to provide the platform for collaboration with a range of partners, particularly in the civil society and the private sector, from the national to local levels. The CARGs are expected to work closely with the community development committees.
Finally, legal frameworks relevant to food security are currently in development. The Code Agricole
is in Parliament. The land reform efforts have been supported by international organizations such as the International Fund for Agricultural Development (IFAD). The legal codes regarding land and seed are in development.
CONCLUSION
Land access in Burundi is increasingly limited due to the high demographic pressure that reduces the size of each household’s farm. This situation has already led to the land overuse and degradation and a low food production, which has in turn led to food insecurity. The subsistence crops and livestock present the main source of income for most house-holds, agriculture is thus the key sector and there is still need for developing agricultural and non-agricultural income generating activities, resolving the land and internal displaced persons conflict, protecting environment and the attempt to resolve population growth. Agricultural development has been blocked by low financial resources in rural areas, limited markets for agricultural products, a weak infrastructure, weak producer organizations and post-harvest processing.
The strong focus on the short-term relief measures, combined with the limited support to local agricul-ture, is not only less effective for overcoming the structural reasons for food insecurity, it might even lower the incentives to invest in agriculture and do-mestic food production. A more sustainable solution is required to tackle the underlying reasons for food insecurity, such as the low agricultural productivity. Accordingly, those most in need would also benefit from the provision of basic inputs, such as seeds, fertilizers and farming tools.
There is a possibility to state democracy, to in-crease economic growth, to reduce poverty, and to exit the conflict trap. The risk of relapse to conflict is still very high, the institutional capacity is weak. To confirm peace and minimize the risk of a future conflict, the country needs to diversify its economy and to generate the pro-poor economic growth; and it also needs to build more effective state institutions to improve the governance, and the rule of law.
REFERENCES
AidFlows (2012): Available at http://www.aidflows.org/ Akitoby B., Cinyabuguma M. (2004): Sources of Growth
in the Democratic Republic of Congo: A Cointegration Approach. Working Paper WP/04/114, IMF. Available at http://www.imf.org/external/pubs/ft/wp/2004/wp04114. pdf (accessed May 5, 2012).
Bené C. et al. (2010): Vulnerability in Inland Fishing Com-munities in Africa: Lessons Learned. Available at http:// www.worldfishcenter.org/resource_centre/lesson%20 learned%202105_1305.pdf (accessed May 5, 2012).
Chauvin N.D., Mulangu F., Porto G. (2012): Food Produc-tion and ConsumpProduc-tion Trends in Sub-Saharan Africa – Prospects for the Transformation of Agricultural Sector. UNDP. Available at http://ideas.repec.org/p/ rac/wpaper/2012-011.html (accessed March 10, 2013). CIA Factbook. Democratic Republic of Congo. Available
at https://www.cia.gov/library/publications/the-world-factbook/geos/cg.html (accessed May 5, 2012). Congo Employment and Growth Study (2011). World Bank.
Available at http://documents.worldbank.org/curated/ en/2011/12/15646935/republic-congo-employment-growth-study-jobless-inclusive-growth (accessed May 5, 2012).
Democratic Republic of Congo (2012). UN-OCHA. Avail-able at http://www.unocha.org/ocha2012-13/drc (ac-cessed May 5, 2012).
Democratic Republic of Congo (2012). World Food Pro-gramme. Available at: http://www.wfp.org/countries/ Congo--Democratic-Republic-Of/Overview (accessed May 5, 2012).
Democratic Republic of Congo Environmental and Climate Change Policy Brief (2008). Department of Economics, University of Gothenburg. Available at http://www.sida. se/Global/Countries%20and%20regions/Africa/DR%20 Congo/Environmental%20policy%20brief%20DR%20 Congo.pdf (accessed May 5, 2012).
Development Aid at a Glance (2012). OECD, Paris. Avail-able at http://www.oecd.org/dataoecd/59/5/ 42139479. pdf (accessed May 5, 2012).
DR Congo (2010): Bellmon Estimation. USAID, Wash-ington. Available at http://www.usaidbest.org/docs/ drcbellmon2010.pdf (accessed May 5, 2012).
EC (2012): European Commission Country Cooperation – Democratic Republic of Congo 2012. Available at http://ec.europa.eu/europeaid/where/acp/country-cooperation/congo-democratic-republic/congo_en.htm (accessed April 18, 2012).
FAO Statistical Yearbook (2012). Available at http://www. fao.org/docrep/015/i2490e/i2490e00.htm (accessed April 18, 2012).
FAOSTAT. Available at http://faostat.fao.org/ (accessed April 18, 2012).
Hesse A. (2007): Malnutrition in the Democratic Republic of Congo: Implications and Solutions. Geography 123. Available at http://www.personal.psu.edu/alh359/blogs/ rels_nook/YAPA%20PAPER%206%20FINAL%20VER-SION.pdf (accessed May 5, 2012).
IMF (2007): Democratic Republic of Congo, Poverty Re-duction Strategy Paper. Available at http://www.imf. org/external/pubs/ft/scr/2007/cr07330.pdf (accessed May 5, 2012).
Kisangani E., Bobb S. (2010): Historical Dictionary of the Democratic Republic of the Congo. Scarecrow Press, Plymouth.
Mathys E., Remancus S. (2010). USAID Office of Food for Peace Food Security Country Framework for the Demo-cratic Republic of Congo FY 2011–FY 2015. Food and Nutrition Technical Assistance II Project (FANTA-2), AED, Washington, D.C. Available at http://pdf.usaid. gov/pdf_docs/pdacw047.pdf (accessed April 18, 2012). Mushobekwa A. (2010): DRC Economic report. World Bank.
Available at http://siteresources.worldbank.org/CON- GODEMOCRATICEXTN/Resources/DRC_SpringEcon-Report.pdf?resourceurlname=DRC_SpringEconReport. pdf (accessed April 18, 2012).
U. S. Census Bureau International Database (2012). Avail-able at http://www.census.gov/population/international/ data/idb/informationGateway.php (accessed May 5, 2012).
Vlassenroot K., Ntububa S., Raeymaekers T. (2003): Food Security Responses to the Protracted Crisis Context of the Democratic Republic of the Congo. Conflict Re-search Group, University of Ghent.
Wodon Q., Morris M., Glaesener V., Zoyem J.-P., Larbouret P., Moens M., Dianga E., Mdaye B., Kavalec A. (2008): Agricultural Recovery – Food Security and Beyond. World Bank. Available at http://ideas.repec.org/p/pra/ mprapa/15410.html (accessed March 20, 2013). World Population Prospects, the 2010 Revision Database
(2010). Available at http://esa.un.org/wpp/Excel-Data/ population.htm (accessed April 18, 2012).
Received: 24th March 2014
Accepted: 23th May 2014
Contact address: