Optimization of Thickness Uniformity in Electrodeposition
onto a Patterned Substrate
Young-joo Oh
1;*, Soon-hyo Chung
1and Man-seung Lee
21
Metal Processing Research Center, Korea Institute of Science and Technology, 39-1 Hawolgok-dong, Seongbuk-gu, Seoul 136-791, Korea
2Department of Advanced Materials Science and Engineering, Mokpo National University,
Chonnam 534-729, Korea
A numerical simulation based on the finite element method was used to obtain the optimal electrodeposition condition at a patterned cathode. The calculated deposition rates agreed well with the measured ones. Influences of the following parameters on uniformity of electrodeposit have been studied; width of auxiliary electrode, gap between cathode and auxiliary electrode, distance between the inner wall of bath and auxiliary electrode, shape of auxiliary electrode, paddle velocity, gap between cathodes and paddles, anode size.
(Received June 4, 2004; Accepted August 3, 2004)
Keywords: finite element method, auxiliary electrode, uniformity of current distribution, electrodeposition
1. Introduction
Bus electrodes for PDP (plasma display panel) have been usually fabricated by using a FODEL (photosensitive silver process of Dupont) process.1,2) The minimum width of the electrode was about 50mmby this process and the silver paste for the electrode fabrication was expensive.
However, it is expected that the width of the bus electrode becomes thinner than 50mm in the near future because the number of cells for a 70-inch HDTV PDP amounts to 6 millions.3) The electrode should be thicker in order to
preserve the same resistance. However, the formation of thick electrode in the FODEL process is very difficult since silver powders used in the process scatter or reflect the ultraviolet light easily. This process, therefore, does not seem to be adopted for a next generation PDP of which cell needs more fine electrodes.
To reduce the line width of the electrodes with maintaining their resistance, some researchers have proposed a method3)
which comprises photolithography and electroplating. In this method, electroplating requires uniformity of the deposit with high deposition rate. Normally, uniformity of the deposit decreases with deposition rate. Therefore, in order to meet such a contradicting requirement the optimal conditions for electroplating must be determined.
In this study, we carried out numerical analysis on the electrodeposition system of the patterned cathode to find out an optimal electroplating condition for a larger PDP. The effectiveness of the numerical analysis has been verified from the agreement between the calculated and the measured values obtained from the patterned cathode system (7 inches size).
2. Experimental Details
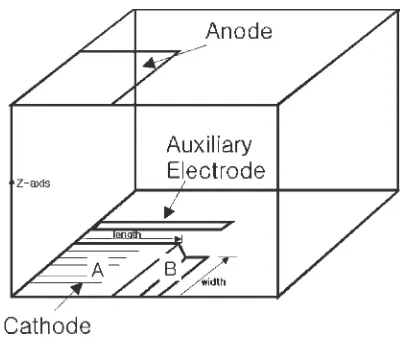
The cathode (A in Fig. 1) was prepared by sputtering a 1mm film of titanium onto glass plate (200mmðLÞ
120mmðWÞ 2mmðtÞ), which was then coated with a 15mmfilm of photoresist. The photoresist was removed by standard lithographic techniques to produce the patterned cathode with 40mmin width and the ratio of metal exposed area to total area was 0.15. Since the connector parts (B in Fig. 1) in the right and left side of the patterned cathode also act a role as an auxiliary electrode, the auxiliary electrodes were only set in the upper and lower sides of the patterned cathode.
The anode was made of 99.9% copper and positioned parallel to the cathode. The distance between anode and cathode and the size of anode changed, if necessary.
The bath solution was agitated by means of a reciprocating paddle which consisted of a pair of confronting triangular blocks. This paddle geometry is common to many industrial paddle cells. The range of linear paddle velocities attainable in this system was 10–50 cm/s.
Electrolytic solutions were prepared from 200 g/l of CuSO45H2O and all experiments were carried out at 25C. Applied current were controlled by an EG&G Princeton Applied Research potentiostat (Model 263A) and the
thick-Fig. 1 A computational domain.
*Corresponding author, E-mail: [email protected]
[image:1.595.325.525.320.492.2]r2¼0 ð1Þ
and the following boundary conditions
@=@n¼0 at all non-conducting surfaces
¼A along the anode
¼Csc along the cathode and
¼AUXsc along the auxiliary electrode.
Here s and c are the concentration and surface
over-potentials, respectively.
The surface overpotentials is assumed to depend on the
active local current density iACT according to the Tafel expression of electrode kinetics7)
s¼ ðRT=cnFÞlnðiACT=i0Þ ð2Þ
wherec,n andi0 are the cathodic transfer coefficient, the number of electrons transferred per ion discharged and the exchange current density, respectively. HereR,TandFmean the gas constant, absolute temperature and Faraday’s con-stant, respectively. The current density is related to the gradient of potential by Ohm’s law
iACT¼ ð@=@nÞ=a ð3Þ
whereis the electrolyte conductivity andais the active area density on the patterned electrode. The following expression forcwas assumed
c¼ ðRT=nFÞlnðcs=cbÞ ð4Þ
wherecbandcsare the bulk and surface concentrations of the reacting species, respectively. The exchange current density depends on the concentration.7)
i0¼i0bðcs=cbÞ ð5Þ
wherei0bis the value ofi0at the bulk metal-ion concentration and is a constant. The depletion of the reacting ion at the electrode surface is related to the ratio of the actual current density to the limiting current densityiL.8)
cs=cb¼1iACT=iL ð6Þ
The limiting current density is expressed as
iL ¼nFkcb¼nFðD=Þcb ð7Þ
wherek,D,are mass transfer coefficient, the diffusivity of the depositing ion, and the thickness of the diffusion layer. The mass transfer coefficient in the electroplating cell stirred
of the current densityiCfrom its averagehiCi.
2¼ ð1=SÞ Z
S
½ðiC hiCiÞ=hiCi2dS ð10Þ
whereSis area.
The Laplace equation is discretized with the finite element method, the overpotentialssandcare updated with help of
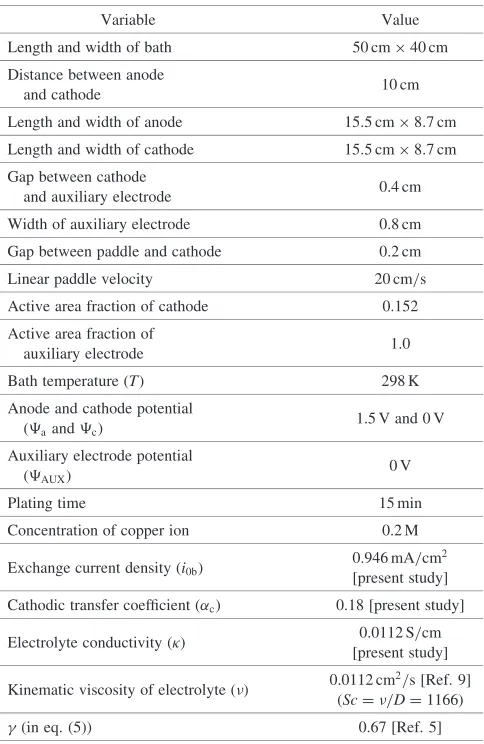
[image:2.595.307.549.414.786.2]underrelaxation method. Table 1 shows the base conditions for calculations.
Table 1 Base conditions for calculations.
Variable Value
Length and width of bath 50cm40cm
Distance between anode
and cathode 10 cm
Length and width of anode 15:5cm8:7cm
Length and width of cathode 15:5cm8:7cm
Gap between cathode
and auxiliary electrode 0.4 cm
Width of auxiliary electrode 0.8 cm
Gap between paddle and cathode 0.2 cm
Linear paddle velocity 20 cm/s
Active area fraction of cathode 0.152
Active area fraction of
auxiliary electrode 1.0
Bath temperature (T) 298 K
Anode and cathode potential (aandc)
1.5 V and 0 V
Auxiliary electrode potential (AUX)
0 V
Plating time 15 min
Concentration of copper ion 0.2 M
Exchange current density (i0b)
0.946 mA/cm2
[present study]
Cathodic transfer coefficient (c) 0.18 [present study]
Electrolyte conductivity () 0.0112 S/cm [present study]
Kinematic viscosity of electrolyte () 0.0112 cm
2/s [Ref. 9]
(Sc¼=D¼1166)
4. Results and Discussion
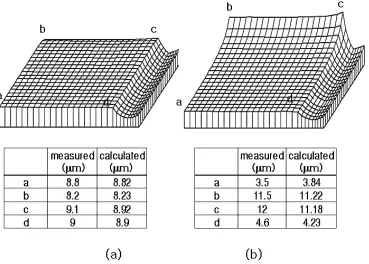
The upper parts of Fig. 2 show thickness of deposits from the calculation. Experimentally obtained thickness at the designated points are listed in tables. One can find that calculated thickness agrees well with experimentally ob-tained one. Therefore, the thickness of deposit in the patterned cathode can be estimated by using the numerical method, and the auxiliary electrode is necessary to obtain uniform thickness of deposit.
Figure 3 shows the variation of degree of nonuniformity with input current density. Considering both deposition rate and thickness uniformity, 200 A/m2was selected as a proper input current density in this study.
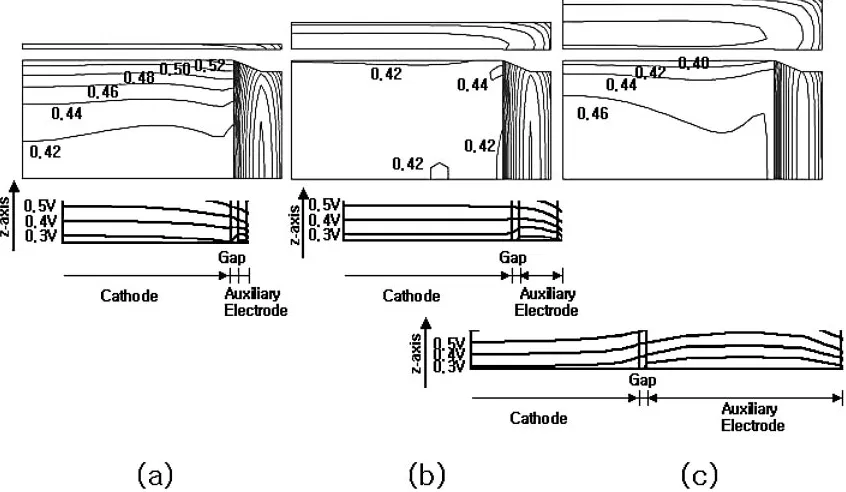
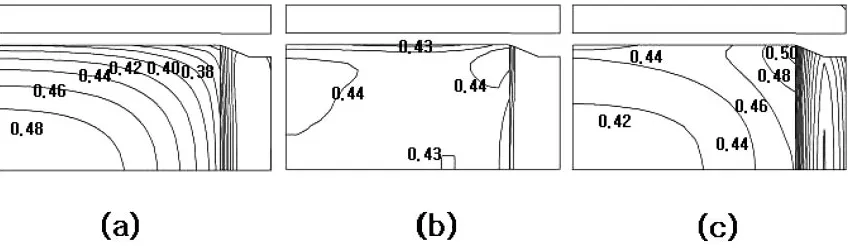
4.1 Effects of the geometry of an auxiliary electrode Figures 4(a), (b) and (c) show contours of the iso-deposition rate and iso-potential when widths of the auxiliary electrode (A.E.) are 0.2 cm, 1.0 cm and 5.0 cm, respectively. When the width of A.E. is small (0.2 cm), deposition rate near the upper part of the cathode is higher than those at central part, while it become smaller when the width of A.E. is larger (5 cm). Iso-potential contour in Fig. 4 reveals that this phenomena is caused from the different potential distribution with width of A.E. Generally, so-called edge effect can be reduced using an A.E. by changing potential distribution. In order to obtain uniform deposit, A.E. width should be around 1 cm in this electroplating condition, as shown in Fig. 5 in this electroplating condition.
The effect of gap between auxiliary electrode and cathode on the uniformity of deposition can be explained by analogy with the effect of width of the auxiliary electrode. As shown in Fig. 6, namely, the edge effect occurred seriously with an increase in the gap between auxiliary electrode and cathode and the effect of existence of auxiliary electrode increased with a decrease of the gap. The proper gap, therefore, existed and it was 0.4 cm in this study.
By using the above-mentioned mathematic calculation, the proper gap between auxiliary electrode and inner wall of the plating cell was found to be 15 cm.
4.2 Effects of the paddle velocity
Figure 7 shows that the variation of sigma (degree of nonuniformity) with the velocity of paddles. Generally, the agitation plays a role in an increase of the mass transfer velocities and deposition rates which increase no longer when the agitation velocity exceeds the particular value. The variations of sigma (D.N.) in Fig. 7, however, suggest that Fig. 2 Comparisions between the measured and calculated thicknesses of the deposit. (a) with auxiliary electrode (b) without auxiliary
electrode.
[image:3.595.116.485.73.337.2]the agitation by a paddle also have an effect on the formation of uniform deposit thickness at the whole surface of cathode. And it is thought that the paddle velocity where the minimum sigma (D.N.) value appears increases since the effect of agitation decreases with an increase in the gap between paddle and cathode.
4.3 Effects of anode size
Figure 8 shows the variation of sigma with the anode size. When the anode and the cathode have same size, the nonuniformity of deposit reaches the minimum value of 0.015. The increased amounts of sigma value with a decrease in anode length are much higher than those with a decrease in anode width because no auxiliary electrode exists on the right side of the cathode. On the contrary, the reduction of anode
size is helpful for the deposition in the case of no auxiliary electrode.
4.4 Effects of gap between anode and cathode
Figure 9 shows that the nonuniformity of deposition becomes minimum at a certain distance between anode and cathode and those minimum values and distances where the minimum values appear increased with a decrease in anode size.
The appearance of minimum value at a given anode/ cathode ratio can be explained with Fig. 10 which shows the variation of deposition rate with the distances when the size of anode is same to that of cathode. The deposition rates are slower at the edge than at the center since the current was concentrated on the center of the cathode, when the gap is 5 cm. And the opposite result appears when the gap is 15 cm. When the anode size is much smaller than cathode at a small gap between anode and cathode, the currents from anode flow into the local area in the cathode. Therefore, the uniform flow of the current on the whole cathode area occurs only when the gap between anode and cathode is consid-erably large. As a result, the distances where the minimum values appear should increase with a decrease in anode size.
5. Conclusions
(1) A numerical method was used to find out the optimal electroplating condition for the PDP.
(2) The calculated deposition rates agreed well with the measured values for the patterned cathode of 7 inches in size. (3) Although the ordinary edge effect in electroplating could decrease with a change in geometries of auxiliary electrode and electroplating cell, an excessive change hindered the uniformity of deposition.
(4) When the input current density is 200 A/m2, optimum conditions for the uniformity of deposition are as follows: Fig. 4 Effects of the width of auxiliary electrode on deposition rates and potential contours. (a) 0.2 cm (b) 1.0 cm (c) 5.0 cm.
[image:4.595.87.510.75.321.2] [image:4.595.51.288.372.551.2]Width of auxiliary electrode 1.0 cm Gap between cathode
and auxiliary electrode 0.4 cm Gap between paddle and cathode 0.2 cm Paddle velocity above 7.5 cm/s Ratio of anode to cathode in size 1 Distance between anode and cathode 10 cm
Acknowledgments
This research was supported by a grant (M102KR010024-04K1801-02411) from Information Display R&D Center, one of the 21st Century Frontier R&D Program funded by the Ministry of Science and Technology of Korean government. Fig. 6 The variation of nonuniformity of deposit with the gap between
cathode and auxiliary electrode.
Fig. 7 The variation of nonuniformity of deposit with the velocity of paddles.
Fig. 8 The variation of nonuniformity of deposit with the anode size.
[image:5.595.50.289.70.249.2]Fig. 9 The variation of nonuniformity of deposit with the distance between anode and cathode.
[image:5.595.306.543.72.245.2] [image:5.595.307.543.291.467.2] [image:5.595.51.288.301.474.2] [image:5.595.87.512.532.656.2]