Kinetics of Glass Transition Simulated by Path Probability Method
Tetsuo Mohri and Yoshitaka Kobayashi
Division of Materials Science and Engineering, Graduate School of Engineering, Hokkaido University, Sapporo 060-8628, Japan
Kinetics of glass transition is simulated within the Path Probability Method (PPM) which is the natural extension of the Cluster Variation Method (CVM) to time domain. Temperature dependences of order parameter during continuous cooling are calculated as a function of cooling rate. When the temperature dependence of viscosity is introduced in the mobility term in the PPM, the order parameter is frozen as approaching the ideal glass transition temperature. Furthermore, a preliminary calculation which incorporates the cooling rate dependence into the viscosity reproduces the experimental tendency of the glass transition temperature. Together with the previous studies of thermodynamic frameworks of glass transition based on the CVM, it is confirmed that the combination of the CVM and PPM provides a unique theoretical tool to study glass transition in a consistent manner covering thermodynamics and kinetics.
(Received June 21, 2005; Accepted August 30, 2005; Published December 15, 2005)
Keywords: cluster variation method, path probability method, continuous displacement cluster variation method, glass transition
1. Introduction
In order to describe thermodynamic and kinetic features of glass transition, a series of theoretical calculations have been attempted based on Cluster Variation Method1) and Path Probability Method.2) And in the previous works,3,4) we demonstrated that the essential thermodynamic feature of
glass transition is reproduced within the framework of Cluster Variation Method. For the sake of completeness, we reproduce the main theoretical formula in the followings. The free energy employed in these calculations is the one for L10ordered phase within the tetrahedron approximation5)
given by
FL10¼1
2N X
i;j
ei j ðyi j þ4y
i j þy
i j Þ
kBTln Y
i;j ðNyi j Þ!
( )
Y
i;j ðNyi j Þ!
( )4
Y
i;j ðNyi j Þ!
( )
N!
Y
i ðNxiÞ!
( )5=2
Y
i ðNxiÞ!
( )5=2
Y
i;j;k;l
ðNwi jkl Þ!
( )2; ð1Þ
whereN is the number of lattice points,ei j the atomic pair interaction energy between speciesiandj,kBthe Boltzmann constant, T the temperature, xi, yi j and wi jkl are cluster probabilities of finding an atomic arrangement specified by subscript(s) on a point, nearest neighbor (n.n.) pair and n.n. tetrahedron clusters, respectively, and the superscriptsand designate the sublattices.
In view of the fact that cluster probabilities, {XfJgðlÞ}, are not mutually independent, one often employs a set of correlation functions6,7)defined in the following manner,
XfJgðlÞ ¼ 1 2nl 1þ
X
l0
VfJgðl;l0Þ l0
( )
; ð2Þ
where {J} specifies atomic arrangement on the clusterl,nl the total number of lattice points contained in the clusterland l0 is the correlation function for al0-point cluster defined as the ensemble average of a product of spin variables
h12 p l0i where p takes either þ1 or 1 depending upon A or B atom, respectively, located on the lattice point p. V is called V-matrix6,7) which involves the sum of products ofi;j;k. . ., and the summation is taken over
the subcluster l0 contained in the cluster l. Equation (2) is
nothing but a linear transformation between cluster proba-bilities and correlation functions, and the actual operation has been amply demonstrated in the previous articles.
Then, in terms of correlation functions, the free energy given by eq. (1) can be symbolically rewritten as
FL10¼FðT;fei jg;xi;x
i;y
i j ;y
i j;y
i j ;w
i jkl Þ
¼FF^L10ðT;fei jg;1;
1;
2 ;
2 ;
2 ;
3 ;
3 ;
4 Þ;
ð3Þ
where
1ð
1Þis the point correlation function which serves as
a Long Range Order (LRO) parameter, while other correla-tion funccorrela-tions describe short range order correlacorrela-tions. Furthermore, the formulation was confined to a fixed 1:1 stoichiometry, and the number of independent correlation functions was reduced due to the symmetry of the L10
ordered phase which claims 1 ¼ 1, 2 ¼2 and 3 ¼ 3 . Hence, the final form of the free energy is given as
FL10 ¼FðT; 1; 2 ; 2 ; 3 ; 4 Þ; ð4Þ
Special Issue on Materials Science of Bulk Metallic Glasses
where T is a temperature normalized by effective pair interaction energyv2defined as,
v2¼
ðeAAþeBBÞ
2 eAB ð5Þ
and is given by
T ¼kBT
v2
: ð6Þ
In order to avoid unnecessary confusion, is omitted in the
followings.
It should not be confused that the free energy formula above is based on the symmetry of L10 ordered phase,
whereas neither specific symmetry of Bravais lattice nor periodicity of lattice points can be assumed for a metallic glass, and, therefore, structural features of a bulk metallic glass is by no means included in the description. Hence, one can not expect to derive structural information of a metallic glass out of these calculations. In fact, the incorporation of such information in the free energy is a final target of a series of investigation based on Continuous Displacement Cluster Variation Method (CDCVM)8–13) which is the extension of the conventional CVM. Within the CDCVM, additional points are assumed around a lattice point as candidate points to which atom is allowed to displace. Such a displacement is represented by, and the distribution of the atomic spacesi around a lattice point is given by the distribution function fiðÞ. Likewise, the pair distribution function is described by gi jð1;2Þ, and by employing these distribution functions, the
internal energyEand the entropySare modified to construct a free energy. The optimized distribution functions under an appropriate atomic interaction energies are supposed to provide the structural information of metallic glass.
Prior to the application of sophisticated CDCVM, how-ever, it is deemed necessary to examine the feasibility of CVM for simulating the thermodynamic properties associ-ated with glass transition, which was the major objective of the previous investigation. And it is for this reason that all the short range order parameters (correlation functions) were eliminated by performing the constrained minimization of the free energy,
@FL10
@fðmÞg
T; 1
¼0; ð7Þ
wherefg
m represents
2 ,
2 ,
3 ,
4 , and we focus only
on the dependence on the LRO parameter,
1 ¼x
Ax
A, which threw light upon the first order character of the resultant free energy which is necessary to describe the glass transition.
For the latter purpose, we replace LRO parameter,
1, by,
and the free energy function was obtained as
FL10 ¼fðT; Þ; ð8Þ
where the subscriptimplies that the original free energy is
subject to the constrained minimization.
2. Spinodal Ordering and Ideal Glass Transition
The important finding in the previous studies was that the
ideal glass transition was identical to the spinodal ordering transition14,15) in the order-disorder system. In fact, the vanishing of the first and second order derivatives of the free energy with respect to the order parameter at a complete random state given by
@fð;TspÞ
@
¼0
¼@
2fð;T
spÞ
@2
¼0
¼0 ð9Þ
defines the spinodal ordering temperatures, Tsp. And it was shown that at a particular combination ofTspand¼, the following relation holds
@fð;TÞ
@T
T
sp
¼@fð¼0;TÞ
@T
T
sp
; ð10Þ
indicating that the entropies of ordered and disordered phases characterized by ¼ and 0, respectively, become
iden-tical. This is exactly the implication of the ideal glass transition for which a defective crystal and a liquid phase have the same entropy.
In order to move one step further to specifically simulate the glass transition, by following pioneering work of Okamoto et al.,16) unity and null were assigned to for a liquid and crystal phases, respectively. Then, a finite value of is regarded as the amount of defects which induces the liquid transition. The specification of a particular kind of defect is not essential in the study andcan be interpreted as the amount of generalized defects16) including impurities, dislocations, lattice vibrations etc. which induce breaking of the crystal symmetry, leading to a liquid transition.
At a fixed order parameter, the temperature dependence of the free energy is given by eq. (8). And the intersection with the liquid free energy curve yieldsT0temperature which
indicates the melting temperature of a defective crystal. The characteristic T0 curve obtained in the previous study is
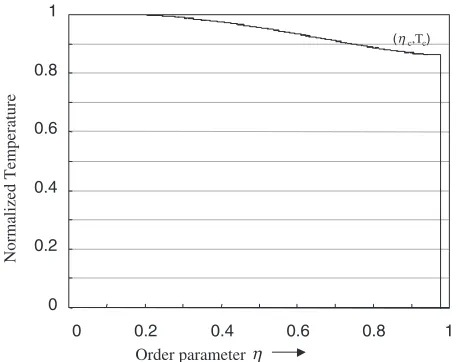
reproduced in Fig. 1.3,4) The horizontal axis is the order parameter which corresponds to a liquid phase at unity (¼1) and a perfect crystal at null (¼0). One sees that with increasing the defect, the melting point decreases. It is,
0 0.2 0.4 0.6 0.8 1
0.2 0.4 0.6 0.8 1
0
(ηc,Tc)
Normalized Temperature
Order parameterη
Fig. 1 T0 diagram indicating a tricritical point (c¼0:976,Tc¼0:861)
which suggests the ideal glass-transition temperature, TK (¼Tc). The
[image:2.595.313.542.555.736.2]however, realized that this is not an equilibrium phase diagram, since the equality of the free energy indicated byT0
curve does not necessarily guarantee the equilibrium tran-sition. Also, important is the fact thatT0curve terminates at a
tri-critical point at Tc¼0:861 and c¼0:976. This is exactly the ideal glass transition temperature,TK. When the defect is further introduced in the crystal at a tri-critical state, the crystal transits to the glass, while upon raising the temperature, it becomes the super cooled liquid above Tc (¼TK). Hence, one realizes thatTc(¼TK) is a temperature at which spontaneous loss of the stability sets in, which is the spinodal ordering temperature in the context of ordering transition.
As mentioned, these calculations were originally attempt-ed as preliminary studies prior to the application of Continuous Displacement Cluster Variation Method (CDCVM) to the glass transition. In contrast to the conven-tional CVM which is applicable only to a periodic lattice system, CDCVM lifts such limitations and opens up a possibility of investigating a topologically disordered struc-ture in addition to a substitutionaly disordered strucstruc-ture. The investigation of thermodynamic stability of the Bulk Metallic Glass which forms non-Bravais lattice is, therefore, a potential candidate for the application of CDCVM. Yet, the feasibility of CDCVM to the study of glass transition is not fully guaranteed and as a preliminary investigation of the thermodynamic framework, we examined conventional CVM for the description of the glass transition.
Although both spinodal ordering and glass transition are characterized by the spontaneous loss of intrinsic thermody-namic stability, the essential difference is the fact that the
kinetics plays a deterministic role in the glass transition. In particular, the enhanced viscosity with decreasing temper-ature is a key to trigger the transition, which is not properly accounted in the framework of equlibirum thermodynamics calculations.
Apart from various advantageous features of the CVM in the description of glass transition, another superiority of the CVM is that the kinetics aspects can be studied by employing Path Probability Method (PPM)2) which is the natural extension of the CVM to time domain. In fact, some of the preliminary results of the kinetics features associated with quenching operation were already reported in the previous reports.3)In the present report, main emphasis is placed on the continuous cooling behavior and the cooling rate dependence on the glass transition is simulated by explicitly incorporating the viscosity into the theoretical framework. The organization of the present paper is as follows. In the next section, essential feature of the Path Probability Method are summarized. The main results and discussion are presented in the final section.
3. Path Probability Method
Path probability Method (PPM) was devised as a natural extension of the CVM to time domain by Kikuchi.2) Therefore, there exist close correspondences between PPM and CVM. For instance, as a counterpart of the free energy of the CVM,Path Probability Function(PPF),P, is defined in the PPM which is given as a product of the following three terms.
P1¼
Y
¼
ðtÞ
N
2X ; 1;11ðtÞ
N
2X ;
11;1ð1tÞ
N
2X ;
1;1ð1tÞ
N
2X ;
11;11 ð11Þ
P2¼exp
E 2kBT
; ð12Þ
and
P3¼kBln Y
i;j
ðNYi j;;kl Þ!
( )
Y
i;j
ðNYi j;;kl Þ!
( )4
Y
i;j
ðNYi j;;kl Þ!
( )
N!
Y
i
ðNXi;;j Þ!
( )5=2
Y
i
ðNXi;;j Þ!
( )5=2
Y
i;j;k;l
ðNWi jkl;;mnop Þ!
( )2 ð13Þ
whereis the spin flipping probability per unit time that corresponds to the diffusivity of an alloy system, andEis the change of the internal energy duringtgiven by
E¼1
2N X
;
!X
i;j ei j fy
i jðtþtÞ y
i jðtÞg X
i
ixi ð14Þ
where ! is the degeneracy factor of each pair on the
sublatttice(s) distinguished by superscripts, and i is an additional chemical potential of speciesiof which physical significance will be described latter. X;i;j, Yi jf;gkl;fg and Wi jklfg;;fmnopg are termedpath variablesfor point, n.n. pair and n.n. tetrahedron clusters, respectively, which describe the configurational transition duringt. Note that the subscripts before (after) comma sign designate the configuration at time
t (tþt) and the superscripts suggest the sublattice(s). These are the key variables corresponding to cluster probabilities of the CVM.
appropriate kinetics is the vacancy mediated kinetics, however the number of microscopic paths involving vacan-cies is formidably large and it is not an easy task to formulate Path Probability FunctionP. In the present study, we employ spin kinetics. One should notice that conservation of the species is not generally observed in the spin kinetics. Yet, at 1:1 stoichiometric composition, the number of up and down spins are conserved without additional constraints, which, in a way, simulates an alloy system.
It may be easier to grasp the physical meaning of a path variable by exemplifying a simple point cluster. The first subscript i in Xi;;j indicates the configuration on a point cluster at timet, while the second subscriptjindicates the one at time tþt on the same lattice point, and the cluster probabilityxi at timetcan be written as,
xiðtÞ ¼Xi;;i ðt;tþtÞ þXi;;j ðt;tþtÞ: ð15Þ
Likewise, the cluster probability x
i at time tþt can be given as
xiðtþtÞ ¼Xi;;i ðt;tþtÞ þX;j;i ðt;tþtÞ: ð16Þ
P1in eq. (11) describes non-correlated spin flipping events
over the entire lattice points. This represents a Markov process, andP2in eq. (12) indicates a conventional thermal
activation process and provides the probability of gaining thermal assist from a heat reservoir. The third term P3 in
eq. (13) characterizes the PPM which appears to be quite similar to a configurational entropy term in eq. (1). In fact, the CVM entropy describes the configurational freedom while the P3 term describes microscopic freedom of
transition path from one configuration to another.
The key criterion claimed in the PPM is that the most probable transition path is determined so that the PPF is maximized with respect to path variables,
@P
@i jf...g;f;klg... ¼0 ð17Þ
wherePis the PPF given by
P¼P1P2P3 ð18Þ
andfi j...g;f;klg...indicates a path variable describing the transition fromij. . .tokl. . .on the sublattice specified by superscripts during an infinitesimal time step t. This condition is the counterpart of the minimization condition of the free energy of the CVM.
Noteworthy is the fact that, unlike other kinetic theories, neither free energy nor its derivative is involved in the kinetics equations. This partly assures the applicability of PPM to the study offar-from-equilibriumkinetics for which the concept of free energy is even obscured. PPM has been applied to various kinetics calculations including transition kinetics,19) relaxation kinetics,20) steady state kinetics,21) critical behavior22)and fluctuation around the most probable path.23)To the best of authors’ knowledge, however, it has never been employed for the glass transition except our preliminary study.3)
4. Simulation of a Continuous Cooling Curve
In the previous report,3)it was demonstrated that two kinds
of transition behavior were distinguished depending upon the aging temperature to which a liquid phase was quenched. BelowTK, the system became intrinsically unstable against infinitesimal fluctuation. Accordingly,decreases with time and the spontaneous transition to crystalline state took place. The steady state value ofobtained by PPM in the long time limit was confirmed to be the equilibrium independently calculated by the CVM. While for an aging temperature above TK, two different aging behavior were realized depending upon the initial deviation of from the equili-brium value in the liquid state. Such a deviation was induced by imposing an additional chemical potential, i in eq. (14), at the initial time. It was seen that for a sufficient amount of fluctuation (deviation) the transition took place, while for a small amount of deviation, the system went back to the metastable liquid state. In fact, the difference of these two modes of transition at the two temperatures are originated from the absence (belowTK) or presence (above TK) of the free energy barrier, which is similar to the difference between spinodal ordering and nucleation-growth ordering for the order-disorder transition.
In both cases, however, what is to be emphasized for glass transition is that the time of transition was formidably long in the ordinary lab scale. This is caused by the abrupt depression of atomic mobility near the transition temperature due to the enhanced viscosity, leading to peculiar kinetics of glass transition. Then, in addition to the previous preliminary calculations on kinetics, one needs to incorporate the viscosity into the present frameworks of the calculations. This is essentially the main purpose of the present study.
In the three terms of PPF, P, given by eq. (18) through eqs. (11)–(13), mobility is controlled by spin flipping probability in P1 while the driving force is described by
P2. Hence, it is natural to introduce the effects of viscosity
through the spin flipping probability,
¼C1 ð19Þ
with
¼ 0exp
B TTK
ð20Þ
which is known as Vogel–Fulcher–Tammann equation,24) where 0andBare materials constants andCis an adjustable
parameter. Note that viscosity is conventionally denoted by , however this letter is already assigned to LRO parameter and is employed for viscosity which again should not be confused with an additional chemical potential, i.
state. The one is above a critical value and the other is below the critical value, and the two different modes of aging behavior at a fixed temperature were realized. In the present study, we imposed an additional chemical potential below the critical value at the initial time and investigated the relaxation behavior of the order parameter upon the con-tinuous cooling. Shown in Fig. 2 is the relaxation behavior of supercooled liquid for a certain cooling rate, R, which is normalized with respect tot. As a reference,T0curve is
also plotted. One can see that with decreasing the temperature the cooling curve tends to return back to¼1, however starts to be locked as the temperature approachesTK, which is due to the increase of viscosity.
Then, we kept imposing small i (<
i) all the time below the transition temperature (T ¼1:0) and investigated the relaxation behavior during continuous cooling for differ-ent kinds of cooling rate, R. Shown in Fig. 3 are the
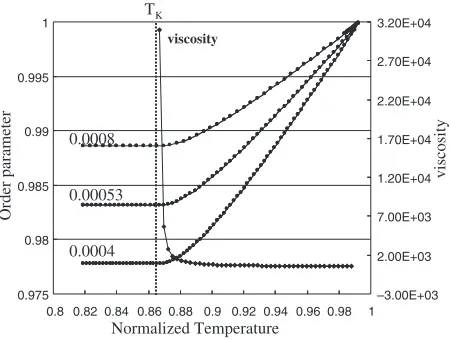
temperature dependences of the order parameter for three kinds of cooling rate. The temperature dependence of the viscosity is also demonstrated. One sees that as the ideal glass transition temperature is approached, the viscosity abruptly increases and accordingly the order parameter is frozen for all the three cooling rates. One notices that with decreasing the cooling rate the locked value ofapproaches the critical order parameter,c.
It is experimentally reported25) that the glass transition temperature shifts in the higher temperature with the increase of heating rate. In order to simulate this, we further assumed the cooling rate dependency in the constant term B in eq. (20), B¼AR, where A is a constant. The calculated cooling curve is demonstrated in Fig. 4. The onset of the constancy of order parameter is defined as the glass transition temperature Tg and is indicated by a solid circle in each cooling curve. One sees that the glass transition temperature increases with cooling rate.
In the context of spin flipping kinetics of PPM, B in eq. (20) is regarded as the activation energy of an elementary flipping process under the effective temperature TTK. Then, the increase of cooling rate is virtually equivalent to the decrease of the effective temperature in eq. (20). In other words, the increase inRis effectively the same as decreasing the temperature in a cooling curve in Fig. 3, which accelerates to encounter the temperature of freezing of the order parameter. Hence, one can promotes/retard the transition kinetics through the introduction of an appropriate elementary process intoB, however the physical meaning of theRdependency ofBin the present calculation is not fully grasped. This may be attributed to structural change of glasses, but the details of the structural analyses are left as a future subjects in the CVCDM.
Furthermore, in order to perform more realistic simulation, one needs to look into the details of structural fluctuation of a supercooled liquid. Although it is clear that the glass transition is triggered by the enhanced viscosity, the kinetic
0.975 0.98 0.985 0.99 0.995 1
0.8 0.82 0.84 0.86 0.88 0.9 0.92 0.94 0.96 0.98 1
–3.00E+03 2.00E+03 7.00E+03 1.20E+04 1.70E+04 2.20E+04 2.70E+04 3.20E+04
Normalized Temperature
Order parameter
viscosity
viscosity
0.00053 0.0008
0.0004 TK
Fig. 3 Temperature dependences of order parameterfor three different cooling ratesR(0.0004, 0.00053 and 0.0008). The temperature depend-ences of viscosity is also demonstrated.TKis the ideal glass transition
temperature determined to be 0.861.C,Band 0employed in the present
calculation through eqs. (19) and (20) are 1.0, 0.0316 and 500.0, respectively.
TK
0.976 0.978 0.98 0.982 0.984 0.986 0.988 0.99 0.992 0.994 0.996 0.998 1
0.8 0.82 0.84 0.86 0.88 0.9 0.92 0.94 0.96 0.98 1
Normalized Temperature
Order parameter
0.00053 0.0008
0.0004 TK
Fig. 4 Temperature dependences of order parameterfor three different cooling rates, 0,0004, 0,00053 and 0.0008.TK(vertical line) is the ideal
glass transition temperature and a solid mark on each cooling curve indicates the onset of the constancy ofwhich is defined as the glass transition temperature. C, A and 0employed in the present calculation
are 1.0, 79.0 and 500.0, respectively.
Order parameter
Normalized Temperature
T0-curve
0.4x10⁻⁵
TK
0.84 0.86 0.88 0.9 0.92 0.94 0.96 0.98 1
0.8 0.82 0.84 0.86 0.88 0.9 0.92 0.94 0.96 0.98 1
η
Fig. 2 Continuous cooling curve at the cooling rateR¼0:4105which
is normalized with respect to t. T0 curve is indicated by open
rhombus. The ideal glass transition temperature isTK¼0:861which is
[image:5.595.56.282.70.244.2] [image:5.595.312.540.75.249.2] [image:5.595.57.282.325.495.2]path towards the glass transition is more or less affected by the fluctuation. To the best of authors’ knowledge, however, the structural fluctuation in the supercooled liquid has not been well investigated yet. We point out that not only a free energy which reflects the structural information of a liquid but also fluctuation spectrum in a supercooled liquid should be implemented in the realistic simulation.
Nevertheless, the present study demonstrates that the essential features of kinetics framework of the glass transition is simulated by PPM which is the extension of the conventional CVM to time domain. This encourages us to employ Continuous Displacement Cluster Variation Method (CDCVM) for the future study of atomistic displacement and its correlation with structural and thermal stabilities associ-ated with glass transition.
Acknowledgements
The present work is supported by Grant-in-Aid for Scientific Research on Priority Areas, ‘‘Materials Science of Bulk Metallic Glasses’’ from Ministry of Education, Culture, Sports, Science and Technology.
REFERENCES
1) R. Kikuchi: Phys. Rev.81(1951) 988–1003. 2) R. Kikuchi: Prog. Theor. Phys. Suppl.35(1966) 1–64.
3) T. Mohri: Mater. Trans.46(2005) 1180–1186.
4) T. Mohri: Trans. Mat. Res. Soc. Japan30(2005) 885–887. 5) R. Kikuchi: J. Chem. Phys.60(1974) 1071–1080.
6) J. M. Sanchez and D. de Fontaine: Phys. Rev. B17(1978) 2926–2936. 7) T. Mohri, J. M. Sanchez and D. de Fontaine: Acta Metal.33(1985)
1711–1185.
8) R. Kikuchi and A. Beldjenna: Physica A182(1992) 617. 9) R. Kikuchi: J. Phase. Equilibria19(1998) 412–421.
10) R. Kikuchi and K. Masuda-Jindo: Comp. Mater. Sci.14(1999) 295– 310.
11) H. Uzawa and T. Mohri: Mater. Trans.42(2001) 422–424. 12) H. Uzawa and T. Mohri: Mater. Trans.42(2001) 1866–1869. 13) H. Uzawa and T. Mohri: Mater. Trans.43(2002) 2185–2188. 14) D. de Fontaine: Acta Metall.23(1975) 553–570.
15) T. Mohri, J. M. Sanchez and D. de Fontaine: Acta Metal.33(1985) 1463–1474.
16) P. R. Okamoto, N. Q. Lam and L. E. Rehn:Solid State Physicsvol.52. ed. by H. Ehrenreich (Elsevier Academic Press, San Diego, 1999) and references therein.
17) R. J. Glauber: J. Math. Phys.4(1953) 294–307. 18) K. Kawasaki: Phys. Rev.145(1966) 224–230.
19) T. Mohri: Properties of Complex Inorganic Solids, ed. A. Gonis, (Plenum Press, New York, 1997) pp. 83–145.
20) T. Mohri: Acta Metall.38(1990) 2455–2460.
21) T. Mohri and T. Ikegami: Defect and Diffusion Forum95–98(1993) 119–124.
22) T. Mohri: Modelling Simul. Mater. Sci. Eng.8(2000) 239–249. 23) T. Mohri: Z. Metallkunde90(1999) 71–75.
24) for instance, D. S. Sanditov, S. S. Badmaev, Sh. B. Tsydypov and B. D. Sanditov: Glass Physics and Chemistry29(2003) 2–6.