Share of costs on machine work in technologies for crop production has currently increased significantly. About machine utilization effectiveness in working pro-cess decides maximum annual utilization and realization of all agronomical and agro-technical demands. To reach high utilization of agricultural mechanization and proper setting-up of machine lines the really achieved operative performance of machines is of great importance.
For the first utilization of how the machine equipment will behave under concrete conditions are being used norms and standards of unit, portion and shift times and average real operating speed (ASAE STANDARDS
1997; ŠPELINA et al. 1983; KOVAŘÍČEK 2001). Basis for this process of projecting are often obsolete, their innovation is delayed behind rapid development of pro-duction technology and operational processes. Modern and high effective machines are equipped with monitors and control units able to accept the GPS data. The units can record real time, speed vector and selected data on machine operation-material flow, operational resistance, fuel consumption etc. (HERRMANN, PAPESCH 1996) to geographical coordinates. In the world these data are be-ing used for the field efficiency evaluation (ASAE
STAN-DARDS 1999), field speed and idle time on particular
plots. The skilled operator can analyse course of machi-ne operation during shift at graphical display of machimachi-ne trajectory above the enterprise plots map by means of suitable programmes (GIS – Geographical information system). The GIS tools enable to classify technical and production conditions of plots-communication access, size and shape (KOVAŘÍČEK et al. 1999). Just evalua-tion of machines exploitaevalua-tion parameters in relaevalua-tionship to these operational factors is a qualitative benefit of that method in comparison with classical time records.
METHOD AND PROCEDURE
Since the controlling units with reception of position coordinates in real time just now expand within the crop production of the Czech Republic, we are using the GPS receiver with data recording for machine sets monito-ring. That receiver compensates function of electronic tachometer recording the points data in adjustable inter-val of 1 s or larger. The data comprise the real time with accuracy of 1 s, geographical coordinates, speed vector and state of 2 binary inputs. The data digital record from the recorder memory is being read after connection to the PC, transformed and recorded into database of for-mat DBF III or TXT. It may be evaluated by normal ta-bular processors or in GIS. By processing of time values by tabular processors is obtained the continual overview of machine shift time structure with possibility of clas-sification-idle time, travel, machine operational time within calendar days. For determination of operative performance is required the graphical pre-processing in GIS (transfer of plots properties graphical process-ing attributes into points database) which will extend classification and reading of times, speed and travelled trajectory possibilities according to particular plots per-tinence. Necessary for this processing method also is creation of an updated digital plot map.
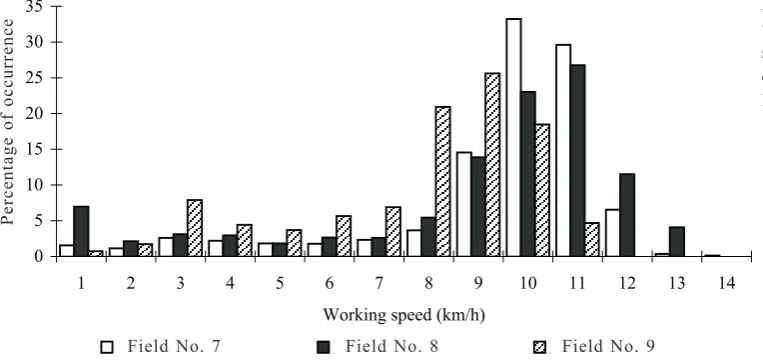
The basic for the GPS data evaluation is the principle valid for most machines in crop production: if a ma-chine is staying on the plot without motion – does not work, when is in motion – it does work or makes non-operative travel. The speed can be used as characteristic indicator for diversification of particular operation parts (Fig. 1). Average operative speed achieved on the plot is a weighted mean if the idle time is excluded (from eva-luated record the cause of idle time is unknown), we can
Results presented in this paper were obtained during solution of the Research Project MZEM05 9901 and QD 1213 (Ministry of Agriculture of the Czech Republic).
Field capacity determination from GPS spatial data
P. K
OVAŘÍČEK, J. H
ŮLAResearch Institute of Agricultural Engineering, Prague, Czech Republic
ABSTRACT: For agricultural machinery management the actually reached machines capacity has a considerable importance. The
data recorded by GPS monitoring enable to correct machines work productivity under concrete operational conditions. Assess-ment of machine aggregates operation records has proved effect of the operational factors onto operational efficiency reached on particular plots. The theoretical efficiency given by exploitation characteristics of machines has decreased effect of higher share of non-productive travels within small and irregular plots almost by 25%. In this paper we are dealing with searching for correlation between field speed and travelled unit path and defined classes of size, length and plot shape. The resulting knowledge of field efficiency on plots properties will enable to make more accurate the machines planned operation.
consider it the field speed and basis for operative perfor-mance calculation (KOVAŘÍČEK 2001).
Operative performance is calculated according to the relations:
W1 = 0.1 . Bk .vp1 (1)
W02 = W1 . K02 (2) or W02 = 0.1 . Bp . vop = 0.1 . Bk . kb . vop (3) where: W02 – effective field capacity (ha/h),
W1 – theoretical field capacity (ha/h),
Bk – theoretical operating width (m), kb – coefficient of operating width utilization, vp1 – theoretical working speed of machine (km/h),
K02 – coefficient of field time utilization,
Bp – machine operating width (m), average machi-ne width reached under operational conditi-ons, when Bp = Bk . kb,
vop – field speed (km/h), mean speed reached on plot during main and secondary activity of machine.
From the relations (1) to (3) can be derived the equa-tion validity.
v
op . kb
K02R = ––––– (4)
vp1
where: vop – field speed (km/h),
vp1 – theoretical working speed of machine (km/h),
K02R – coefficient of field time utilization derived from
the speed,
kb – coefficient of operating width utilization. In relation (4) we have indicated coefficient of opera-tive time computed from the speed as K02R, because K02 is being normally calculated by means of times (ČSN 47 0120 1987):
T
e1 Te1
K02 = –––––––––– = –––– (5)
a
Te1 + ∑ Ti T02 i = 1
where: K02 – coefficient of field time utilization,
Te1 – theoretical time (h),
Ti – operation side time (h),
T02 – field time (h), associated by times Te1 and∑Ti.
For trajectory covered by machine throughout the plot is valid:
a
Lc = L1 + ∑Li .... (6) i = 1
where: Lc – machine total trajectory covered within opera-tion on the plot (km),
L1 – machine trajectory covered within the operation
main time (km),
Li – machine trajectory covered within the operation secondary part (km),
a – number of operation secondary parts.
Provided that machine motion speed within whole plot area is sampled in such short constant interval ∆t, where speed is considered constant and a fictive variable “field speed” vop is used, then equation (6) may be expressed
b c
v0P . n . ∆t = ∑v1k . ∆t + ∑ vim . ∆t k = 1 m = 1
and provided that n = b + c, the equation may be adap-ted:
b c ∑ v1k + ∑ vim k = 1 m = 1
vop = ––––––––––––– (7)
n
where: vop – field speed (km/h),
n – number of points during machine operation on plot investigated area,
∆t – sampling interval (h),
v1k – machine instantaneous working speed (km/h),
b – number of points on plot in main time T1,
vim – machine instantaneous speed during its seconda-ry activities on plot (km/h),
c – number of points on plot during machine secon-dary activities.
Relation (7) expresses that introduced variable vop is average speed of all values of instantaneous speed du-ring operation on investigated plot area.
The field speed for each plot can be easily computed from the GPS data. Similarly available is vp1 if we have got record of state sensor signalling about machine wor-king activity according to relation:
0 5 10 15 20 25 30 35
1 2 3 4 5 6 7 8 9 10 11 12 13 14
Working speed (km/h)
Pe rc en ta ge o f o cc ur en ce (% )
Field no. 7 Field no. 8 Field no. 9
Fig. 1. Frequency of theoretical working speed during the work of cultivator CLD 4.7 Kverneland
Field No. 7 Field No. 8 Field No. 9
[image:2.595.68.450.58.239.2]b ∑ v1k k = 1
vp1 = ––––––– (8)
b
where: vp1 – theoretical working speed (km/h),
v1k – actual working speed in the k work sample (km/h),
b – number of points on plots within main time T1.
RESULTS AND DISCUSSION
The GPS assessed data processing is presented in example of machine set work of tractor CASE 7320 and blade tiller Kverneland CLD 4.7 of construction operating width of 4.7 m. The set skimmed stubble after maize and grain crops in autumn.
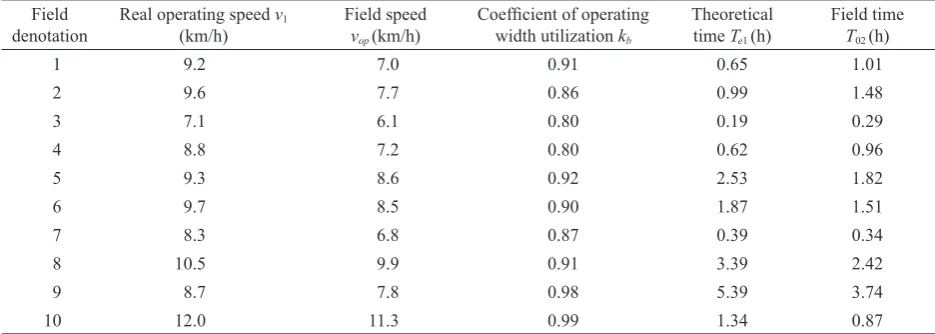
From the data transformed to GIS TopoL we have read-off the plots parameters (Table 1), points number of non-zero speed, number of field time spent in drive in the plot broadest width and real field speed on each plot. If in the data is not the operation indication by means of the state sensor then it is problematic to determine the machine theoretical working speed vp1. In that case is be-ing used real workbe-ing speed v1 (Table 2) what is average
of instantaneous speed from point choice on plot charac-terizing the machine continual operation. For its calcula-tion are excluded points on plot to determined distance from headland and idle time points. For machines used for soil tillage it depends on soil properties, machine adjustment and aggregated energy source the nearest is
vpl (1). In our case its range is from 7.1 to 12.0 km/h. It serves for determination of work theoretical time on plot
Te1 (Table 2) at construction machine operating width from investigated plot acreage.
The field time spent in drive T02 is being determined from the read-off points number on the plot and constant interval for data exampling. The determination of ope-rative coefficient of time K02 utilization by method of calculations from times Te1 and T02 (5) is being used in case when the machine operation indication by means of state sensor is not available.
[image:3.595.65.533.384.564.2]If the state sensor signal on machine operative activity is available then for determination of the operative coef-ficient of time K02R utilization the simplified calculation by means of speed according to relation (4) is sufficient. From comparison of field time utilization coefficient (Fig. 2) is evident regularly lower K02 determined from the times. This has a logical reason, because the time Te1
Table 1. Parameters of field Field
denotation Plot acreage(ha)
Average length of field
(m)
Maximal width
(m) Contour of field
Slope of field (°)
Number of points monitored
Number of runs
1 2.8 172.5 162 triangle 0–2 1,206 38
2 4.5 256.1 174 trapezoid 2–5 1,781 43
3 0.6 142.4 45 trapezoid 0 346 12
4 2.6 212.8 120 trapezoid 0 1,146 32
5 11.0 578.5 191 trapezoid 0 2,185 44
6 8.5 411.0 208 completely irregular 0 1,811 49
7 1.5 103.4 148 trapezoid 0 409 36
8 16.7 1,112.5 150 trapezoid 0 2,898 35
9 22.0 370.3 593 trapezoid 0 4,489 129
10 7.5 898.6 84 rectangle 0–2 1,039 18
Table 2. Basic exploitation of CASE 7320 and cultivator CDL 4.7 Kverneland Field
denotation Real operating speed v(km/h) 1 Field speedvop(km/h) Coefficient of operatingwidth utilization kb Theoreticaltime Te1 (h)
Field time T02 (h)
1 9.2 7.0 0.91 0.65 1.01
2 9.6 7.7 0.86 0.99 1.48
3 7.1 6.1 0.80 0.19 0.29
4 8.8 7.2 0.80 0.62 0.96
5 9.3 8.6 0.92 2.53 1.82
6 9.7 8.5 0.90 1.87 1.51
7 8.3 6.8 0.87 0.39 0.34
8 10.5 9.9 0.91 3.39 2.42
9 8.7 7.8 0.98 5.39 3.74
[image:3.595.63.531.593.760.2]is always lower than real T1, which is logically longer in consequence of deceleration at the beginning and end of the operational drive. The difference 2÷3% as result of estimation is neglected. Nevertheless significant is dependence of field time spent in drive coefficient on the plot acreage (Fig. 3) or other plot parameters where difference is 25% and more. The extreme point of coef-ficient K02R belongs to the plot No. 10 witch is in the in-vestigated complex the only of the regular contour. That deviation gives a signal that the plot size must not be the suitable primary independent variable for plot operative characteristics. This alternative should be focused du-ring following machines investigation.
CONCLUSION
The machines field speed can not be obtained by the short-time record. Knowledge of the coefficient depen-dence course of the field time utilization on operative conditions will enable us to estimate operative perfor-mances we shall reach on our fields. Advantage of the machines operation evaluating method by means of GPS is possibility of automated data processing in GIS above the plots digital map. The machines exploitation parameters evaluation in relationship to the concrete
operational factors is a qualitative benefit of this method compared with classical time record.
References
ASAE STANDARDS D497.3 NOV1997 Agricultural Machinery Management Data, 1997.
ASAE STANDARDS, 1999, 46th Ed., St. Joseph.
ČSN 47 0120 1987. Měření metody času a stanovení provozních ukazatelů.
HERRMANN A., PAPESCH J., 1996. Schlaggröße. Landtechnik, 51: 50–51.
KOVAŘÍČEK P., 2001. Analýza faktorů ovlivňujících výkon-nost strojů na hnojení, zpracování půdy a setí. [Kandidátská dizertační práce.] Praha, VÚZT: 118.
KOVAŘÍČEK P., HŮLA J., MAYER V., 1999. The agriculture machines operations monitoring by the navigation systems GPS and DGPS. In: Trends in Agricultural Engineering. TAE99, Prague, Czech University of Agriculture: 200–208. ŠPELINA M. et al., 1983. Strojní linky v zemědělství a jejich
ekonomika. Praha, SZN: 288.
Received for publication April 25, 2003 Accepted after corrections July 16, 2003
0.4 0.5 0.6 0.7 0.8 0.9 1
1 2 3 4 5 6 7 8 9 10
Field denotation
C
oe
ff
ic
ie
nt
K
02
o
r K
02
R
K02 appointed from time K02R appointed from speed
y = 0.0709Ln(x) + 0.6628 R2 = 0.615
0.6 0.7 0.8 0.9 1.0
0 5 10 15 20 25
Plot acreage (ha)
C
oe
ff
ic
ie
nt
K02R
K02 appointed from speed K02R appointed from speed
C
oe
ff
ic
ie
nt
K02
R
C
oe
ff
ic
ie
nt
K02
o
r
K02
R
K02 appointed from time K02R appointed from time
K02 appointed from speed K02R appointed from speed
Fig. 2. Coefficient cal-culated from GPS clock data K02 or from GPS
vector of speed K02R
Stanovení operativní výkonnosti z prostorových dat GPS
ABSTRAKT: Pro řízení zemědělské techniky má velký význam skutečně dosahovaná výkonnost strojů. Data zaznamenaná
při monitorování pomocí GPS mám umožňují korigovat produktivitu práce strojů v konkrétních provozních podmínkách. Při hodnocení záznamů práce strojních souprav pro zpracování půdy a hnojení se prokázal vliv provozních faktorů na operativní výkonnost dosaženou na jednotlivých pozemcích. Teoretická výkonnost daná exploatačními charakteristikami stroje se sni-žuje vlivem většího podílu neproduktivních jízd na malých a tvarově nepravidelných pozemcích až o 25 %. Mezi průměrnou operativní rychlostí nebo ujetou jednotkovou dráhou na pozemcích a definovanými třídami velikosti, délky a tvaru pozemků existuje korelace. Z ní vyplývající znalost závislosti operativní výkonnosti na provozních vlastnostech pozemků umožní zpřesnit plánované nasazení strojů.
Klíčová slova:řízení strojních linek; operativní výkonnost; prostorová data; GPS
Corresponding author: