Different ways of setting land aside, especially different vegetation cover of such plots, different ways of their establishment, development during vegetation period, and production of above-ground and below-ground biomass can influence changes of abiotic parameters of these stands. Average year production of biomass is very diverse. According to Brant et al. (2000) the biomass production on one to three year fallow fluctuated between 3.1–6.8 t/ha, according to management type. Gisi et al. (1990) pointed out that spontaneous succession can lead to variable changes in intensity of abiotic factors, which in reverse influence the development of the coenoses. Vegetation cover itself influences also soil moisture. Trefflich and Fritzsch (1997) settled lower soil moisture in depth of 0–70 cm during the period from April to October on spontaneous fallow compared to bare ground. Annual course of soil moisture is strongly influenced by precipitation and its distribution during the year, soil potential of water retention and also by the processes of water usage, such as evapotranspiration. Even if
the total precipitation of the observation time is high, its non-uniform distribution leads to periods with tense water state. It was found by testing the water content in the soil on set aside at arable land in different depths that the highest withdrawal was in 1 m depth in July (Trefflich and Fritzsch 1997). The same authors found-out that the highest water withdrawal on spontaneous fallow established on arable land took place in depths of 0–10 cm and 10–30 cm in the period from middle of July until beginning of September (200th to 250th day of the
year). Higher soil moisture was detected in depth of 0–10 cm, compared to 10–30 cm depth. The water content directly near the soil surface plays an essential role for degradation of natural organic material and agrochemicals by soil microbes (Hood 2001, Ruth and Munch 2005). The fluctuation of soil moisture, especially in upper soil layers, influences negatively seed germination and emer-gence (Boyd and Acker 2003); this can influence crop and weeds development on the stand. The influence of different water availability onto seed
The influence of different soil vegetation covers
onto the volumetric water content in upper soil layers
V. Brant, J. Pivec, V. Venclová, J. Soukup, J. Holec
Czech University of Agriculture in Prague, Czech Republic
ABSTRACT
The influence of different vegetation cover of the set aside land on the volumetric water content VWC (%) and its variations during the day in upper soil layers (5 and 15 cm) using the TDR method was observed in 15 min intervals from May to August in 2002 and 2003. A spontaneous fallow was established in autumn 2001 and plots with arti-ficial revegetation sowed with grass-legume mixture ofDactylis polygama Horv. and Trifolium repens L. in spring 2002. The experimental plots were mulched twice during the vegetation period. VWC (%) was registered in the same time also on bare ground. The control plot was sown with crops (Brassica napus L. – 2002 and Triticum aes-tivum L. – 2003) and regular tillage using ploughing was applied. The highest values of VWC (%) during observed period were recorded on bare ground. The values of VWC (%) on set aside soil with vegetation cover and on control plot were lower. The lowest values of VWC (%) were recorded in 5 cm depth on plot sowed with grass-legume mix-ture of D. polygama and T. repens. Values of VWC (%) on spontaneous fallow were lower in depth of 15 cm compa-red to the 5 cm depth. The highest variation of daily VWC (%) run was recorded on bare ground.
Keywords: sed aside land; spontaneous fallow; artificial revegetation; bare ground; grass-legume mixture; volumet-ric water content (VWC); fluctuation of VWC
germination of wheat, canola and various weed species was documented by Boyd and van Acker 2004. Fluctuation of soil moisture is influenced not only by vegetation cover, but also by soil till-age, which in general determines hydrophysical properties of the soil (Matula 2003). According to Kováč et al. (2005), soil moisture is significantly influenced by following factors (listed by impor-tance): weather course, planted crop, soil tillage, rooting depth, measuring depth, and reciprocal interactions of these factors. Determination of the relationship between vegetation cover and soil moisture fluctuation in upper soil layers can lead to consideration of its impact onto the previously listed factors and establishing the possibilities of their modifying.
MATERIAL AND METHODS
The aim of this trial was to evaluate the influence of different ways of setting soil aside (spontaneous fallow, artificial revegetation and bare ground) onto the volumetric water content (VWC) in up-per soil layers during the up-period from May to August. Variants were established in autumn 2001 on experimental field of the Czech University of Agriculture at experimental station in Červený Újezd. The station is located 405 meters above sea level. Average soil texture of the experimental plots measured in spring 2002 was following: soil parti-cles smaller than 0.01 mm 53.21%, 0.01–0.05 mm 38.54%, 0.05–0.1 mm 2.32% and 0.1–2 mm 5.93%. Volumetric soil weight using physical cylinders was settled on tested plots in spring 2002 and 2003 in soil depths 0–5, 5–10, 10–15, and 15–20 cm in four replications on each plot (Table 1).
Experimental variants. Triticum aestivum L. (winter wheat) was used as a forecrop before trial establishment. After T. aestivum harvest (August
2001) the soil was shallow tilled to the depth of 10 cm. On such tilled stands, variants representing spontaneous fallow (A) and bare ground (C – chem-ically treated) were established in autumn 2001. Brassica napus L. (winter oil seed rape) stand estab-lished after plowing (20 cm depth) also in autumn 2001 was used as a control variant (D). In spring 2002 after secondary tillage artificial revegetation (B) took place by sowing grass-legume mixture of Dactylis polygama Horv. (cv. Tosca) a Trifolium repens L. (cv. Hájek) – 15 + 6 kg/ha. On variant D T.aestivum (winter wheat) was sowed in 2002 after B. napus harvest and subsequent ploughing. The area of each experimental plot was 60 m2 (6 m ×
10 m). Variants A and B were twice mulched in each year (17.6.2002 and 30.9.2002, in following year 19.6.2003 and 30.9.2003). Bare ground was treated three times by herbicide Roundup Klasik in dose 3 l/ha during the vegetation period. On variants A and B there was evaluated above ground biomass production in the time of mulching using modified combine weight-count method (Brant et al. 2000). Table 2 documents marking and descrip-tion of variants.
Soil volumetric water content measuring.
[image:2.595.66.535.78.219.2]Soil volumetric water content was measured on
Table 1.Volumetric soil weight (g/cm3) in the A, B, C and D variants during the 2002 and 2003 year
Soil layer
Variant, date of assessment
18.4.2002 23.4.2003
A B C D A B C D
0–5 cm 1.34 1.32 1.33 1.33 1.49 1.51 1.48 1.41
5–10 cm 1.46 1.56 1.57 1.49 1.60 1.57 1.59 1.42
10–15 cm 1.55 1.57 1.55 1.56 1.61 1.55 1.56 1.52
15–20 cm 1.54 1.56 1.56 1.59 1.52 1.53 1.56 1.50
+/– limits 0.15 0.18
Table 2. Variant description and their labelling
Variant
labelling Variant description
A spontaneous fallow
B artificial revegetation (and Trifolium repens) Dactylis polygama
C bare fallow
[image:2.595.302.533.623.763.2]experimental plots during the years 2002–2003 using sensors CS 615 – (Campbell Scientific, USA – TDR method) placed horizontally in depths of 5 and 15 cm. Sensors were placed in the middle of the plot one above the other (one sensor in each depth), installed 5.4.2002 on all the variants A–D. In September 2002 the sensors were taken off the soil on the variant D and then reinstalled again in relation to soil tillage for T. aestivum stand establishment. Another taking off and reinstal-lation took place at 1.8.2003 as a result of soil tillage for succeeding crop. Measuring of VWC (%) was realised in 15 min intervals during the whole measuring period.
Response of sensor has a triple dependency, ac-cording to manufacturer. VWC depends first on electrical conductivity of soil. The used calibration algorithm (for 3 dS/m) was (eq. 1):
VWCu = –0.298 + 0.361τ + 0.096τ2 (1)
where: VWCu is uncorrected volumetric water content, τ is the CS 615 output period in milliseconds. Further VWC depends on soil moisture, which expresses temperature coefficient (eq. 2), variation of VWC with temperature change by 1°C:
tcoef = –3.46×10⁻⁴ + 0.019VWC
u – 0.045VWCu2 (2)
Finally VWC depends on soil temperature, ex-pressed by ∆t = (t – 20) tcoef
Final corrected value of volumetric water content VWCc was than expressed by algorithm (eq. 3):
VWCc = VWCu – (t – 20) tcoef (3)
The dielectric constant of soil was determined by Persson (2002). Precipitation was measured by rainfall detector RS03 (Fiedler, CZ). Statistical analysis was counted using STATGRAPHICS®Plus,
ver. 4.0, ANOVA, Tukey method (α = 0.05).
RESULTS
In the year 2002 in particular months (from May to August) the highest average daily VWC (%) during month was detected on bare ground (C) in 5 cm depth. VWC (%) on variant C was statisti-cally significantly higher in all months compared to VWC (%) in 5 cm depth on variants A, B and D (Table 3). Compared to other variants (A, C and D), the WVC (%) on variant B was statis-tically significantly the lowest in all evaluated months (Table 3). The highest average daily values
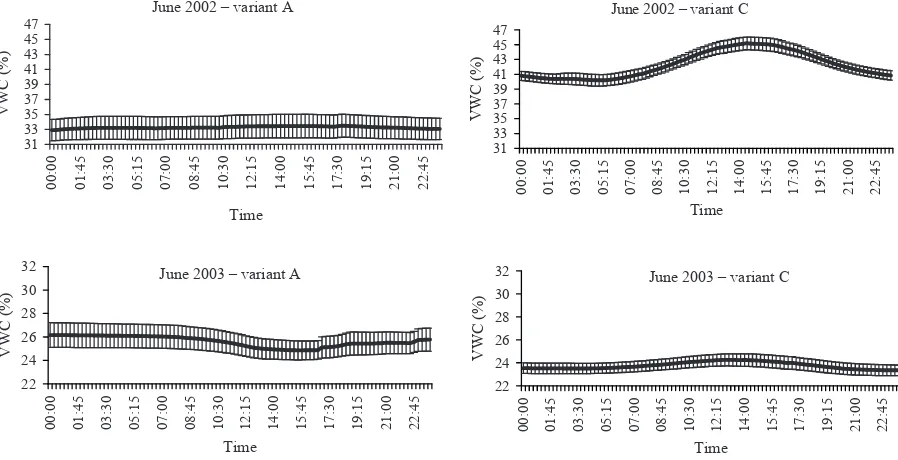
of VWC (%) in 15 cm depth in 2002 were detected on bare ground (C, Table 3). In 2002 the highest daily variation of soil moisture (daily maximum – daily minimum) in 5 cm depth was detected on bare ground (C, Table 4). Average daily differences between maximum and minimum VWC (%) were statistically significantly higher on variant C com-pared to other variants (Table 4). Lower differences between maximum and minimum VWC (%) were recorded in the depth of 15 cm compared to the values in 5 cm depth (Table 4). In 15 cm depth, the highest VWC (%) variation was recorded on vari-ant C (bare ground, Table 4). The Figure 1 shows the average daily course of VWC (%) including confidence interval (α = 0.05) in June 2002 on
variants A and C.
In the time of first mulching (17.6.2002) the total biomass production on spontaneous fallow (A) was 4.36 t/ha. The highest share of biomass production was represented by volunteer wheat (T. aestivum) – 3.31 t/ha. Other dominant species in biomass production were Matricaria maritima, Galium aparine and Cirsium arvense. On artifi-cially revegetationed fallow the total production of aboveground biomass was 2.23 t/ha (the pro-duction of T. repens was0.78 t/ha).
In 2003 (May–July) significantly lowest VWC (%) in 5 cm depth was on variant D compared to other plots (Table 3). The situation was similar in 15 cm depth (Table 3). Significantly highest VWC (%) in 15 cm compared to variants A, B and D was on variant C (Table 3). The highest variation in daily soil moisture (daily maximum – daily minimum) in 5 cm depth was detected on variant D. The differ-ences between daily maximum and daily minimum of VWC (%) were obtained lower in 15 cm depth compared to 5 cm depth values (Table 4). Figure 1 is documenting the average daily course of VWC (%) in June 2003 on variants A and C, including the intervals of confidence (α = 0.05).
After first mulching (19.6.2003), the total bio-mass production on bare ground (A) was 3.98 t/ha. According to aboveground biomass production dominant species was C. arvense (3.74 t/ha). The production of dry matter on revegetationed fallow was 3.83 t/ha. Production of sowed T. repens was1.71 t/ha and of D.polygama 0.30 t/ha. Dominant weed species on variant B was C. arvense (1.52 t/ha).
Table 3. Daily average volumetric water content (%) in the 5 and 15 cm depths based on the daily mean values, calculated from 15 minutes interval of measurement in the months of the 2002 and 2003 years
Month
Variant/year
A B C D +/– limits
2002 2003 2002 2003 2002 2003 2002 2003 2002 2003 Depth 5 cm
May1 33.94 31.90 27.20 27.73 42.41 27.94 34.07 16.37 2.16 3.51
June2 34.36 25.61 24.82 21.45 43.71 23.76 33.51 11.38 2.48 1.25 July3 38.02 29.16 25.42 26.08 43.43 29.57 34.41 16.05 2.34 3.30
August4 39.40 21.70 32.49 19.07 42.15 25.93 36.05 – 2.59 1.81
+/– limits
(differences 2 – 1, 3, 4)* 2.44 3.03 2.78 2.98 1.34 1.91 2.78 2.74 +/– limits
(remainder differences)* 1.22 3.00 1.39 2.96 0.67 1.90 1.39 2.72 Depth 15 cm
May1 32.68 29.92 43.76 29.91 42.78 36.00 33.48 22.69 1.15 1.70
June2 34.99 24.30 38.37 24.67 46.01 31.97 35.08 16.37 1.82 0.90 July3 37.78 25.33 35.28 26.33 47.61 32.15 35.44 18.15 1.38 1.95
August4 37.24 23.50 40.81 23.49 46.95 34.16 37.57 – 2.05 1.63
+/– limits
(differences 2 – 1, 3, 4)* 2.11 1.88 1.53 1.69 1.05 1.09 1.71 1.69 +/– limits
(remainder differences)* 2.09 1.86 1.51 1.67 1.04 1.09 1.70 1.67
*limit differences given by different number of days in the months
Table 4. Fluctuation of volumetric water content in the 5 and 15 cm depths based on the averages of daily Max and Min VWC differences, measured in 15 minutes interval during 2002 and 2003 years
Month
Variant
A B C D +/– limits
2002 2003 2002 2003 2002 2003 2002 2003 2002 2003 Depth 5 cm
May1 1.84 2.46 2.30 2.31 4.79 2.56 2.40 3.53 1.35 2.02
June2 1.93 2.44 2.68 2.17 5.98 1.25 2.06 2.81 1.59 1.75
July3 2.10 3.38 2.86 4.14 5.67 4.41 2.13 4.95 1.83 3.57
August4 2.10 1.24 2.61 1.07 4.51 1.83 2.46 – 1.61 0.59
+/– limits
(differences 2 – 1, 3, 4)* 1.35 1.96 1.99 2.68 1.28 2.15 1.74 2.35 +/– limits
(remainder differences)* 1.34 1.95 1.97 2.65 1.27 2.13 1.73 2.33 Depth 15 cm
May1 0.57 1.23 1.65 0.97 2.39 1.26 0.49 1.34 0.49 1.23
June2 1.14 0.38 1.35 0.97 3.45 0.95 1.16 0.51 1.15 1.49
July3 1.13 0.88 0.70 1.96 3.77 1.10 0.94 1.42 0.97 2.11
August4 1.41 0.55 0.94 0.41 3.00 1.52 1.02 – 0.92 0.29
+/– limits
(differences 2 – 1, 3, 4)* 1.05 0.97 0.80 2.28 0.82 0.48 0.96 1.48 +/– limits
(remainder differences)* 1.04 0.96 0.79 2.26 0.81 0.48 0.95 1.47
[image:4.595.65.532.462.739.2]during period May–August 2002 and 2003 are presented in Table 5.
DISCUSSION
Generally, in 2002, the highest VWC (%) for assessed depth of soil was observed on the bare ground (C), obtained in the monitoring period. In the year 2003, which was characterized by low precipitation activity, the highest value of VWC (%) in depth of 15 cm was observed on the bare ground. Only on plot A in May and June (2003) the VWC (%) obtained in depth of 5 cm was higher than the one on the bare ground. In other months there was again the highest observed VWC (%) value on the plot C. In accordance with the results published by Trefflich and Fritzsch (1997), who assessed low wetness of soil in the layer of 0–70 cm on spontaneous fallow land from March to October in comparison with fallow land without vegetation cover. The reason is probably decrease of water content in soil as a consequence of the transpiration of vegetation cover. In 2002, the lowest VWC (%) was assessed on the deliberately revegetationed fallow land seeded with mixture of D. polygama and T. repens (B) – Table 3. T. repens had the majority among all sowed species on the plot. The reason causing the decrease of VWC (%) on plot B in comparison with the other variants is probably the proportion of T. repens which estab-lishes its roots particularly in the upper layer of
soil, creates roots on its creeping stems and then utilizes water especially from this rooted layer of soil. According to Gibson and Cope (1985), the majority of T. repens root system is found in upper layer of soil to 20 cm. Another reason leading to the decrease of VWC (%) values on plot sowed with T. repens may be the lost of interceptions caused by the high density and the high level of coverage of the ground cover decrease the rate of precipitation water penetrating the soil. This fact is pounced although by Trefflich and Fritzsch (1997).
[image:5.595.73.522.62.292.2]In the year 2002 on the spontaneous fallow (A) and on the plots with B. napus (D) the VWC (%) was higher in 5 cm depth and lower in 15 cm depth then on the plot B. This is in accordance with the findings of Trefflich and Fritzsch (1997), who assessed on spontaneous fallow land higher wetness in the depth of 0–10 cm than in the layer of 10–30 cm. Lower root presence in the upper lay-ers of soil and more intensive rooting in the lower part of the soil profile and consequently subsoil horizon can explain this fact. This contributes to drawing of water from the lower layers of soil by plants. On the plot A were T. aestivum (volunteer forecrop) and M. maritima the most dominant species for the observed period of time (2002). For this species, deeper rooting in soil profile can be presumed. Schilling (2000) reported, that the depth of roots of T. aestivum reach up to 2.8 m in non-disturbed profile. Similarly to that, B. na-pus plants influenced the VWC (%) on plot D. In accordance with Fábry (1992), 87% of root mass
Figure 1. Daily average volumetric water content in the 5 cm depth including the interval of reliability (α = 0.05),
variants A and C in June 2002 and 2003; based on the daily mean values, calculated from 15 minute intervals of measurement
June 2002 – variant A
31 33 35 37 39 41 43 45 47 00 :0 0 01 :4 5 03 :3 0 05 :1 5 07 :0 0 08 :4 5 10 :3 0 12 :1 5 14 :0 0 15 :4 5 17 :3 0 19 :1 5 21 :0 0 22 :4 5 Time V W C (% )
June 2002 – variant C
31 33 35 37 39 41 43 45 47 00 :0 0 01 :4 5 03 :3 0 05 :1 5 07 :0 0 08 :4 5 10 :3 0 12 :1 5 14 :0 0 15 :4 5 17 :3 0 19 :1 5 21 :0 0 22 :4 5 Time V W C (% )
June 2003 – variant A
22 24 26 28 30 32 00 :0 0 01 :4 5 03 :3 0 05 :1 5 07 :0 0 08 :4 5 10 :3 0 12 :1 5 14 :0 0 15 :4 5 17 :3 0 19 :1 5 21 :0 0 22 :4 5 Time V W C (%
) June 2003 – variant C
of B. napus has been found in topsoil, lower part (about 13%) in depth of range from 22.5 to 45 cm. Trefflich and Fritzsch (1997) consider the root-depth of plants growing on given post as one of the significant factors which affect the VWC (%) values in soil profile. Also in 2003 similar effect of vegetation cower on VWC (%) in evaluated layers of soil was reported. However on plot A, the most dominant species was C. arvense. In this year the values of VWC (%) were lower in comparison with 2002, because of the deficit of precipitation (Table 5). The precipitation deficit caused the decrease of VWC (%) in layer of 5 cm on plot C compared with plot A.
The values of VWC (%) on the bare ground (A) in the depth of 15 cm were higher than on the revegetationed fallow (plots A and B) according
to the results by Trefflich and Fritzsch (1997). On the plot D, a significant decrease of VWC (%) was reported in 2003 compared with 2002 as a result of lack of precipitation. The reason of the decrease was soil tillage using plough, which causes under the given range of precipitation in 2003 the dis-continuation of upper layer of soil.
[image:6.595.180.512.61.450.2]In 2002, the largest fluctuation of VWC (%), i.e. the difference between daily minimum and maximum, was observed on bare ground. The re-ported progress of the daily temperature averages shows that the highest values of VWC (%) were observed from 2 p.m. to 4 p.m. (Figure 1). This can be a result of water move in soil through capillary pores in the time of intensive evaporation. The sufficient supply of water in lower layers of soil in particular texture of soil, which can ensure the
Figure 3. Daily course of the average volumetric water content in the 5 cm and 15 cm depths, variants A, B, C and D from May to August 2003 plus daily precipitation totals (mm) in the period observed
Figure 2. Daily course of the average volumetric water content in the 5 cm and 15 cm depths, variants A, B, C and D from May to August 2002 plus daily precipitation totals (mm) in the period observed
10 30 50
1.5.02 22.5.02 12.6.02 3.7.02 24.7.02 14.8.02 A – 15 cm A – 5 cm
V
W
C
(%
)
10 30 50
1.5.02 22.5.02 12.6.02 3.7.02 24.7.02 14.8.02 B – 15 cm B – 5 cm
V
W
C
(%
)
10 30 50
1.5.02 22.5.02 12.6.02 3.7.02 24.7.02 14.8.02 C – 15 cm C – 5 cm
V
W
C
(%
)
10 30 50
1.5.03 22.5.03 12.6.03 3.7.03 24.7.03 14.8.03 A - 15 cm A – 5 cm
V
W
C
(%
)
10 30 50
1.5.03 22.5.03 12.6.03 3.7.03 24.7.03 14.8.03 B – 15 cm B – 5 cm
V
W
C
(%
)
10 30 50
1.5.03 22.5.03 12.6.03 3.7.03 24.7.03 14.8.03 C – 15 cm C – 5 cm
V
W
C
(%
)
10 30 50
1.5.02 22.5.02 12.6.02 3.7.02 24.7.02 14.8.02 D – 15 cm D – 5 cm
V
W
C
(%
)
0 30 60
1.5.02 22.5.02 12.6.02 3.7.02 24.7.02 14.8.02
Pr
ec
ip
ita
tio
n
10 30 50
1.5.03 22.5.03 12.6.03 3.7.03 24.7.03 14.8.03 D – 15 cm D – 5 cm
V
W
C
(%
)
0 30 60
1.5.03 22.5.03 12.6.03 3.7.03 24.7.03 14.8.03
Pr
ec
ip
ita
tio
n
(
[image:6.595.84.388.61.443.2]creation of pores, especially the capillary ones, is the precondition for formatting the recorded fluctuation of VWC (%) on the bare ground (C). As a result of low precipitation in 2003, the dif-ference in fluctuation of daily values of VWC (%) was not so noticeable on the evaluated plots, but the trend of daily development of VWC (%) was similar as in 2002 on bare ground (C). Our results show that the presence of vegetation cover of the soil on fallow is connected with the decrease of VWC (%) values compared to bare ground. On the other hand, vegetation cover eliminated the fluctuation of VWC (%) during the day.
REFERENCES
Boyd N., van Acker R. (2003): The effects of depth and fluctuating soil moisture on the emergence of eight annual and six perennial plant species. Weed Sci., 51: 725–730.
Boyd N., van Acker R. (2004): Seed germination of common weed species as affected by oxygen con-centration, light, and osmotic potential. Weed Sci., 52: 589–596.
Brant V., Šantrůček J., Svobodová M. (2000): Einfluss der Bewirtschaftung von Stillegungsflächen auf die Verunkrautung. Z. Pfl.-Krankh. Pfl.-Schutz, Sonderh., XVII: 105–112.
[image:7.595.72.532.91.232.2]Fábry A. (1992): Olejniny. MZe, Praha.
Table 5. Monthly precipitation totals (mm) and monthly average air temperatures (°C) at the experimental place (from May to August) in the years 2002 and 2003
Month 2002 2003
precipitation temperature precipitation temperature
May 77 15.4 62 15.2
June 97 17.6 24 20.1
July 78 18.8 84 19.0
August 163 19.3 12 21.1
Σ (mm) 415 182
Average (°C) 17.8 18.9
Gibson P.B., Cope W.A. (1985): White Clover. In: Tailor N.L. (ed.): Clover Science and Technology. Madison, Wisconsin: 471–490.
Gisi U., Schenker R., Schulin R., Stadelmann F.X., Sticher H. (1990): Bodenökologie. Thieme Verlag, Stuttgart, New York.
Hood R. (2001): The effect of soil temperature and moisture on organic matter decomposition and plant growth. Isot. Environ. Health Stud., 37: 25–41. Kováč K., Macák M., Švančárková M. (2005): The effect
of soil conservation tillage on soil moisture dynamics under single cropping and crop rotation. Plant Soil Environ., 51: 124–130.
Matula S. (2003): The influence of tillage treatments on water infiltration into soil profile. Plant Soil En-viron., 49: 298–306.
Persson M. (2002): Evaluating the linear dielectric con-stant-electrical conductivity model sing time domain reflectometry. Hydrol. Sci. J., 47: 269–278.
Ruth B., Munch J.C. (2005): Field measurements of the water content in the top soil using a new capacitance sensor with a flat sensitive volume. J. Plant Nutr. Soil Sci. Z. Pfl.-Ernähr. Bodenkde, 168: 169–175. Schilling G. (2000): Pflanzenernährung und Düngung.
Eugen Ulmer Verlag, Stuttgart.
Trefflich A., Fritzsch J. (1997): Mikroklimatische Para-meter und Synphänologie der Vegetation auf verschie-denen Brachen. In: Feldmann R. (ed.): Regeneration und nachhaltige Landnutzung: Konzepte für Belastete Regionen. Springer Verlag, Berlin, Heidelberg, New York: 169–181.
Received on June 30, 2005
Corresponding author: