From the aspect of human health, the fatty acid (FA) composition of meat products is an impor-tant parameter of meat quality. With the recog-nition that the groups of polyunsaturated fatty acids (PUFA) each play their own metabolic roles in health promotion, the role of the
polyunsatu-rated/saturated FA ratio has decreased while the importance of the total n-6/n-3 ratio or even only linoleic acid/α-linolenic acid ratio has increased (Bruckner, ex Dublecz et al., 2004).
In human diets, there is a considerable lack of n-3 PUFA and also an imbalance in the ratio of
Supported by the Ministry of Education, Youth and Sports of the Czech Republic (Project No. MSM 6215648905).
Poultry meat production as a functional food with
a voluntary n-6 and n-3 polyunsaturated fatty acids ratio
D. Schneiderová, J. Zelenka, E. Mrkvicová
Faculty of Agronomy, Mendel University of Agriculture and Forestry, Brno, Czech Republic
AbstrAct: We studied the effect of different levels of linseed oils made either of the flax cultivar Atalante
with a high content of α-linolenic acid (612 g/kg) or of the cultivar Lola with a predominating content of lino-leic acid (708 g/kg) in a chicken diet upon the fatty acid pattern in meat. Cockerels Ross 308 were fed the diets containing 1, 3, 5 or 7 per cent of oil in the last 15 days of fattening. Breast meat (BM) and thigh meat (TM) without skin of 8 chickens from each dietary group were used for analyses. The relative proportions of fatty acids were expressed as percentages of total determined fatty acids. When feeding Atalante oil, the proportions of n-6 fatty acids were highly significantly lower while those of n-3 fatty acids were higher; the ratio of n-6/n-3
polyunsaturated fatty acids in meat was narrower (P < 0.001) than in chickens fed oil with a low content of
α-linolenic acid. In BM and TM, the relative proportions of α-linolenic and γ-linolenic acids were nearly the same, the proportion of linoleic acid in BM was lower, and the proportions of the other polyunsaturated fatty acids in BM were higher than in TM. In BM, the ratio of n-6/n-3 polyunsaturated fatty acids was significantly
(P < 0.001) more favourable than that found in TM. The relative proportions of total saturated and
monounsatu-rated fatty acids in meat decreased and those of polyunsatumonounsatu-rated fatty acids increased significantly (P < 0.01) in
dependence on the increasing level of dietary oils. When feeding Atalante oil, a significant increase in the propor-tion of linoleic acid in BM but not in TM was observed. The proporpropor-tions of the other n-6 fatty acids decreased and those of all determined n-3 fatty acids, with the exception of docosahexaenoic acid, significantly increased with the increasing level of oil in the diet. When feeding Lola oil, its increasing content in the diet increased the relative proportion of linoleic acid as well as its elongation to γ-linolenic acid; however, the proportions of
ara-chidonic and adrenic acid did not change significantly (P > 0.05). The proportion of α-linolenic acid increased
in both BM and TM. The proportion of eicosapentaenoic and clupanodonic acids in BM significantly decreased. The ratio of n-6 to n-3 polyunsaturated fatty acids ranged from 0.9 to 13.6 and from 1.0 to 17.2 in BM and TM, respectively. An increase in the level of Lola oil in the diet by 1% caused that the n-6/n-3 polyunsaturated fatty acid ratio extended by 1.00 and 1.19 units in BM and TM, respectively. Dependences of n-6/n-3 ratio on the level of Atalante oil were expressed by equations of convex parabolas with minima at the level of oil 5.8 and 5.9% for BM and TM, respectively. By means of the inclusion of linseed oil with a high content of α-linolenic acid in the feed mixture it would be possible to produce poultry meat as a functional food with a very narrow ratio of n-6/n-3 polyunsaturated fatty acids.
n-6/n-3 PUFA. Current estimates in Western cultures suggest the ratio of n-6 to n-3 fatty ac-ids of 10 to 20:1 instead of recommended 1–4:1 (Simopoulos, 1999). The intake of n-3 PUFA is low because of a low consumption of sea fish which represent the major source of n-3 PUFA, especially of eicosa-pentaenoic and docosahexaenoic acids. A partial solution of this situation could be reached on the basis of production of suitable functional foods with an adjusted content of PUFA which can provide beneficial physiological effects beyond the widely accepted nutritional effects. The enrichment of poultry products with n-3 PUFA may provide an excellent alternative source of these acids in the human diet due to their relative availability and affordability (Van Elswyk, 1997).
For most animal species only linoleic acid (LA; C18:2n-6) and α-linolenic acid (LNA; C18:3n-3) can be considered as essential. The majority of n-6 and n-3 series PUFA are synthesised from LA and LNA supplied in food (Youdim et al., 2000). By means of a series of desaturation and elongation reactions LA is transformed to γ-linolenic (C18:3n-6), dihomo-γ-linolenic (C20:3n-6), arachidonic (AA; C20:4n-6) and adrenic (ADA; C22:4n-6) acids while LNA is changed to stearidonic (C18:4n-3), eicosatrienoic (C20:3n-3), eicosatetraenoic (C20:4n-3), eicosapen-taenoic (EPA; C20:5n-3), clupanodonic (C22:5n-3) and docosahexaenoic (DHA; C22:6n-3) acids.
[image:2.595.71.533.558.735.2]All fatty acids compete with essential fatty acids at all steps of the above cascades for metabolism of the essential fatty acids. The n-6 and n-3 PUFA compete for identical enzyme sites involved in these reactions. As the intake of LNA increases,
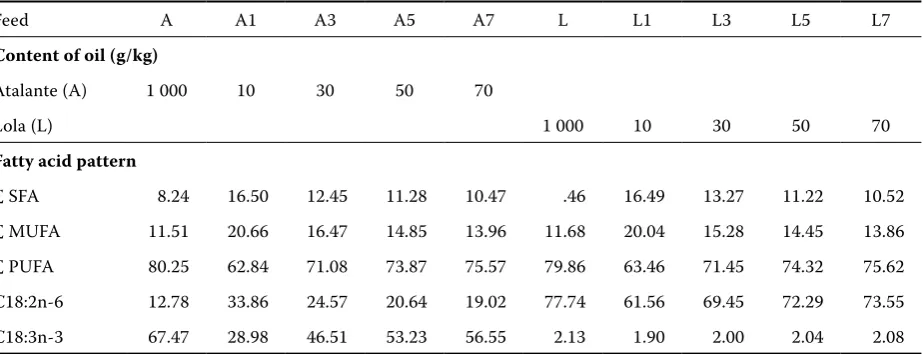
Table 1. Content of oils and the fatty acid pattern of oils and diets
Feed A A1 A3 A5 A7 L L1 L3 L5 L7
content of oil (g/kg)
Atalante (A) 1 000 10 30 50 70
Lola (L) 1 000 10 30 50 70
Fatty acid pattern
∑ SFA 8.24 16.50 12.45 11.28 10.47 .46 16.49 13.27 11.22 10.52 ∑ MUFA 11.51 20.66 16.47 14.85 13.96 11.68 20.04 15.28 14.45 13.86 ∑ PUFA 80.25 62.84 71.08 73.87 75.57 79.86 63.46 71.45 74.32 75.62 C18:2n-6 12.78 33.86 24.57 20.64 19.02 77.74 61.56 69.45 72.29 73.55 C18:3n-3 67.47 28.98 46.51 53.23 56.55 2.13 1.90 2.00 2.04 2.08
A1–A7 = diets containing 1–7% of Atalante oil; L1–L7 = diets containing 1–7% of Lola oil
metabolic products of LA are suppressed, and LA itself is increased in liver lipids. Conversely, with a constant supply of dietary LNA and an increasing supply of dietary LA, n-3 products are suppressed while the level of LNA itself in liver lipids increases (Holman and Mohrhauer, 1963).
Vegetable oils are generally used as a source of PUFA. Linseed oil made of common flax varieties contains ca 14% of LA and 63% of LNA of all fatty acids (Zelenka et al., 2003). However, relatively re-cently, the plant breeders selected some flax cul-tivars, the oil of whichcontains more than 77% of LA and only 2% of LNA.
The feeding of linseed oil rich in n-3 PUFA can be an effective method how to increase the tissue levels of these FA in broiler chickens (Olomu and Baracos, 1991; Chanmugam et al., 1992; Crespo and Esteve-Garcia, 2001; Lopez-Ferrer et al., 2001; Romboli et al., 2002;Nguyen et al., 2003; Dublecz et al., 2004;Valavan et al., 2006).
The objective of this experiment was to evaluate the effect of increasing doses of linseed oil manu-factured from seeds of varieties with markedly dif-ferent proportions of n-6 and n-3 PUFA on the fatty acid pattern in poultry meat. This was the same experiment in which the effect of linseed oils on basic production parameters of broilers was studied (Zelenka et al., 2006).
MAtErIAL AND MEtHODs
from Day 25 of age to Day 40 on feed mixtures containing 1; 3; 5 or 7% of linseed oil made either of seeds of the cultivar Atalante (A) with a pre-dominating content of α-linolenic acid (A1; A3; A5; A7) or of seeds of the cultivar Lola (L) with a predominating content of linoleic acid (L1; L3; L5; L7). Different supplements of oils changed the contents of essential fatty acids and n-6/n-3 PUFA ratio in the particular diets (Table 1). For a detailed description of the experimental design seeZelenka et al. (2006).
Eight chickens from each dietary group were sac-rificed at the end of experiment. Breast meat (BM) and thigh meat (TM) without skin were separated from carcasses after cooling. All visible external fat was removed from sample muscles while the intermuscular fat remained intact. Muscles were ground in a Moulinex blender and frozen for fur-ther analyses.
Total lipids were determined gravimetrically after extraction by the modified method according to Hara and Radin (1978) using a hexane: 2-propanol mixture. The extract was used for fatty acid deter-minations by gas chromatography. The method of extraction and FA determination is described in detail in the paper by Fajmonová et al. (2003). The relative proportions of fatty acids were expressed as percentage of total determined fatty acids.
The data from all determinations were subjected to the analysis of variance by means of statistical package Statistica, Version 6.1 (StatSoft, Inc.) appli-cable for multifactorial experiments and the com-parison of means was done by Duncan’s Multiple Range Test. The regression analysis of determined values was performed according to Snedecor and Cochran (1989).
rEsuLts AND DIscussION
The principal performance parameters of chick-ens are presented in our previous paper (Zelenka et al., 2006).
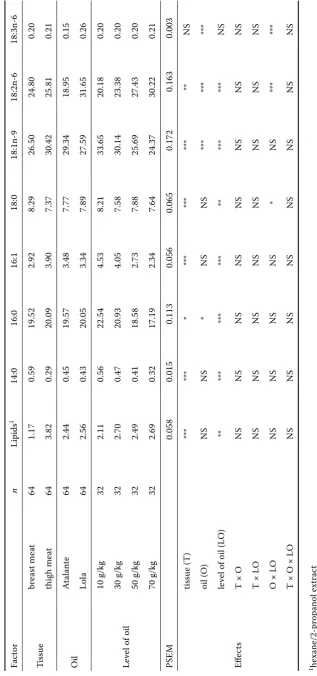
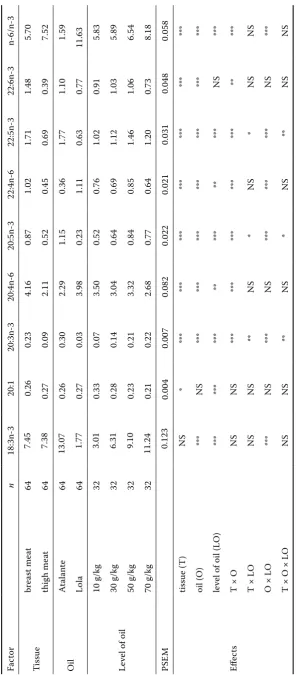
The evaluation of measured contents of lipids and proportions of individual FA by the three-way analysis of variance are presented in Table 2a,b. The content of lipids and proportions of monounsatu-rated fatty acids (MUFA) in TM were significantly higher than in BM. The relative proportion of LA was lower in BM and that of LNA and γ-linolenic acid was practically the same as in TM. The propor-tions of long-chain n-6 and n-3 PUFA were highly
significantly higher (P < 0.001) in BM than in TM. The different distribution of FA in tissues can be connected with higher amount of FA deposited in cell membranes and lower content of depot fat in the lipids of BM.
The ratio of n-6/n-3 PUFA was significantly (P < 0.001) better in BM (which showed a low con-tent of fat) than in TM (in which, however, the level of depot fat was higher). From this aspect, the food quality of breast meat is higher.
As far as the levels of lipids and proportions of saturated fatty acids (SFA) were concerned, very small differences were found out between the groups fed oil A and oil L. This fact corrobo-rated the observation of Crespo and Esteve-Garcia (2001), who concluded that the supply of a high level of LNA did not influence the relative propor-tions of SFA in meat. As far as MUFA were con-cerned, only the proportion of oleic acid (C18:1n-9) was changed; its level was significantly (P < 0.001) higher in chickens receiving rations containing oil A. Similar results were also published by Crespo and Esteve-Garcia (2001).
As the long-chain PUFA were not found in feed mixtures, they should be formed from their mater-nal LA and LNA.
In the meat of chickens receiving oil A, the rela-tive proportions of all n-6 PUFA were highly sig-nificantly lower and those of n-3 PUFA were higher (P < 0.001) than in the group fed oil L (Table 2a,b). It is obvious that in the enzymatic competition be-tween n-6 and n-3 FA families there was a lack of enzymes required for the elongation of n-6 FA family (Holman and Mohrhauer, 1963, Crespo and Esteve-Garcia, 2001). The supply of flax oil con-taining high levels of LNA resulted in an increased accumulation of n-3 PUFA in the fat of TM also in experiments performed by Chanmugam et al. (1992); their increased accumulation in BM was reported by Romboli et al. (2002) and in both BM and TM by Olomu and Baracos (1991), Crespo and Esteve-Garcia (2001), Nguyen et al. (2003), Dublecz et al. (2004) and Valavan et al. (2006).
Ta
bl
e
2a
. T
he
e
ffe
ct
o
f t
is
su
e,
o
il
an
d
le
ve
l o
f o
il
on
th
e
fa
tt
y
ac
id
p
at
te
rn
in
m
ea
t –
A
N
O
VA
Fa
ct
or
n
Li
pi
ds
1
14
:0
16
:0
16
:1
18
:0
18
:1
n-9
18
:2
n-6
18
:3
n-6
Ti
ss
ue
br
ea
st
m
ea
t
64
1.
17
0.
59
19
.5
2
2.
92
8.
29
26
.5
0
24
.8
0
0.
20
th
ig
h
m
ea
t
64
3.
82
0.
29
20
.0
9
3.
90
7.
37
30
.4
2
25
.8
1
0.
21
O
il
A
ta
la
nt
e
64
2.
44
0.
45
19
.5
7
3.
48
7.
77
29
.3
4
18
.9
5
0.
15
Lo
la
64
2.
56
0.
43
20
.0
5
3.
34
7.
89
27
.5
9
31
.6
5
0.
26
Le
ve
l o
f o
il
10
g
/k
g
32
2.
11
0.
56
22
.5
4
4.
53
8.
21
33
.6
5
20
.1
8
0.
20
30
g
/k
g
32
2.
70
0.
47
20
.9
3
4.
05
7.
58
30
.1
4
23
.3
8
0.
20
50
g
/k
g
32
2.
49
0.
41
18
.5
8
2.
73
7.
88
25
.6
9
27
.4
3
0.
20
70
g
/k
g
32
2.
69
0.
32
17
.1
9
2.
34
7.
64
24
.3
7
30
.2
2
0.
21
PS
EM
0.
05
8
0.
01
5
0.
11
3
0.
05
6
0.
06
5
0.
17
2
0.
16
3
0.
00
3
Eff
ec
ts
tis
su
e
(T
)
**
*
**
*
*
**
*
**
*
**
*
**
N
S
oi
l (
O
)
N
S
N
S
*
N
S
N
S
**
*
**
*
**
*
le
ve
l o
f o
il
(L
O
)
**
**
*
**
*
**
*
**
**
*
**
*
N
S
T
×
O
N
S
N
S
N
S
N
S
N
S
N
S
N
S
N
S
T
×
L
O
N
S
N
S
N
S
N
S
N
S
N
S
N
S
N
S
O
×
L
O
N
S
N
S
N
S
N
S
*
N
S
**
*
**
*
T
×
O
×
L
O
N
S
N
S
N
S
N
S
N
S
N
S
N
S
N
S
1he
xa
ne
/2
-p
ro
pa
no
l e
xt
ra
ct
*
P
<
0
.0
5;
**
P
<
0.
01
;
**
*
P
<
0
.0
01
; N
S
=
no
n
si
gn
ifi
ca
[image:4.595.76.394.84.762.2]Ta
bl
e
2b
. T
he
e
ffe
ct
o
f t
is
su
e,
o
il
an
d
le
ve
l o
f o
il
on
th
e
fa
tt
y
ac
id
p
at
te
rn
in
m
ea
t –
A
N
O
VA
Fa
ct
or
n
18
:3
n-3
2
0:
1
2
0:
3n
-3
20
:4
n-6
20
:5
n-3
22
:4
n-6
2
2:
5n
-3
2
2:
6n
-3
n-6/
n-3
Ti
ss
ue
br
ea
st
m
ea
t
64
7.
45
0.
26
0.
23
4.
16
0.
87
1.
02
1.
71
1.
48
5.
70
th
ig
h
m
ea
t
64
7.
38
0.
27
0.
09
2.
11
0.
52
0.
45
0.
69
0.
39
7.
52
O
il
A
ta
la
nt
e
64
13
.0
7
0.
26
0.
30
2.
29
1.
15
0.
36
1.
77
1.
10
1.
59
Lo
la
64
1.
77
0.
27
0.
03
3.
98
0.
23
1.
11
0.
63
0.
77
11
.6
3
Le
ve
l o
f o
il
10
g
/k
g
32
3.
01
0.
33
0.
07
3.
50
0.
52
0.
76
1.
02
0.
91
5.
83
30
g
/k
g
32
6.
31
0.
28
0.
14
3.
04
0.
64
0.
69
1.
12
1.
03
5.
89
50
g
/k
g
32
9.
10
0.
23
0.
21
3.
32
0.
84
0.
85
1.
46
1.
06
6.
54
70
g
/k
g
32
11
.2
4
0.
21
0.
22
2.
68
0.
77
0.
64
1.
20
0.
73
8.
18
PS
EM
0.
12
3
0.
00
4
0.
00
7
0.
08
2
0.
02
2
0.
02
1
0.
03
1
0.
04
8
0.
05
8
Eff
ec
ts
tis
su
e
(T
)
N
S
*
**
*
**
*
**
*
**
*
**
*
**
*
**
*
oi
l (
O
)
**
*
N
S
**
*
**
*
**
*
**
*
**
*
**
*
**
*
le
ve
l o
f o
il
(L
O
)
**
*
**
*
**
*
**
**
*
**
**
*
N
S
**
*
T
×
O
N
S
N
S
**
*
**
*
**
*
**
*
**
*
**
**
*
T
×
L
O
N
S
N
S
**
N
S
*
N
S
*
N
S
N
S
O
×
L
O
**
*
N
S
**
*
N
S
**
*
**
*
**
*
N
S
**
*
T
×
O
×
L
O
N
S
N
S
**
N
S
*
N
S
**
N
S
N
S
Fo
r s
pe
ci
fic
at
io
ns
se
e
Ta
bl
e
[image:5.595.80.383.81.758.2]X – le ve l o f l in se ed o il in th e di et (% ) Y – c on te nt (% o f a ll FA ) in m ea t 1 Y = a + bX + cX 2 a b c r P Xex tr .
Yextr
. A 1– A 7 Σ SF A BM 2 8. 13 ± 0 .5 25 3 2. 69 – 1. 14 05 ** – 0 .8 72 > 0. 05 – – TM 2 7. 48 ± 0 .4 87 3 0. 98 – 0. 87 56 ** – 0 .7 22 > 0. 05 – – L1 –L 7 BM 2 8. 76 ± 0 .5 09 3 3. 20 – 1. 11 04 ** – 0 .8 75 > 0. 05 – – TM 2 7. 98 ± 0 .4 59 3 1. 86 – 0. 97 15 ** – 0 .8 50 > 0. 05 – – A 1– A 7 Σ M U FA BM 3 0. 74 ± 0 .9 90 3 9. 47 – 2. 18 31 ** – 0 .8 86 > 0. 05 – – TM 3 5. 39 ± 0 .8 53 4 2. 93 – 1. 88 34 ** – 0 .8 87 > 0. 05 – – L1 –L 7 BM 2 8. 65 ± 0 .8 80 3 9. 53 –4 .2 86 0 .2 98 28 0 0 .9 01 < 0. 01 7 .1 8 2 4. 13 TM 3 3. 75 ± 0 .9 64 4 2. 26 –2 .1 26 5* * – 0 .8 86 > 0. 05 – – A 1– A 7 Σ PU FA BM 4 0. 73 ± 1 .4 03 2 7. 71 3. 25 45 ** – 0 .9 32 > 0. 05 – – TM 3 6. 95 ± 1 .2 31 2 6. 05 2. 72 59 ** – 0 .8 89 > 0. 05 – – L1 –L 7 BM 4 2. 20 ± 1 .2 42 2 6. 63 5. 96 4 0 .3 94 50 6 0 .9 36 < 0. 01 7 .5 6 4 9. 17 TM 38 .1 0 ± 1. 31 3 2 6. 11 2. 99 59 ** – 0 .9 17 > 0. 05 – – A 1– A 7 Σ n-6 PU FA BM 2 1. 86 ± 0 .3 27 ** 2 1. 24 0. 15 58 – 0 .1 91 > 0. 05 – – TM 2 1. 69 ± 0 .3 69 ** 2 1. 40 0. 07 02 – 0 .0 76 > 0. 05 – – L1 –L 7 BM 3 8. 17 ± 1 .2 34 2 3. 16 5. 44 6 – 0. 32 28 42 0 .9 51 < 0. 01 8 .4 3 4 6. 13 TM 3 5. 42 ± 1 .2 95 2 3. 45 2. 99 07 ** – 0 .9 28 > 0. 05 – – A 1– A 7 Σ n-3 PU FA BM 1 8. 86 ± 1 .3 11 ** 3 .2 8 5. 42 0 0. 29 02 16 0 .9 63 < 0. 01 9 .3 4 2 8. 59 TM 1 5. 27 ± 1 .1 18 ** 4 .6 4 2. 65 57 ** – 0 .9 54 > 0. 05 – – L1 –L 7 BM 4 .0 4 ± 0. 17 2 4 .2 6 –0 .0 55 9 – 0 .1 30 > 0. 05 – – TM 2 .6 8 ± 0. 07 3 2 .6 6 0. 00 52 – 0 .0 28 > 0. 05 – – A 1– A 7 n-6/ n-3 PU FA BM 1 .4 3 ± 0. 13 6* * 3 .4 6 –0 .9 32 0. 08 08 60 0 .9 42 < 0. 01 5 .7 6 0 .7 7 TM 1 .7 5 ± 0. 16 5* * 4 .2 4 –1 .1 19 0. 09 47 55 0 .9 70 < 0. 01 5 .9 1 0 .9 3 L1 –L 7 BM 9 .9 7 ± 0. 56 7 5 .9 9 0. 99 52 ** – 0 .7 04 > 0. 05 – – TM 1 3. 29 ± 0 .5 78 8 .5 2 1. 19 13 ** – 0 .8 28 > 0. 05 – – 1m ea n ± st an da rd e rr or o f t he m ea n; B M = b re as t m ea t; TM = th ig h m ea t A 1– A 7 = di et s c on ta in in g 1– 7% o f A tla nt e oi l; L1 –L 7 = di et s c on ta in in g 1– 7% o f L ol a oi l a b, cpa ra m et er s o f e qu at io n; si gn ifi ca nc e of th e di ffe re nc e be tw ee n A a nd L a nd o f l in ea r r eg re ss io n co effi ci en t b * P < 0 .0 5; ** P < 0 .0 1 r = co rr el at io n co effi ci en ts ; P = si gn ifi ca nc e of th e de vi at io n fr om li ne ar ity ; Xex tr
, Yex
energy and consumption of energy per unit weight gain (Zelenka et al., 2006), the content of lipids in the meat of chickens receiving various fat levels in the diet was not different. The only exception was their decreased content in TM of chickens receiving the dose of 10 g of oils per kg of feed mixture.
When Lopez-Ferrer et al. (1999) supplemented 8.2% of linseed oil into the diet, the proportions of long-chain (C20–22) n-3 PUFA of total FA in BM and TM were 4.32% and 1.91%, respectively. In our experiment, however, these proportions were exceeded already at 1.0% of oil A in the diet. The relative proportion of DHA was independent of the level of oil in the diet.
The ratio of n-6 to n-3 PUFA ranged from 0.9 to 13.6 and from 1.0 to 17.2 in BM and TM, respec-tively. In our experiment it was found out that at the dose of 30 g A/kg the ratio of n-6/n-3 in BM was 1.3 while Barteczko and Borowiec (2001) re-ported the ratio 3.1 in chicks fed 34 g of linseed oil containing high amounts of LNA; using the same doses of oil with the predominating content of LA we found the ratio 9.0 while the aforementioned authors reported about 24.3. The ratio found out in our experiment with 30 g of oil A in 1 kg of feed fits well with the ratio 1.35, which was published by Nguyen et al. (2003), who used the same amount of linseed oil.
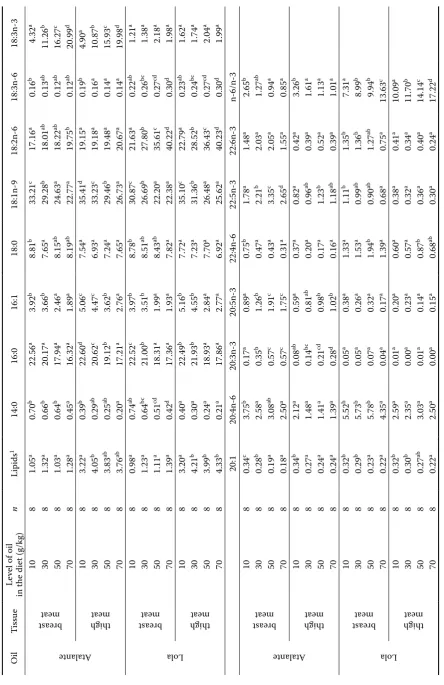
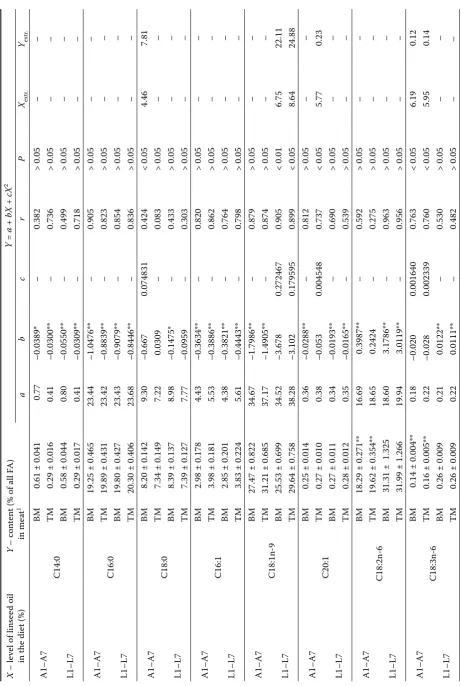
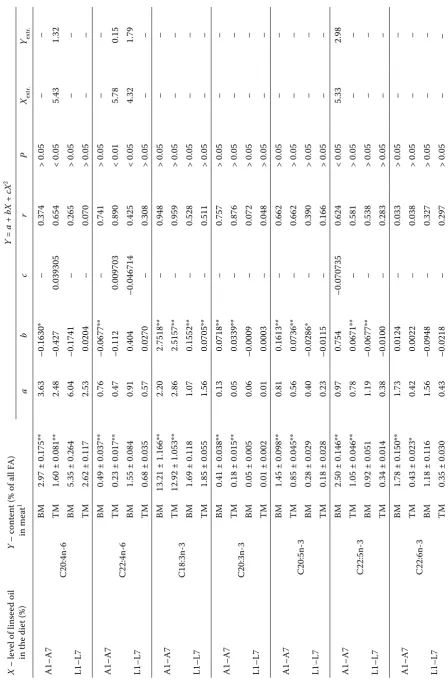
The mean values of FA percentages of all FA in the meat are presented in Table 4. Dependences of the above values (Y) upon the level of linseed oil in the diet (X) in the range from 1 to 7% were expressed by means of linear regression equations and the 2nd degree parabola equations. The reduc-tion in the sum of squares of deviareduc-tions was tested against the mean square remaining after curvilin-ear regression by F-test (Snedecor and Cochran, 1989). In case that the reduction was significant, parameters a, b and c of parabola equation were presented in Table 4. When the deviation from linearity was insignificant, parameters a and b of linear regression were presented in this table. Regarding the fact that the composition was rather different, calculations were carried out separately for each type of oil.
The relative proportions of total SFA and MUFA in meat decreased and those of total PUFA in-creased significantly (P < 0.01) in dependence on the increasing level of linseed oils in the diet (Ta-ble 4). Lopez-Ferrer et al. (2001) also found out that increasing dietary levels of LNA resulted in an increase in the contents of individual long-chain
n-3 FA in the fat of TM; in our experiment, how-ever, this observation for DHA was not corrobo-rated. Our results reinforce the theory that broiler chickens show a limited capacity to desaturate and elongate LNA (Chanmugam et al., 1992).
When feeding oil A, a significant (P < 0.01) increase in the proportion of LA in BM was ob-served, but the increase in TM was not significant (P > 0.05). The proportion of the other n-6 fatty acids significantly decreased and that of all deter-mined n-3 fatty acids with the exception of DHA increased with the increasing level of oil in the diet. Similarly, Valavan et al. (2006) reported that the proportion of DHA either in BM or in TM was not significantly different at levels of 1, 2 or 3% of dietary linseed oil.
When feeding oil L with a low content of LNA, its increasing content in the diet increased the relative proportion of LA as well as its elongation to γ-li-nolenic acid; however, the proportions of AA and ADA did not change significantly (P > 0.05). The proportion of LNA increased in both BM and TM. The proportion of its n-3 metabolites decreased but this downturn was significant only in the case of EPA and clupanodonic acid in BM.
An increase in the level of oil L in the diet by 1% caused that the n-6/n-3 ratio of PUFA extended by 1.00 and 1.19 units in BM and TM, respectively. The dependences of the n-6/n-3 ratio on the level of oil A were not linear, they were expressed more precisely (P < 0.01) by parabola equations
YBM = 3.46 – 0.932X + 0.080860X2; r = 0.942 YTM = 4.24 – 1.119X + 0.094755X2; r = 0.970 Convex parabolas achieved minima at 5.8 and 5.9% levels of oil in the feed mixture for BM and TM, respectively. The supply of 70 g oil per kg of the diet was too high for a further narrowing of the n-6/n-3 ratio.
It can be concluded that by means of the inclu-sion of linseed oil with a high content of LNA into the feed mixture it would be possible to produce poultry meat with an arbitrary n-6/n-3 PUFA ratio as a functional food.
rEFErENcEs
Chanmugam P., Boudreau M., Boutte T., Park R.S., Hebert J., Berrio L., Hwang H. (1992): Incorporation of differ-ent types of n-3 fatty acids into tissue lipids of poultry. Poult. Sci., 71, 516–521.
Crespo N., Esteve-Garcia E. (2001): Dietary fatty acid profile modifies abdominal fat deposition in broiler chickens. Poult. Sci., 80, 71–78.
Dublecz K., Bartos A., Pal L., Wagner L., Banyai A., Toth S., Babinszki G. (2004): Modification the fatty acid composition of different tissues in broiler chicks. In:
Proc. XXIIWorld’s Poultry Congress – Fulltext CD,
World’s Poultry Science Association, Istanbul, Turkey, 424 pp.
Fajmonová E., Zelenka J., Komprda T., Kladroba D., Šarmanová I. (2003): Effect of sex, growth intensity and heat treatment on fatty acid composition of common
carp (Cyprinus carpio) fillets. Czech J. Anim. Sci., 48,
85–92.
Hara A., Radin M.S. (1978): Lipid extraction of tissues with a low-toxicity solvent. Anal. Biochem., 90, 420– 426.
Holman R.T., Mohrhauer H. (1963): A hypothesis involv-ing competitive inhibitions in the metabolism of polyunsaturated fatty acids. Acta Chem. Scand., 17, S84–S90.
Lopez–Ferrer S., Baucells M.D., Barroeta A.C., Grashorn M.A. (1999): n-3 enrichment of chicken meat using fish oil: Alternative substitution with rapeseed and
linseed oils. Poult. Sci.,78, 356–365.
Lopez–Ferrer S., Baucells M.D., Barroeta A.C., Galobart J., Grashorn M.A. (2001): n-3 enrichment of chicken meat. 2. Use of precursors of long-chain
polyunsatu-rated fatty acids: Linseed oil. Poult. Sci.,80, 753–761.
Nguyen C.V., Smulikowska S., Mieczkowska A. (2003): Effect of linseed and rapeseed or linseed and rapeseed oil on performance, slaughter yield and fatty acid depo-sition in edible parts of the carcass in broiler chickens. J. Anim. Feed Sci., 12, 271–288.
Olomu J.M., Baracos V.E. (1991): Influence of dietary flaxseed oil on the performance, muscle protein depo-sition, and fatty-acid composition of broiler chicks. Poult. Sci., 70, 1403–1411.
Romboli I., Marzoni M., Chiarini R., Schiavone A. (2002): Dietary oil supplementation to manipulate polyun-saturated fatty acid content of chicken meat. Proc.
11th European Poultry Conference. Bremen, Germany,
Arch. Geflűgelkd.,66, 157.
Simopoulos A.P. (1999): Essential fatty acids in health
and chronic disease. Am. J. Clin. Nutr., 70, 560S–
569S.
Snedecor G.W., Cochran, W.G. (1989): Statistical
Meth-ods. 8th ed. The Iowa State University Press, Ames.
503 pp.
Valavan S.E., Selvaraj P., Mohan B., Sundaram T.K., Viswanathan K., Ravi R., Purushothaman M.R. (2006): Effects of various n-3 lipid sources on the quality char-acteristics and fatty acids composition of chicken meat.
World’s Poult. Sci. J., 62, 240.
Van Elswyk M.E. (1997): Nutritional and physiological effects of flax seed in diets for laying fowl. World’s Poult. Sci. J., 53, 253–264.
Youdim K.A., Martin A., Joseph J.A. (2000): Essential fatty acids and the brain: possible health implications. Int. J. Dev. Neurosci., 18, 383–399.
Zelenka J., Fajmonová E., Komprda T., Kladroba D., Šarmanová I. (2003): Effect of dietary linseed and sun-flower oil on cholesterol and fatty acid contents in
rainbow trout (Oncorhynchus mykiss) fillets. Czech J.
Anim. Sci., 48, 321–330.
Zelenka J., Schneiderová D., Mrkvicová E. (2006): Linseed oils with different fatty acid patterns in the diet of broiler chickens. Czech J. Anim. Sci., 51, 117–121.
Received: 2007–02–22 Accepted after correction: 2007–04–17
Corresponding Author
Ing. Dana Schneiderová, Faculty of Agronomy, Mendel University of Agriculture and Forestry, Zemědělská 1, 613 00 Brno, Czech Republic