This paper investigates the superelastic deformation behaviors of a TiNi shape-memory alloy (SMA) tape subjected to various subloop loadings in relation to local temperature variations and observed surface changes during a tension test. The results obtained are: (1) Upper and lower stress plateaus appear during loading and unloading accompanying the spreading and shrinking of the stress-induced martensitic transformation (SIMT) bands. In the case of unloading from the upper stress plateau under low stress rate, strain increases due to the spreading of the SIMT bands at the start of the unloading. (2) If stress at the upper stress plateau is held constant, creep deformation appears with the spread of the SIMT bands. The volume fraction in the martensitic phase increases in proportion to the increase in strain. (3) Where the strain is made to vary at the stress plateaus during loading or unloading, a return point memory effect can be seen in the reloading stressstrain curve. The spreading or shrinking of the SIMT bands starts from the boundary of the previous SIMT bands remaining from the preceding process. (4) The inclination angle of the SIMT band boundaries to the tensile axis of the tape is 33° for an aspect ratio of 5. The inclination angle is 42° in the center of the tape and 37° in the vicinity of the end secured by the grip, for an aspect ratio of 10. [doi:10.2320/matertrans.M2011288]
(Received September 15, 2011; Accepted October 27, 2011; Published December 7, 2011)
Keywords: shape memory alloy, superelasticity, titanium-nickel alloy, subloop, transformation band, creep deformation, local deformation
1. Introduction
Shape memory alloys (SMAs) are remarkable materials characterized by the thermomechanical properties of shape memory and superelasticity. Since properties like these are highly conducive to the functions of smart materials, their applications have attracted worldwide attention.13)However, in order for SMAs to be applied effectively in the design of shape memory elements, the thermomechanical properties of the material have to be taken into account. The functional properties of an SMA appear based on the martensitic transformation (MT), and since the MT is sensitive to variations in temperature and stress and to their hysteresis, the deformation properties due to the MT are complex.4,5) Research up to now in this area has been mainly concerned with a full loop (or perfect loop) of the MT completion. But in practical applications, temperature and stress are likely to vary in various ranges. If SMA elements are subjected to loads with a subloop (or partial loop, internal loop) in which temperature or stress varies in an incomplete MT range, the conditions for the start andfinish of the MT as in a full loop are not satisfied. That is to say, the conditions for the progress of the MT will therefore change depending on the previous hysteresis of temperature and stress.68) An example of this would be a case in which an SMA element accomplishes a two-way movement depending on an MT of cooling and a reverse MT of heating, both under constant stress. In a full loop description, the SMA element undergoes an amount of deformation corresponding to the maximum stress-induced martensitic transformation (SIMT) strain. However, in the case of a subloop, the SMA element does not complete the whole of this stroke. Similarly, since the recovery stress which occurs in an SMA element subjected to heating and cooling under a constant strain will depend on the hysteresis
of the temperature, the actual variation in the recovery stress for a given subloop will be smaller than that obtained in a full loop. It can be recognized from this that the subloop deformation behaviour of an SMA is of great importance for an accurate evaluation of the functional properties of SMA elements and for the design of such elements for practical applications.
The present study investigates superelastic deformation behaviors of TiNi alloy, the most widely used SMA in practical applications, in various subloop loading tests, in particular the dependence of the subloop deformation on the loading rate, the characteristics of transformation-induced creep deformation in the stress plateau region under constant stress, and the dependence of the superelastic deformation on variations in cyclic strain in the stress plateau region. Variations in the SIMT bands during deformation are observed using a microscope, and a thermograph is used to identify the temperature distributions on the surface of the tape specimen. The subloop deformation behaviors are discussed in terms of the local deformations due to the SIMT.
2. Experimental Method
2.1 Materials and specimens
The material used in the tests was a TiNi alloy containing Ti-50.95 at%Ni. The specimens were in the form of a polycrystalline tape of this material produced by Furukawa Techno Material Co., Ltd. The DSC thermogram of the material is shown in Fig. 1. The transformation finishing temperature Af obtained from the DSC test was 281 K. The thickness and the width of the tape were uniform, at 0.7 and 10 mm, respectively. Thefinal cold-rolling rate was 25%and the heat-treatment temperature was 803 K for 1 min. The specimens used in the test were of two gage lengths, 50 and 100 mm, where “gage length” (GL) means the distance between the two securing grips. The aspect ratios (the ratios
of GL: width) of these two types of specimens were thus 5 and 10, respectively.
The surface of the specimens used to observe the SIMT bands was mirror-like,finished with a No. 4000 emery paper. The surface used to detect the temperature distributions by means of infrared thermography was covered with a thin black layer of carbon powder.
2.2 Experimental apparatus
The testing apparatus for SMA characteristics appearing in the tension test consisted of a tension machine and a heating-cooling device. A digital camera and a motion analysis microscope were used for the observation of SIMT bands on the surface of the specimen and an infrared thermography device was used for the detection of heating or cooling effects due to exothermic or endothermic reactions to the SIMT.
2.3 Experimental procedure
Three kinds of tension tests for subloop loading were carried out in air at room temperature. During the tests, the SIMT band characteristics and the temperature distributions on the surface of the specimens were measured continuously. The three kinds of tests were:
(1) Subloop loading test at different loading rates: With respect to the maximum strain of 8%at the upper stress plateau of the stressstrain curve, loading and unloading tests were conducted at constant rates of strain and stress and the subloop deformation behaviors were observed for different loading rates.
(2) Creep test:
Stress loading was applied at a constant rate up to a level of 2%strain at the upper stress plateau, and stress was then kept constant while the creep deformation behavior was observed.
(3) Cyclic loading test:
Strain at the upper and lower stress plateaus was controlled to increase or decrease cyclically at a set rate and the subloop deformation behavior was observed.
3. Experimental Results and Discussion
In the measurement and analysis of the results, nominal values of stress and strain were used. The strain and stress rates therefore correspond to the displacement and load rates, respectively.
3.1 Dependence of subloop superelastic deformation on loading rate
3.1.1 Deformation under constant strain rate
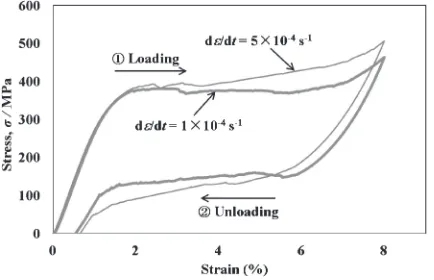
The stressstrain curves obtained from the tension tests under constant strain rates of 1©10¹4s¹1 and 5©10¹4s¹1 are shown in Fig. 2, in which the stressstrain curves represent the hysteresis loops during loading and unloading. Strain is recovered in the unloading process, indicating superelasticity. At a low strain rate, an upper and a lower stress plateaus appear, due to the SIMT during loading in the upper case and to the reverse transformation during unloading in the lower one. At a high strain rate, the slope of the stressstrain curve in the stress plateau region is steeper, and the starting andfinishing points of the SIMT and reverse transformation are less distinct. The increase in steepness at the higher strain rate can be explained in the case of the loading process by saying that there is an increase in temperature due to the SIMT which raises stress above the level needed, at the upper plateau, for the SIMT to progress in conditions of temperature constancy.9) Similarly, in the unloading process at a high strain rate, the reverse trans-formation causes the stress to descend to a lower level than would otherwise occur at the lower stress plateau. This dependence of the slope of the stressstrain curve on the strain rate in the stress plateau regions also holds at strain rates higher than 5©10¹4s¹1.912)
3.1.2 Deformation under constant stress rate
The stressstrain curves obtained from the tension tests under constant stress rates of 0.5 MPa/s and 5 MPa/s are shown in Fig. 3. As before, these curves represent the hysteresis loops during loading and unloading and indicate superelasticity. Again, the slope in the stress plateau region is steeper for the higher stress rate. At the lower rate, from point A1 in the unloading process where the strain is 8%, strain initially increases to 8.67%at point B1and then decreases to C1, which is the starting point of the reverse transformation, as a result of elastic deformation. The initial increase in strain from A1 to the B1 is due to the fact that the conditions for the SIMT to progress are still being satisfied in this early part of the unloading process as a carry-over from the rise in temperature produced by the SIMT in the loading process up to A1; as the unloading proceeds, the temperature then starts to come down.6,8)At the higher stress rate, for which the rate of decrease in the stress is larger during the initial stage of
[image:2.595.61.278.67.212.2] [image:2.595.320.537.71.211.2]unloading from point A2, any carried over increase in strain from the SIMT will be slight and balanced out by the decrease in elastic strain. As a result of these two counter-acting variations in strain, stress decreases under almost constant strain down to point B2, after which strain decreases elastically down to C2.
3.1.3 Behavior of transformation bands
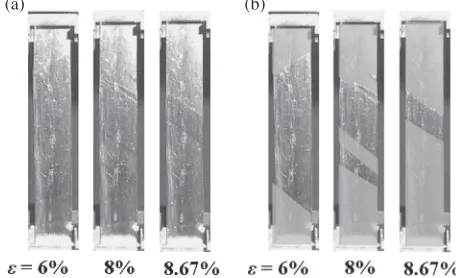
Figures 4 and 5 show photographs of specimen surfaces at various strains taken by a digital camera in the tension test under a stress rate of 0.5 MPa/s. The images in Fig. 4(a) are unprocessed, whereas in Figs. 4(b) and 5 the bands left by the SIMT (SIMT bands) have been enhanced with green tinting. This is because the propagation patterns of these bands, although obvious enough to naked-eye observation, do not show up well in monochrome photographs, as can be seen by comparing the images in Figs. 4(a) and 4(b). As can be observed from the series of images in Fig. 5, SIMT bands, similar to Luders’ bands but at a certain angle of inclination, appear first at both ends and then spread toward the center. In the course of unloading from a controlled strain of 8%, the SIMT bands initially go on spreading up to a strain level of 8.67%, but then, as the unloading effect sets in, the center boundaries recede, causing the bands to shrink back toward both ends. Comparing the area fractions of the SIMT bands at the same strain levels in the loading and unloading phases, the transformed area is greater in unloading.
3.2 Transformation-induced creep deformation 3.2.1 Strain behavior
Figure 6 shows the stressstrain curve obtained from the creep test under a constant stress rate of 0.5 MPa/s up to a strain of 2% at the upper stress plateau, followed by a constant stress. In Fig. 6, the SIMT starts at a strain of 1.3% (point A) in the loading process, under a constant stress rate. If stress is controlled so as to remain constant at its level for 2% (point B), it initially fluctuates slightly before settling down to a constant 438 MPa at a strain of 3.5% (point C). Strain then continues to increase to about 8%(point D). This
Fig. 3 Stressstrain curves under stress rates of d·/dt=0.5 MPa/s and
d·/dt=5 MPa/s. Fig. 4and with green tinting. (a) MT band without tinting (b) MT band withPhotographs of specimen surface at several strains¾without tinting green tinting.
Fig. 5 Photographs of specimen surface at various strains¾under stress rate of 0.5 MPa/s.
[image:3.595.61.282.68.208.2] [image:3.595.311.539.74.213.2] [image:3.595.100.499.282.412.2] [image:3.595.323.530.466.604.2]phenomenon of strain increase under constant stress is similar to what is found with normal creep deformation. The explanation in this case would be that the SIMT causes the temperature to increase during loading up to a strain of 2%, after which it decreases under a constant stress. Conditions are therefore satisfied for the SIMT to progress6,8)and strain increases.
The relationship between strain and time is shown in Fig. 7. As can be seen in Figs. 6 and 7, the rate of increase in the strain rises sharply at the level of 1.3%, following the start of the SIMT. Stress fluctuates slightly between strain levels 2%and 3.5%while strain increases rapidly. After a strain of 3.5%is reached, stress settles down to be constant and strain increases at an almost constant rate of 6.5©10¹5s¹1. Strain goes on increasing to about 8% before finally becoming constant.
3.2.2 Progress of creep strain
Figure 8 shows thermograms of the temperature distri-bution on the surface of a specimen, and Fig. 9 shows photographs of the SIMT bands.
As can be seen from the temperature distributions, the SIMT process due to the exothermic reactionfirst appears at the two ends during loading at a strain level of 2%, and then spreads toward the center where the bands combine into one, completing the SIMT. When the stress is held constant at the level reached for 2% strain, the SIMT bands spread due to a decrease in temperature. Transformation heat is generated at each new point of advance in the SIMT process, which leads to a chain reaction in the SIMT, resulting in creep deformation.
In Fig. 9, the SIMT bands in the photographs are again tinted, this time in blue, to enhance the visibility of the
propagation progress. After first appearing at the two ends, the bands spread toward the center as stress is held constant. Once the whole surface has been transformed to the M-phase at a strain of about 8%, the strain stops growing. As can be seen from the previous Fig. 6, when the SIMT bands combine in the center and strain stops increasing (point D), stress decreases by 5 MPa. All of the SIMT bands photo-graphed in Fig. 9 also appear in the same positions on the reverse surface of the specimen and can be considered as continuing throughout the cross section of the tape. This means that the area fraction occupied by the M-phase on each surface must be equivalent to the volume fraction occupied in the body as a whole. In this way, the volume fraction of the M-phase can be estimated from the measured area fraction of the SIMT bands. The relationship between the volume fraction of the M-phase and strain is shown in Fig. 10. The volume fraction of the M-phase increases in proportion to an increase in strain.
3.3 Superelastic deformation under cyclic subloop loading
3.3.1 Stressstrain relationship
In the cyclic loading test at a constant strain rate of 1©10¹4s¹1, a tensile load was initially applied up to a strain of 5%, and then followed by unloading down to 3.5%and a higher reloading up to 6%. In this way, loading and reloading were cyclically repeated, with a rise of 1%strain each time at
Fig. 7 Variation in strain with passing of time in creep test.
Fig. 8 Thermograms of temperature distribution on the specimen surface under d·/dt=0.5 MPa/s up to a strain¾ of 2% followed by constant stress.
[image:4.595.66.272.64.202.2]Fig. 9 Photographs of specimen surface at various strains¾under stress rate of d·/dt=0.5 MPa/s up to a strain¾of 2%followed by constant stress.
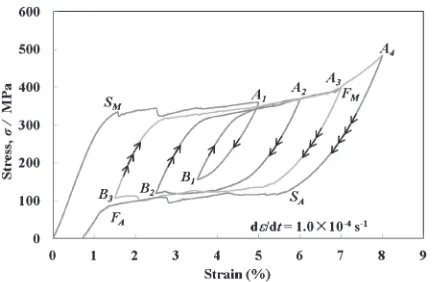
[image:4.595.312.539.68.244.2] [image:4.595.62.276.240.350.2] [image:4.595.334.516.300.423.2]both the upper and the lower stress plateaus. The stressstrain curves obtained from this cyclic loading test are shown in Fig. 11. A general point to notice is that the reverse transformation during unloading proceeds at a lower plateau stress of about 120 MPa and that found with the SIMT during loading, of about 350 MPa. Looking in closer detail, the stress level at the reloading stress plateau also decreases with each increase in the number of cycles. Finally, from the second cycle on, the reloading curves pass through the unloading start points A2 and A3, confirming the effect of return point memory.5,8)
3.3.2 Propagation behavior of the SIMT bands
Figures 12 and 13 show photographs of the SIMT bands on the surface of the specimen for thefirst and third cycles of the cyclic loading test, respectively. As in Fig. 9, the bands are enhanced by blue tinting. While they can be seen to shrink during unloading and spread again during reloading, these variations are slight in thefirst cycle shown in Fig. 12. The overall variation in strain in the first cycle is 1.5%, of which 1%is due to elastic deformation in the initial stages of unloading and reloading. Therefore the variation in strain due to the SIMT and its reverse transformation must indeed be
slight. By contrast, in the third cycle where the variation in strain is large, the shrinking of the SIMT bands during unloading and their spreading during reloading are clearly noticeable as shown in Fig. 13. As before, the spreading of the SIMT bands begins from the end boundaries, which remain after the shrinking of the bands in the preceding unloading process.
[image:5.595.62.281.68.209.2]In the case of full loop superelastic deformation, over-shoots and underover-shoots occur at the starting points of the loading and unloading processes in the stress plateau regions, SMand SA.8)The overshoot or undershoot at the start of each phase transformation has the function of nucleating the M-phase and parent M-phase. However, in a subloop, where both the M-phase and the parent phase remain from the preceding process, there is no need to nucleate the product phase in this way. Consequently, there is no appearance of an overshoot or undershoot during loading or unloading; instead, the M-phase and parent phase regions are propagated from the SIMT band boundaries. Because of the differences in progression between the SIMT and the reverse transformation, the SIMT bands are wider in the unloading process than in the loading one at the same strain.
[image:5.595.312.542.70.252.2]Fig. 11 Stressstrain curves obtained from cyclic loading test with strain variation under d¾/dt=1©10¹4s¹1.
[image:5.595.102.497.308.477.2]Fig. 12 Photographs of specimen surface at various strains¾in 1st cycle of cyclic loading test under d¾/dt=1©10¹4s¹1.
3.4 Behavior of the SIMT bands
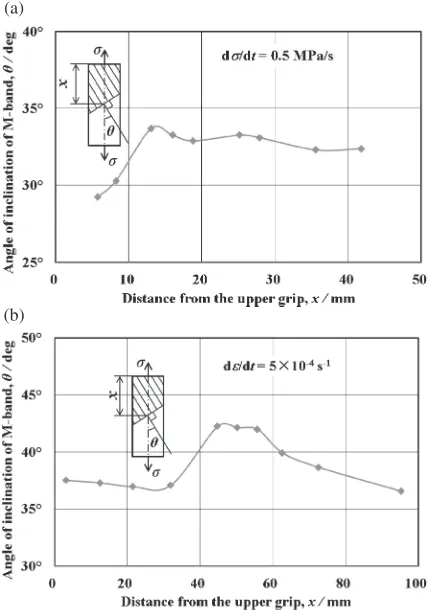
As already observed with Figs. 5, 9, 12 and 13, the boundary edges of the SIMT bands advance or recede at a certain angle of inclination ª to the tensile axis. ª can be defined as the angle between the normal of the SIMT boundary and the tensile axis. For TiNi SMA strips under tension, reported values forªare 3536° for a specimen with an aspect ratio of 3.8613)and 42° for one with an aspect ratio of 13.9)In the case of a TiNi SMA tube, a spiral SIMT band appears on the surface of the tube, with a reported value for ª of 35°.14) For the present experiment, the relationship between the measured angle of inclinationªand the distance
x from the upper grip securing the specimen is shown in Figs. 14(a) and 14(b) for the specimens of aspect ratios 5 and 10, respectively. These are values obtained from the tension tests at a stress rate of 0.5 MPa/s and a strain rate of 5©10¹4s¹1.
In Fig. 14(a), for the case of the aspect ratio of 5, the angle of inclinationªis 33° except in the vicinity of thefixed end; in Fig. 14(b), for the aspect ratio of 10,ªis 42° in the central part of the specimen and 37° in the vicinity of the two ends. With this aspect ratio of 10, the central part is in a state close to uniaxial tension and thus ª takes a much higher value approaching 45°, the direction of maximum shear stress. At the two ends, on the other hand, the specimen is compressed by the securing grips and the lateral contraction correspond-ing to elongation is restricted. Therefore, in the close vicinity of thefixed ends, shear stress appears. The direction angle of the maximum shear stress is therefore smaller than 45°. To sum up, then, for either a small aspect ratio or for the area in
the vicinity of the twofixed ends in the case of larger aspect ratio, the angle of inclination of the SIMT bands, ª, appears to be in the range 3337°. This problem of the dependence of the angle of inclinationªon the aspect ratio, the loading rate, the loading and unloading processes and the tightening force of the specimen requires more detailed attention in future research.
As observed in Figs. 5, 12 and 13, the SIMT bands originate at the upper and lower fixed ends of the specimen before spreading toward the center. During the initial part of this spreading, the converging leading edges of the two bands are inclined in mirror-like symmetry, to the right as viewed from one end but to the left as viewed from the other. But just before the bands meet, there is a change in symmetry so that the inclinations become complementary. This can be seen, for example, at the 8% loading strain level in Fig. 5.
4. Conclusions
This paper reports investigations of various subloop behaviors associated with superelastic deformation of a TiNi SMA tape based on evidence of local temperature variation as measured by thermography and on surface observations of SIMT bands made with a motion analysis microscope during tension tests. The results obtained can be summarized as follows.
(1) Upper and lower stress plateaus appear in the stress strain curves during loading and unloading in association with the spreading and shrinking of SIMT bands on the surface of the tape specimens. In the case of unloading from the upper stress plateau under a low stress rate, an increase in strain occurs due to the spreading of the SIMT bands at the start of the unloading.
(2) If stress is held constant at the upper stress plateau after loading up to a strain of 2%under a constant stress rate, creep deformation occurs due to the spread of the SIMT process. The creep strain rate under the constant stress is almost constant. It increases in proportion to the increase in the volume fraction of the M-phase.
(3) If strain is caused to vary at the stress plateaus during loading and unloading, a return point memory appears in the reloading part of the stressstrain curve. Each new spreading and shrinking cycle of the SIMT bands starts from the boundary left over from the preceding SIMT process.
(4) The angle of inclination of the SIMT band boundaries to the tensile axis of the tape is 33° for an aspect ratio of 5. For an aspect ratio of 10, the angle of inclination is 42° in the central part of the specimen and 37° in the vicinity of the two fixed ends. The directions of inclination of the leading edges of the two converging SIMT bands are in mirror symmetry in the initial part of the SIMT process, but just before the bands combine in the completion of the process, a change in symmetry occurs leaving the inclinations complementary.
Acknowledgements
The experimental work was carried out with the assistance of students of Aichi Institute of Technology, to whom the authors wish to express their gratitude. The authors wish
(a)
[image:6.595.62.278.72.377.2](b)
2) K. Otsuka and C. M. Wayman:Shape Memory Materials, (Cambridge University Press, Cambridge, 1998) pp. 149.
3) S. Miyazaki: SMST-2007, (ASM Int. Materials Park, Ohio, 2008) pp. 1520.
4) K. Tanaka, S. Kobayashi and Y. Sato:Int. J. Plasticity2(1986) 5972.
1281.
12) Y. J. He and Q. P. Sun:Int. J. Solids Struct.47(2010) 27752783.
13) G. Murasawa, K. Kitamura, S. Yoneyama, S. Miyazaki, K. Miyata, A. Nishioka and T. Koda:Smart Mater. Struct.18(2009) 114.