(Received June 16, 2008; Accepted July 23, 2008; Published September 3, 2008)
Keywords: silver palladium copper gold alloy, solution treatment, microstructure, dynamic hardness, composition, hardening mechanism
1. Introduction
The mechanical properties and corrosion resistance of Ag-Pd-Cu-Au casting alloys vary according to the structures formed during casting and subsequent heat treatment.1,2)
There are numerous reports on post-casting heat-treatment-induced changes in the structure and mechanical strength of Ag-Pd-Cu-Au casting alloys.3–6) Seol et al.6) examined isothermal age-hardening behavior, phase transformation, and related microstructural changes. Guoet al.7)investigated hardness and microstructure of heat-treated Pd-Ag dental alloys containing Sn and In, examining the relationship between precipitation and change in hardness. Increasing tensile strength and hardness of Ag-Pd-Cu-Au alloys by high-temperature solution treatment has been reported. Ruptured surface observation and X-ray diffraction studies suggested that one cause of this strengthening is that solution treatment converts the1andphases to thesolid solution phase.4)
However, the details of the diffusion process by which multiphase structures convert to a single phase and the hardness change of each resulting microstructure remain unclear.
Ag-Pd-Cu-Au alloy castings are applied as dental restora-tions after heat treatment, either for softening or hardening, according to clinical requirements. It is clear that the solution treatments of this alloy at temperatures around 700 and 850C lead to softening and hardening, respectively. How-ever, the cause and mechanism of hardness change of multiphase alloy castings by means of solution treatment temperature remain unclear.
For the as-cast sample and samples solution-treated at 50C intervals from 650 to 850C, we observed the metal and crystal structures by scanning electron microscopy (SEM) and X-ray diffraction (XRD), and measured the elemental distribution and dynamic hardness of individual micro-structures by use of electron probe microanalysis (EPMA) and dynamic ultra-micro hardness tester, respectively. The purpose of this investigation is to explore the possibility of a reasonable and effective heat treatment method applicable to the Ag-Pd-Cu-Au alloy that fulfills necessary
requirements by clarifying the hardness change mechanism of this alloy.
2. Materials and Methods
2.1 Materials
A commercial dental Ag-Pd-Cu-Au casting alloy (CAST-WELL M.C. 12% GOLD: 46Ag-20Pd-20Cu-12Au-2tr., GC, Tokyo, Japan) was used.
2.2 Sample preparation
Cast plates (10mm10mm1:5mm and 20mm
20mm0:4mm) were prepared. After casting, molds were allowed to cool to room temperature, and the plates were removed (as-cast sample). The plates were heated in an electric furnace at 650, 700, 750, 800, or 850C, each for 30 minutes, and then rapidly cooled in water (solution treat-ment). The surface of the plates was metallographically polished with SiC papers (#400!#800!#1000), and then with 0.3mmaluminum suspension.
2.3 Measurement and analysis
2.3.1 Hardness test
A dynamic ultra-micro hardness tester (DUH-201S, Shimadzu, Tokyo, Japan) was used for the dynamic hardness test. Dynamic hardness (DH) is defined as follows:8)
DHðGPaÞ ¼3:8584P=D2
PandDrepresent the indentation load (mN) and depth (mm), and 3.8584 is the coefficient using a triangular pyramid indenter with a tip angle of 115.
The indenter was pressed into the plate specimen at a loading velocity of 13.2 mNs1, until the load reached a
available measurements (n=4) was obtained. The Vickers hardness of the alloy was measured on the same sample, using a Vickers hardness tester (MVK-E, Akashi, Tokyo, Japan) at a load of 50 g (490 mN) and a retention time of 15 s (n¼3). For statistical analysis, a t-test was performed (p<0:05).
2.3.2 SEM
To confirm the metal structure and the location (micro-structure) of the indents made during the dynamic hardness test, the samples were observed after the test by SEM (S-4700, Hitachi, Tokyo, Japan), at an acceleration voltage of 20 kV and magnification of 1500 times.
2.3.3 SEM/EPMA analysis
The as-cast and solution-treated samples were subjected to surface (50mm50mm) and point analysis at an acceler-ation voltage of 15 kV and a probe current of2:95108A, using an SEM/EPMA (JXA-8900L, JEOL, Tokyo, Japan).
Point analysis was performed at three sites in each micro-structure, and the mean value was regarded as the compo-sition of the microstructure.
2.3.4 X-ray diffraction
The as-cast and solution-treated samples were subjected to X-ray diffraction using an X-ray diffractometer with CuK
rays (JDX-3500, JEOL, Tokyo, Japan). The glancing angle was fixed at 3 from the incident angle. The profile of diffraction peaks was obtained, and the peak sources were determined from references.
3. Results
3.1 SEM images
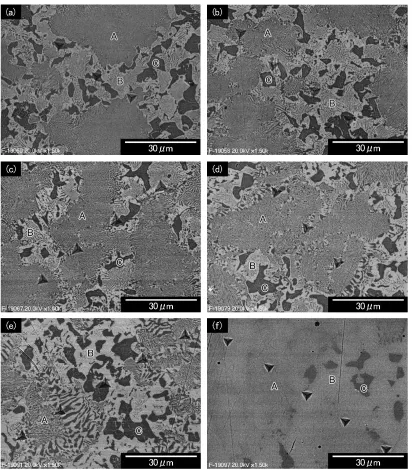
Figure 1 shows SEM images of sample surfaces following the dynamic hardness test of the as-cast sample and samples solution-treated at 650, 700, 750, 800, and 850C for 30
[image:2.595.93.505.69.539.2]minutes. The as-cast sample consisted of three different microstructures: a eutectic, fingerprint-like structure (Struc-ture A), a white matrix phase with wider layers (Struc(Struc-ture B), and a black island-like phase with Widmansta¨tten structure (Structure C). From the Ag-Pd-Cu ternary phase diagrams,9)
it is conjectured that Structures A and B consist of both1
(dark regions) and2 (light regions) phases, while Structure
C is the 1 phase with (PdCu) phase.10) Structure C was
surrounded by Structure B. The metal structures after treatment at 650 and 700C were similar to those of the as-cast sample. The treatment at 750C tended to cause the layer structure of Structure B to disappear. Solution treatment at 800C produced a12-mmwide-striped phase, while the layer structure of Structure B was lost. In the sample treated at 850C, Structures A and B were indistinguishable; that is, the boundaries between Structures A and B became indistinct and the structures tended to homogenize. Structure C no longer had a Widmansta¨tten structure.
3.2 SEM/EPMA analyses
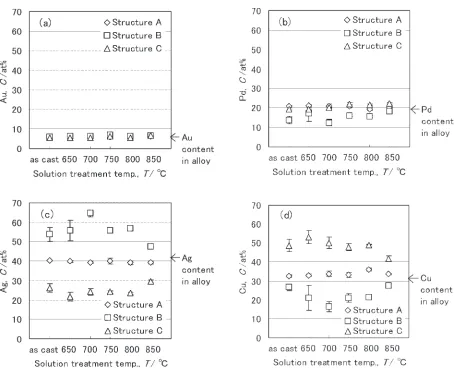
Figure 2 shows elemental concentration (at%) of each microstructure of as-cast and solution-treated samples. The Au concentrations in all three structures were consistent with each other and independent of treatment temperature.
The Pd concentrations in Structures A and C were nearly
equivalent, and were independent of treatment temperature. In Structure B, the Pd concentration of the as-cast sample was lower than in Structures A and C, but tended to increase slightly with increasing treatment temperature, approaching the concentration of Structures A and C at 850C.
Ag was unevenly distributed among the structures. The Ag concentration was highest in Structure B, followed by Structures A and C, regardless of treatment temperature. The Ag concentration in Structure A remained relatively constant with increasing treatment temperature. In Structure B, the Ag concentration was unaffected by heat treatment below 800C, with an exception at 700C treatment. The Ag concentration in Structure B decreased after treatment at 850C, falling to a level near the concentration of Structure A. The Ag concentration in Structure C remained constant at as-cast levels for samples heated to 800C or less, but increased with 850C treatment, coming close to the concentration of Structure A.
The Cu concentration also varied among structures. It was highest in Structure C, where Ag concentration was lowest, followed by Structures A and B. The Cu concen-tration in Structure A did not change significantly with increasing treatment temperatures, while the concentration in Structure B decreased after heat treatment between 650 and 800C. Cu concentration in Structure B increased after
[image:3.595.71.525.66.443.2]treatment at 850C, reaching almost the concentration of Structure A. In Structure C, the Cu concentration did not change after treatment below 800C, and dropped, approach-ing the concentration of Structure A after treatment at 850C.
In summary, no change in Ag or Cu concentration was observed in Structure A after solution treatment, but rapid equalization of Ag and Cu concentrations occurred during treatment at 850C in Ag-rich Structure B and Cu-rich Structure C.
3.3 X-ray diffraction analyses
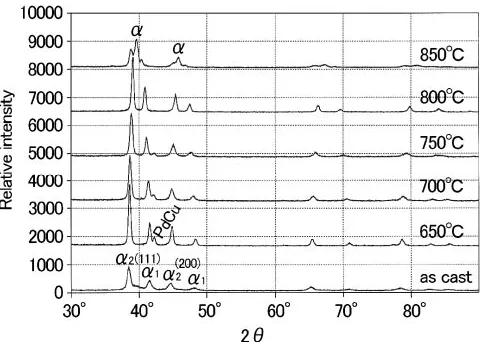
Figure 3 shows X-ray diffraction profiles of as-cast and heat-treated samples. In the as-cast sample, four peaks were detected at2angle between 30and 50. A vertical section of the three-dimensional diagram of the Ag-Pd-Cu ternary alloy9)shows that
1and2phases are generated around the
composition of the used alloy. Furthermore, the2angles of the peaks were consistent with those in the references.10–13)
Thus, peaks at angles2¼38:4and 44.6were assigned to Ag-rich 2 (111) and (200), respectively. Peaks at angles 2¼41:5and 48.2 were assigned to Cu-rich
1 (111) and
(200). The intensity of these peaks increased markedly and their FWHM (full width at half maximum) decreased at 650C. The2angles of the2(111) and (200) peaks shifted
to 0.3 higher than those of the as-cast sample, and the1
(111) and (200) peaks shifted by 0.1. Additionally, a peak arising from(PdCu) appeared at 42.2.4,12,13)After 700 and
750C heat treatment, the intensity of these five peaks decreased, relative to 650C. The 2 of the
2 (111) and
(200) peaks at 750C shifted higher by 0.2 and 0.1, respectively, while the1(111) and (200) peaks shifted lower
by 0.5 and 0.7, respectively, from those of 650C. The (PdCu) peak disappeared at 800C. At 850C a new peak, assumed to arise from , appeared with a reduction in the 2and1 peak intensities.
3.4 Dynamic hardness and Vickers hardness
Figure 4 shows the dynamic hardness of the individual microstructure and Vickers hardness of the as-cast and solution-treated samples. The Vickers hardness of the as-cast
sample was 198 Hv. The lowest hardness (156 Hv) was obtained from the sample treated at 650C. Hardness slowly increased with increasing treatment temperature, and mark-edly increased to 271 Hv after 850C treatment. According to a t-test, no statistically significant differences were present among samples heated to 650, 700, and 750C, but the hardness after 850C treatment was significantly higher than the others (p<0:05).
The mean dynamic hardness was highest in Structure A, followed by Structures C and B in all samples tested. In contrast, the dynamic hardness of the as-cast sample was 245–260DH in all structures, with no significant difference between structures (p>0:05). The hardness of Structures A, B and C decreased with heat treatment temperature up to 700C. They increased with treatment above 750C, steeply increasing to their maxima of 344, 325, and 340 DH at 850C, respectively. At-test shows no significant differences in single-structure hardness between samples treated at 650, 700 and 750C (p>0:05). The hardness of Structures A and B after treatment at 800C were significantly higher than those after treatment at lower temperatures (p<0:05), and the hardness of Structure C after treatment at 800C was significantly higher than that after 700C treatment (p<0:05). The hardnesses of all the structures of samples treated at 850C were remarkably higher than those of samples treated under other conditions (p<0:05). Solution-treatment-induced changes in dynamic hardness of the individual structure were parallel to changes in the Vickers hardness.
4. Discussion
The Ag-Pd-Cu-Au dental alloy, which was allowed to cool after casting, had a multiphase structure. Thus, the as-cast alloy has a risk of corrosion in the oral environment according to the electrochemical activity arising from heterogeneity in the metal structure. It is well known that Pd plays an important role in improving the corrosion resistance of this alloy. However, obtaining a homogenous
Fig. 4 Dynamic and Vickers hardness of samples, both as-cast and solution-treated at various temperatures.
[image:4.595.49.291.71.242.2] [image:4.595.312.548.73.270.2]suggesting that heat treatment releases the strain generated by casting, improving crystallinity and reducing hardness. On the other hand, elemental distribution in each structure remained constant, and no diffusion between structures occurred in this temperature range. However, elemental rearrangement and short-range diffusion within each struc-ture probably do occur, since the2 and1peaks shifted to
higher and lower angles, decreasing and increasing lattice parameters, respectively, and changing the dynamic hard-ness. In addition, solution treatments lead to the formation of a (PdCu) ordered phase. Less of this (PdCu) phase forms as treatment temperature increases, and the phase is not present after 800C treatment, where a distinct change is observed in SEM images. The layered 1 comprising
Structure B tends to disappear, and diffusion within the structure is verified.
When the treatment temperature is increased to 850C, the diffusion occurs not only within each structure, but also between the structures. The differences in elemental concen-tration between structures after 850C treatment are obvi-ously smaller than these differences after lower temperature treatment. SEM images show an appearance of uniformity; that is, in addition to disappearance of the layered structure of Structure A, Structure A becomes fused with Structure B. Furthermore, the change in crystal structure from1and2to
confirms diffusion. Therefore, the mutual diffusion of elements between structures contributes to increased hard-ness, suggesting the occurrence of solid solution strengthen-ing. Tanakaet al.14)reported that precipitation hardening of heated then quenched, supersaturated Cu and Pd resulted from the formation of metastable0. Toyama15)also reported the contribution of the 0 to precipitation hardening. The strengthening of high-temperature solution-treated Ag-Pd-Cu-Au alloy would result from a combination of these same mechanisms.
Even solution treatment at 850C cannot produce com-pletely homogenized structures, however it is likely that the structure is fairly uniform since each structure has a similar elemental distribution and high hardness.
(4) Solution treatment at a temperature of 850 C contrib-utes to significant diffusion between microstructures and results in a crystal change tophase, leading to a hardness increase due to solid solution strengthening. (5) Solution treatment at lower temperatures (650–750C)
of this alloy would be applicable to softening heat treatments, while that of higher temperature (850C) would be applicable to hardening heat treatments.
Acknowledgement
This study was partially supported by grants from the High-Tech Research Project (2005–2009) and Open Re-search Project (2007–2011) of the Ministry of Education, Culture, Sports, Science and Technology of Japan.
REFERENCES
1) S. Drapal and J. Pomajbik: J. Dent. Res.72(1993) 587–591. 2) S. Saitoh, Y. Araki and M. Taira: Dent. Mater. J.25(2006) 316–331. 3) S. Tanaka: J. Japan Soc. Dent. Appar. Mat.21(1980) 271–276. 4) H. Fukui, S. Shinoda, M. Mukai, K. Yasue and J. Hasegawa: J. J. Dent.
Mater.11(1992) 141–148.
5) K. Hattori, Y. Hata and S. Goto: J. Jpn. Prosthodont. Soc.40(1996) 980–992.
6) H. J. Seol, D. H. Lee, H. K. Lee, Y. Takada, O. Okuno, Y. H. Kwon and H. I. Kim: J. Alloy. Compd.407(2006) 182–187.
7) W. H. Guo, W. A. Brantley, D. Li, W. A. T. Clark, P. Monaghan and R. H. Heshmati: J. Mater. Sci.: Mater. Med.18(2007) 111–118. 8) Y. Yamamoto and T. Nishimura: Shimadzu Review 50 (1993)
321–329.
9) I. Miura and K. Asaoka:Dental Silver Alloys, (Ishiyaku Publishers, Inc., Tokyo, 1981) pp. 46–47.
10) K. Endo and H. Ohno: J. Mater. Sci.: Mater. Med.14(2003) 427–434. 11) H. Hero, R. Jorgensen, E. Sorbroden and E. Suoninen: J. Dent. Res.61
(1982) 673–677.
12) L. Niemi and H. Hero: J. Dent. Res.63(1984) 149–154.
13) H. Fukui, M. Mukai, S. Shinoda and J. Hasegawa: J. J. Dent. Mater.12 (1993) 685–690.
14) Y. Tanaka, H. J. Seol, T. Ogata, E. Miura, T. Shiraishi and K. Hisatsune: J. J. Dent. Mater.22(2003) 69.