Effect of Tool-Modeling Accuracy on Square-Cup Deep-Drawing Simulation
*Takayuki Hama
1, Masato Takamura
2, Akitake Makinouchi
3,
Cristian Teodosiu
3and Hirohiko Takuda
11
Department of Energy Science and Technology, Kyoto University, Kyoto 606-8501, Japan
2Advanced Vehicle Manufacturing and Prototype Technology Department, Nissan Motor Co., Ltd., Atsugi 243-0192, Japan 3Volume-CAD System Research Program, The Institute of Physical and Chemical Research, Wako 351-0198, Japan
In this study, the effect of tool-modeling accuracy on a finite-element simulation of a square-cup deep-drawing process is examined. First, the accuracy of tool modeling using a conventional approach, in which polyhedral surfaces are used, is compared with that of an alternative approach, in which the quadratic parametric surfaces proposed by Nagata [Nagata, Comput. Aided Geom. D22(2005) 327–347] (Nagata patch) are used. It is clear that the Nagata patch yields a much more accurate tool geometry than the conventional approach with regard to the shape and normal vectors of the tool. Next, simulations of the square-cup deep-drawing process are carried out for die models with various numbers of tool elements. It was found that a polyhedral model with at least 10 divisions at the die shoulder is required to carry out accurate simulations. The simulated result of the Nagata patch model with two patches at the die shoulder corresponds well to that of the polyhedral model with more than 10 patches. From this point of view, it is concluded that the number of tool elements can be markedly decreased using the Nagata patch model. In the present case, the number of tool elements can be reduced to about 10% of that of the polyhedral model.
[doi:10.2320/matertrans.P-MRA2007885]
(Received May 31, 2007; Accepted October 27, 2007; Published January 25, 2008)
Keywords: sheet metal forming, numerical analysis, tool-modeling accuracy, polyhedral approximation, quadratic polynomial patch, elastic-plastic finite-element method
1. Introduction
In the automotive and die manufacturing industries, digital manufacturing systems using finite-element methods (FEMs) for sheet forming processes have enabled cost reduction and a shortening of delivery periods. The prediction accuracy for shape defects including springback and surface deflection is, however, still inadequate, and the establishment of technol-ogies for improving simulation accuracy is an urgent and challenging task.1,2)
Considering simulations of surface deflection, it is gen-erally estimated that elastic recovery, the main cause of this defect, should be predicted with an accuracy on the order of 10mm; hence, the elastic deformation of tools and machines should be taken into account to achieve accurate calcula-tion.1) Recently, the coupled analysis of the elastoplastic sheet deformation with the elastic deformation of tools has been carried out for this purpose.3,4) In general, it is considered that tool surfaces need to be finely discretized. Tool models may be large when discretizing not only their surfaces but also their entire regions in order to take their elastic deformation into account, leading to significant problems in model preparation and in calculations. To solve this problem, the authors have developed an efficient algorithm to deal with the contact between a sheet and deformable tools, which is refined to allow for the coupling of the effects between nonlinear elastoplastic and linear elastic bodies in the framework of a static explicit time integration scheme, by degenerating the deformation of tools into the degrees of freedom of nodes comprising the tool surfaces.4) The algorithm enables much more efficient calculation than the conventional approach, in which the deformation of the entire region is taken into account. Since the calculation time and the size of tool models depend largely on the number of
tool elements comprising the tool surfaces, techniques to represent tool surfaces with both fewer elements and a good accuracy are required for a more efficient simulation. However, studies in which the effects of tool-modeling accuracy on simulated results are examined are scarce; hence, the tool-modeling accuracy required to achieve accurate simulation is not clear and there is only empirical evidence that contact surfaces need to be finely discretized.
Recently, the authors have proposed new techniques5)of sheet-metal-forming simulation using the quadratic para-metric smoothing of discretized surfaces proposed by Nagata6)(hereafter referred to as the Nagata patch) for tool surfaces. The Nagata patch yields an accurate and simple geometrical description that cannot be obtained using the standard polyhedral representation. Using the new tech-niques, the accuracy of the contact description between the sheet nodes and the smoothed tool surfaces is increased, thus allowing robust and accurate contact analysis. At the same time, it is expected that the Nagata patch representation requires a much smaller number of tool elements to obtain the same level of shape accuracy for a polyhedral representation; hence, a more efficient simulation can be carried out.
With the aim of reducing the number of tool elements in the sheet-metal-forming simulation using the Nagata patch representation, in this paper, we describe the efficiency of the Nagata patch representation in a finite-element simulation of a square-cup deep-drawing process. The tool-modeling accuracy required for accurate simulation is clarified first, followed by an examination of the efficiency of the Nagata patch representation to reduce the number of tool elements.
2. Static-Explicit FEM Code STAMP3D
In this study, the static-explicit elastoplastic FEM code STAMP3D7)is used. The updated Lagrangian rate formula-tion is employed. Assuming that the rate-form equilibrium is preserved from timetto timetþt, wheretis a small time
*This Paper was Originally Published in Japanese in J. JSTP48(2007) 61–
65.
increment, all the rate-form quantities can be replaced by incremental forms as
ðJÞ¼ðJÞt; f ¼ ff_t; L¼Lt; ð1Þ
whereðJÞis the Jaumann rate of the Kirchhoff stress tensor,f
is the surface traction andLis the velocity gradient tensor. To preserve the approximate linearity during the increment, the generalized rmin-strategy is employed to appropriately limit the size of the increment.
3. Contact Treatment
3.1 Basic formulation
The master-slave algorithm is employed in STAMP3D, in which sheet nodes and tool elements are considered to be slave nodes and master segments, respectively. A penalty method is employed to satisfy the impenetrability condition. Sheet nodes in contact with tools were not projected onto the tool surfaces even if they deviated from the tool surfaces due to curvature of the tool surfaces for the following reasons: (1) the generation of nonequilibrated forces due to the explicit time-marching algorithm is prevented, and (2) the penetra-tion of the sheet nodes into the tools is occasionally encouraged by the projection when employing shell ele-ments, since it is difficult to treat double-sided contact properly with shell elements. However, if the tools are modeled with sufficient accuracy, the deviation of the sheet nodes from the tool surfaces may be reduced to a negligible level, since time increments are small in the static-explicit approach.
3.2 Tool modeling
The tools are considered to be rigid and their surfaces are discretized using a set of triangular patches8) (hereafter referred to as the polyhedral model). The polyhedral model was developed by discretizing original CAD data in IGES format using VOBJ Creator developed by Systems Planning, Co., Ltd. Unit tool normal vectornkat tool nodekis uniquely
defined by averaging the tool normal vectors defined on all adjacent elements as
nk¼X
m
Smnm
, X
m
Smnm
; ð2Þ
wherenmis the unit normal vector to element m.Smis the
weighting factor, which is defined to be equal to the area of elementm. Hereafter, the tool normal vectornat an arbitrary point is defined as
n¼X
3
k¼1
Nknk
,
X3
k¼1
Nknk
; ð3Þ
whereNk (k¼1;2;3) are the shape functions for a 3-node
triangular element. Planar triangular patches are assumed in the polyhedral model, and hence the contact search is carried out between the sheet nodes and the planar triangular patches. It should be noted that the tool normal vector ndefined by eq. (3) are not necessarily consistent with the shape of discretized tool surface. The readers are referred to the original papers, namely, Refs. 8) and 9), for an explanation of the contact treatment using the polyhedral model.
The Nagata patch model6) is obtained by replacing the
planar triangular patches in the polyhedral model with the Nagata patches. The Nagata patch is a quadratic parametric interpolator. The algorithm does not involve free parameters, and the interpolated surface yields an accurate and simple geometrical description that cannot be obtained using the standard polyhedral approximations.5) The new techniques for contact analysis using the Nagata patch improve the accuracy of the contact description between the sheet nodes and the smoothed tool surfaces, while the positions of the contact points can be analytically obtained, thus allowing for robust and accurate contact analysis. The readers are referred to the original papers, namely, Refs. 5) and 6), for the detailed formulations of the Nagata patch and of the contact analysis using the Nagata patch model.
In the Nagata patch model, the normal vectors that are consistent with the original CAD surfaces are given at the element nodes, and the surface is represented by a set of quadratic parametric surfaces, which are determined only by the positions and normal vectors of the vertices of polyhedral meshes.5) A tool normal vector at an arbitrary point is calculated as the cross product of two vectors tangential to the Nagata patch, thus being consistent with the tool shape. The contact search is carried out between the sheet nodes and the Nagata patches.
As explained above, the definitions of the shape and normal vectors differ between the polyhedral and Nagata patch models; hence, their accuracies should be separately evaluated when examining tool-modeling accuracy. How-ever, tool normal vectors are in general determined using the discretized model,10) as in eqs. (2) and (3); hence, their accuracy is not assured, and has not even been studied. Therefore, the effect of these two accuracies on simulation accuracy is not separately evaluated in this paper and will be examined elsewhere.
4. Square-Cup Deep-Drawing Simulation
4.1 Simulated conditions
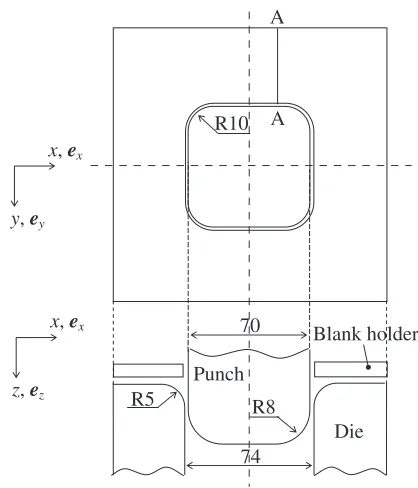
Simulations of a square-cup deep-drawing process of a mild steel sheet, which was employed in the benchmark of NUMISHEET’93,11) are carried out. The geometries of the tools employed in the simulations are schematically shown in Fig. 1. The size of the blank is 150mm150mm with a thickness of 0.78 mm. Owing to the symmetry of the process, only a quarter of the sheet is modeled by 4-node degenerated shell elements. The sheet is uniformly divided in each direction with a mesh size of 2.5 mm; thus, the total number of elements is 900. The mechanical properties of the sheet material are shown in Table 1. Coulomb’s friction law is employed for the contact sheet nodes with a friction coefficient of 0.14. The calculation is carried out to a punch stroke of 40 mm.
4.2 Evaluation of tool-modeling accuracy
of the shape and normal vectors. The shape and normal vector errorssandnat an arbitrary point on the die shoulder
are respectively defined as
s¼ ð5 kxokÞ=5100 ½%; ð4Þ
n ¼sgnft ðVnÞgkVnk 100 ½%; ð5Þ
wherexis the position vector of the point,o is the position vector of the center of the die shoulder curvature along line A-A, andV is the unit tool normal vector calculated at the point.tandnare the unit tangent and normal vectors to the exact die shoulder with a radius of 5 mm, respectively, and satisfy both of the following relations:
n¼ ðxoÞ=kxok; nt¼ex; ð6Þ
whereexis the base vector shown in Fig. 1. The smaller the
values ofjsjandjnj, the more precise the modeling is.
4.3 Comparison of tool-modeling accuracy
Die models with various numbers of divisions at the die shoulder are prepared, and their tool-modeling accuracies are examined. Figure 2 shows some examples of the discretized die shoulder. The meshes are not uniform along the die shoulder and are particularly fine at the boundary between the straight and curved parts. The number of divisions at the die shoulder is therefore difficult to clearly define. On the other hand, the meshes are uniformly made in the circumferential direction. In this study, the number of divisions at the die shoulder n along the parting line in the circumferential direction, shown by line B-B in Fig. 2, is chosen. Figures 3 and 4 respectively show the shape and normal vector error distributions along the die shoulder in the case of n¼6, shown in Fig. 2. The absolute value of the shape errors is at most about 2% in the polyhedral model, whereas it is only about 0.02% in the Nagata patch model. The shape errors are
distributed periodically depending on the tool mesh in both the polyhedral and Nagata patch models, although those of the Nagata patch model are too small to be visible in Fig. 3. These tendencies are also observed in the other die models with different numbers of divisions.
For the normal vector error distribution shown in Fig. 4, the Nagata patch model yields much more accurate normal vectors as well as a much more accurate shape than the polyhedral model. In the polyhedral model, large errors are observed at the boundary between the curved and straight parts and at the part where the mesh size changes. These errors are due to the changes in the mesh size and curvature. The normal vector errors as well as the shape errors in the Nagata patch model are distributed periodically depending on the tool mesh, while they are almost independent of the tool mesh in the polyhedral model. This is due to the fact that the normal vectors are not consistent with the shape in the
R8 R5
74
Blank holder
Die Punch
70 x, ex
z, ez
R10 x, ex
y, ey
A
A
[image:3.595.319.528.71.315.2]Fig. 1 Geometries of tools (in mm) employed in simulations. Table 1 Material properties used in simulations.
E/MPa ratio y /MPa
Fvalue
/MPa nvalue "0 rvalue
206000 0.3 173 565 0.26 0.0071 1.77
(approximated by¼Fð"0þ""pÞn)
B
A
A
A
A
A
A
A
A
n
= 2
n
= 6
n
= 10
n
= 16
B
B
B
B
B
B
B
Bird’s-eye view of
discretized die model
[image:3.595.46.291.84.125.2] [image:3.595.156.440.579.767.2]polyhedral model, as explained in section 3.2. Such tenden-cies in the normal vector distributions are also observed in the other die models that have different numbers of divisions, showing that it is difficult to control the normal vector error distribution in a polyhedral model.
Figures 5 and 6 show the relationships between the number of divisions and the absolute values of maximum errors. Note that the vertical axes have a logarithmic scale. The solid line in Fig. 5 is the maximum shape error distributionideal
s obtained using the ideal polyhedral model,
in which uniform meshes are formed at the die shoulder, which is given as
ideals ¼ ð1cosð=4nÞÞ 100 ½%: ð7Þ
It is clear that the maximum error distribution obtained using the polyhedral models can be roughly approximated by eq. (7) if the nonuniformity of the tool mesh is as large as those of the present die models. This result indicates that the maximum shape error in polyhedral models can be estimated by eq. (7) unless the nonuniformity is extremely large.
As shown in Fig. 5, the difference in shape error between the polyhedral and Nagata patch models increases as the number of divisions increases. This tendency corresponds well to that previously shown by Nagata.5)In the case of both of the die models employed in this study, the increase in the shape accuracy saturates at aboutn¼10. It is also clear that the shape accuracy obtained using the Nagata patch model forn¼2is roughly as good as that of the polyhedral model for n¼10. Similar tendencies are observed in the normal vector error as shown in Fig. 6. Note that similar results are obtained at any region of the die shoulder.
4.4 Comparison of simulated results
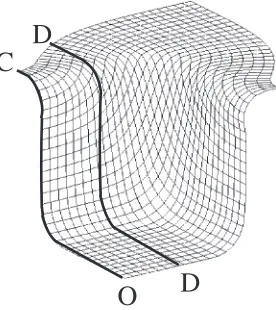
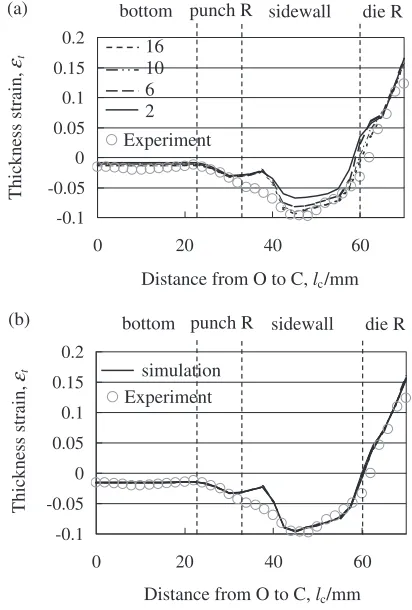
Using the die models withn¼2, 6, 10, and 16 (hereafter referred to as die 2, die 6, etc., respectively) shown in Fig. 2, simulations of the square-cup deep-drawing process are carried out with the punch, die, and blank holder represented by both the Nagata patch and polyhedral models. The punch model with 12 divisions at the shoulder part is used. Figure 7 shows the simulated product at a punch stroke of 40 mm. The effects of tool-modeling accuracy on the amount of draw-in and the thickness strain distribution along line O-C are examined, where the largest amount of draw-in is observed. For reference, the experimental results provided in NUMISHEET’9311)are also shown.
-2 -1.5 -1 -0.5 0 0.5
0 0.2 0.4 0.6 0.8 1
Dimensionless arc length, l
Shape error,
δs
(%)
Polyhedral model Nagata patch model
Fig. 3 Shape error distributions at die shoulder forn¼6.
-10 -5 0 5 10
0 0.2 0.4 0.6 0.8 1
Dimensionless arc length, l
Normal vector error,
δn
(%)
Polyhedral model
Nagata patch model
Fig. 4 Normal vector error distributions at die shoulder forn¼6.
0.0001 0.001 0.01 0.1 1 10 100
1 6 11 16
Number of divisions, n
Maximum shape error,
δs
max
(%)
Nagata patch model Polyhedral model
Eq. (7)
Fig. 5 Relationships between maximum shape error and number of divisions.
Fig. 6 Relationships between maximum normal vector error and number of divisions.
O
C
D
D
[image:4.595.69.270.72.197.2] [image:4.595.320.528.75.199.2] [image:4.595.319.530.248.379.2] [image:4.595.358.496.429.584.2]Figure 8 shows the amounts of draw-in along line O-C. The simulated results obtained with the Nagata patch and polyhedral models are hardly affected by the number of divisions at the die shoulder, and the difference shown in the results is at most in the range of 0.2 to 0.3 mm. Since this difference is much smaller than the total amount of draw-in and may be within the range of scattering in the experiment, it can be concluded that the effect of the number of divisions on the amount of draw-in is negligible for the present deep-drawing process.
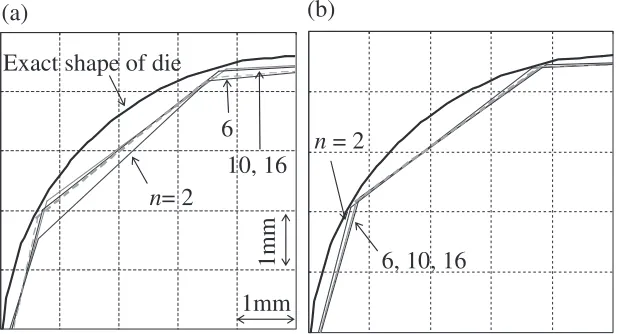
Figure 9 shows the thickness strain distributions along line O-C. When using the polyhedral model, the number of divisions at the die shoulder strongly affects the simulated thickness strain at the sidewall, as shown in Fig. 9(a). The simulated thickness strain distributions for die 10 and die 16 agree well with the experimental distribution, while that at the sidewall decreases and gradually deviates from the experimental distribution as the number of divisions is reduced (die 2 and die 6). This result is due to the difference in the deformation at the die shoulder. Figure 10 shows the deformed profiles at the die shoulder of the D-D cross section shown in Fig. 7 and the exact shape of the die shoulder. The D-D cross section is chosen since the sheet is in contact with the die shoulder over a wide area in this region; hence, the effect of the difference in the contact condition is clear. When using the polyhedral model, the degree of deformation at the die shoulder becomes small as the number of divisions is reduced (Fig. 10(a)), leading to a decrease in the thickness strain at the sidewall, as shown in Fig. 9(a). The difference shown in the simulated thickness strain distributions is much larger than that in the amount of draw-in (Fig. 8) and is not negligible. Therefore, this difference should be minimized using appropriate tool models.
When using the Nagata patch model, the four simulated thickness strain distributions agree well not only with each other, regardless of the number of divisions, but also with the experimental distribution (Fig. 9(b)). Moreover, the de-formed profiles at the die shoulder of the D-D cross section correspond well to each other, regardless of the number of divisions (Fig. 10(b)). These results clearly show that the Nagata patch model yields more accurate simulations, which are almost independent of the tool mesh, than the polyhedral model. A large deviation from the experimental thickness strain is observed at the boundary between the punch
shoulder and the sidewall in all the simulated results shown in Fig. 9. This deviation is due to the difference from the experiment in the deformation in this region, which is caused by factors such as the difference in the friction condition when fitting the punch shoulder; hence, it cannot be attributed to the die models examined in this study.
4.5 Discussion
When using the polyhedral model, the simulated thickness strain distribution clearly comes close to the experimental distribution as the accuracy of the tool modeling increases and saturates at approximatelyn¼10to 16, as observed in Fig. 9. These results show that the simulated results are hardly affected by the tool model in the present deep-drawing process when polyhedral models with more than 10 divisions at the shoulder part are employed.
The Nagata patch model for die 2 provides the tool-modeling accuracy of the polyhedral model for die 10, as shown in Figs. 5 and 6. Moreover, all the simulated results for the Nagata patch model shown in Figs. 8 and 9 correspond to those of the polyhedral model for die 10 and die 16. These results show that the polyhedral model for die 10 and the Nagata patch model for die 2 practically provide sufficient accuracy to prevent the simulation from being affected by the tool model. Clearly, the tool-modeling accuracy required for accurate simulations can be attained with a much smaller number of tool elements using the Nagata patch model. For instance, comparing die 10 and die 2, which are considered to be sufficient for the polyhedral and Nagata patch models, respectively, the total numbers of
0 5 10 15 20 25 30
Draw-in,
d
/mm
16 10 6 2 Exp.
Polyhedral model Nagata patch model
Exp. 16 10 6 2
n=
Fig. 8 Amounts of draw-in along line O-C.
Thickness strain,
εt
-0.1 -0.05 0 0.05 0.1 0.15 0.2
0 20 40 60
-0.1 -0.05 0 0.05 0.1 0.15 0.2
0 20 40 60
16 10 6 2
(b)
Distance from O to C, lc/mm
Thickness strain,
εt
(a) bottom punch R sidewall die R
Experiment
Distance from O to C, lc/mm die R punch R
bottom sidewall
Experiment simulation
[image:5.595.66.275.75.222.2]elements are 8048 and 753 for die 10 and die 2, respectively. Thus, the Nagata patch model requires only about 10% of the total number of elements required for the polyhedral model. Since the curved parts are only found in the shoulder regions in the present square-cup deep-drawing model, the number of elements can only be reduced in these regions. Considering the application of the Nagata patch model to tool models with more complicated shapes, the total number of elements can be reduced across the entire region; thus, a more significant advantage should be obtainable. The above results demon-strate the effectiveness of the Nagata patch model in reducing the number of tool elements.
5. Concluding Remarks
With the aim of reducing the number of tool elements in sheet-metal-forming simulation, in this paper, we described the effects of tool-modeling accuracy on square-cup deep-drawing simulation using the quadratic parametric surfaces proposed by Nagata (Nagata patch) for tool surfaces. It has been clarified that the tool-modeling accuracies of the polyhedral and Nagata patch models with at least 10 and 2 divisions at the shoulder parts, respectively, practically provide sufficient precision to make the simulated results independent of the tool model. Hence, in the case of the present deep-drawing model, the total number of tool elements can be reduced to about 10% of that of the polyhedral model using the Nagata patch model.
There are still several difficulties in carrying out coupled analyses of elastoplastic sheet deformation with the elastic deformation of tools using the Nagata patch, including the evaluations of the changes in the normal and position vectors of the Nagata patch due to deformation and the effect of tool mesh size on the analysis of the elastic deformation of tools. The amount of springback involved in the present
deep-drawing process is very small. The effect of tool-modeling accuracy on the stress distribution should also be examined in detail for the case when a large amount of springback is involved. These challenging problems will be tackled in future works.
Acknowledgments
The authors would like to acknowledge Dr. T. Nagata of the Institute of Physical and Chemical Research (RIKEN) for his fruitful advice on the Nagata patch.
REFERENCES
1) M. Takamura, H. Sunaga and A. Makinouchi: Proc. RIKEN Sympo-sium-1st Integrated Volume-CAD System Research (Riken, 2001) pp. 88–95. (in Japanese)
2) M. Takamura, H. Sunaga, T. Kuwabara and A. Makinouchi: JSAE Trans.35(2004) 145–150.
3) H. Tsutamori and F. Yoshida: J. Jpn. Soc. Technol.46(2005) 55–59. (in Japanese)
4) M. Takamura, K. Ohura, H. Sunaga, T. Kuwabara, A. Makinouchi and C. Teodosiu: J. Jpn. Soc. Technol.47(2006) 64–68.
5) T. Hama, M. Takamura, A. Makinouchi, C. Teodosiu and H. Takuda: Trans. JSME Part A72(2006) 60–67.
6) T. Nagata: Comput. Aided Geom. D22(2005) 327–347.
7) M. Banu, M. Takamura, T. Hama, O. Naidim, C. Teodosiu and A. Makinouchi: J. Mater. Process. Technol.173(2006) 178–184. 8) T. Hama, M. Asakawa, M. Takamura, A. Makinouchi and C. Teodosiu:
JSME Int. J. Ser. A48(2005) 329–334.
9) T. Hama, M. Asakawa, M. Takamura, A. Makinouchi and C. Teodosiu: Proc. JSME/ASME Int. Conf. Mater. Process. 2002 (Japan Soc. Mech. Eng., 2002) pp. 367–372.
10) Y. T. Keum, E. Nakamachi, R. H. Wagoner and J. K. Lee: Int. J. Numer. Meth. Eng.30(1990) 1471–1502.
11) A. Makinouchi, E. Nakamachi, E. Onate and R. H. Wagoner: Proc. 2nd NUMISHEET (NUMISHEET, 1993) pp. 623–652.