Solidification of High Chromium Cast Iron Substituted
by 25 to 70 mass%Ni for Fe
Kaoru Yamamoto
1, Mitsuo Hashimoto
2, Nobuya Sasaguri
1and Yasuhiro Matsubara
11
Kurume National College of Technology, Kurume 830-8555, Japan 2FUJICO Co., Ltd., Kitakyushu 804-0054, Japan
In (Fe, Ni)-Cr-C alloys, with Fe replaced by 25 mass%Ni–70 mass%Ni in high-chromium cast irons, the effects of Ni content on the solidification structure, solidification sequence, and liquidus surface diagram were investigated.
The microstructures of alloys consist of matrix and M7C3carbides precipitated as primary and/or eutectic crystals. They resemble general high-chromium cast iron except for mostly austenitic matrix. According to EDS analyses of alloy contents in each phase of specimens, the Cr content in M7C3carbide increases concomitantly with increasing Ni content, but that inexhibits almost no change.
Solidification begins by crystallization of primary austenite () in hypoeutectic alloy and that of primary M7C3carbide in hypereutectic alloy. Either case is followed by precipitation of (+M7C3) eutectic. However, graphite precipitates from melt in the alloys with C or high-Ni content and its precipitation region shifts to the low-C–high-Cr side as the high-Ni content increases. The (-M7C3) eutectic line on the liquidus surface diagram moves strongly to the low-C side with increased Ni content, but it returns to the high-C side when Ni contents become greater than 50 mass%. The diagrams produced using thermo-Calc software resemble those constructed based on experimental results.
[doi:10.2320/matertrans.F-M2009818]
(Received July 25, 2008; Accepted May 15, 2009; Published July 23, 2009)
Keywords: high-chromium cast iron, nickel substitution, solidification, M7C3carbide, graphite, heat and oxidation resistance
1. Introduction
High-chromium white cast irons are preferred for use in abrasion-resistant parts in mineral pulverizing and steel rolling mills because hard M7C3 eutectic carbides are
distributed in a Fe-base matrix. Because the matrix in high-Cr cast iron is insufficient for high-temperature resistance and oxidation resistance, however, the characteristics of the matrix at elevated temperatures must be improved to expand its application.
From the viewpoint of high-temperature wear resistance, high-Cr cast iron could be a useful material with both excellent abrasion wear resistance and oxidation resistance at elevated temperatures if high-temperature properties of the matrix were improved through addition of alloying elements and heat treatment.
Both Ni-base and Co-base super alloys are well known to have superior high-temperature and oxidation resistance.1–5) High-Cr cast iron has no existing matrix in super alloys. For that reason, the high-Cr cast irons cannot be expected to have good wear resistance at elevated temperatures. It is expected that high-temperature properties of the matrix of high-Cr cast iron could be improved if Ni were substituted for Fe. No reports in the literature describe high-Cr cast iron in which an alloying element is added to improve the matrix structure for high-temperature and oxidation resistance.
In this study, a large amount of Ni was added to high-Cr cast irons to clarify the effect of Ni content on the matrix structure, solidification sequence, and the liquidus surface diagram.
2. Experimental Procedures
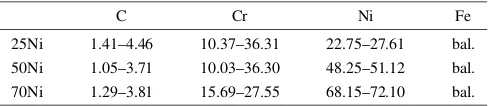
The chemical compositions of specimens are presented in Table 1. The Ni content was adjusted to 25, 50, and 70 mass%; the Cr content was changed within 10–36%. The C contents were also varied from 1.0–4.5% so that chemical
compositions from hypoeutectic to hypereutectic were obtained. Charge calculation for each specimen was con-ducted using raw matenals such as mild steel, pig iron, ferroalloys, and pure metals. The charge materials were melted at 1773 K using a Tunnman furnace and then poured into a CO2sand mold preheated at 473 K and a metal mold
with cavity size of 10300mm for thermal analysis and quench tests. The cavity size and cross-section of view of the CO2 mold are portrayed in Fig. 1. The observation and
identification of solidification structure were done using optical microscopy (OM), X-ray diffraction (XRD) and energy dispersed spectrometry (EDS). Specimens colored using Murakami’s reagent were used for optical microscopy; a deep-etched specimen was used for XRD.
[image:1.595.305.549.361.414.2]To investigate the solidification sequence of specimens, each specimen (50 g) was remelted at 1773 K in a high-frequency induction furnace under Ar atmosphere. Then thermal analyses were conducted at the cooling rate of 0.5 K/s. To observe the variation of the microstructure during solidification, some specimens were quenched into water at several temperatures during solidification. The precipitated phases and solidification sequences of specimens were determined using OM, XRD, and EDS. Furthermore, the liquidus surface diagrams of (Fe,Ni)-Cr-C pseudo-ternary system in each Ni level were constructed based on the kinds of primary phases identified. The phase diagrams constructed from these experiments are discussed through comparison with those calculated using software (Calc; Thermo-Calc Software AB).6)
Table 1 Chemical composition range of specimens (mass%).
C Cr Ni Fe
3. Experimental Results and Discussion
3.1 Relation between chemical composition and micro-structure
[image:2.595.61.277.72.291.2]As an example, the variation of as-cast microstructures of Fe-25%Ni-30%Cr-C and Fe-70%Ni-25%Cr-C alloys while changing the C content from 1.6 to 2.8% are presented in Fig. 2.
The structure consists of primary phase and eutectic constituents for specimens with low-C content and hypoeu-tectic composition. The amount of primary phase decreases with increased C content; then the eutectic structure is obtained at C content of about 2.0% for 25%Ni alloy and
exactly 2.4%C for 70%Ni alloy. In specimens with high-C contents of hypereutectic composition, hexagonal pounds were precipitated as primary phase. These com-pounds’ shapes resemble those of primary M7C3 carbides
observed in high-Cr cast irons.7–9) The Ni does not form
carbide. Therefore, it is assumed that the carbides precipi-tated as either primary or eutectic are possibly M7C3type.
To identify the precipitated phases, XRD and EDS were used for hypereutectic specimens with 25%, 50% and 70%Ni. The specimens were etched deeply by an etchant (5 g FeCl3 + 10 ml HNO3 + 3 ml HCl + 87 ml ethanol). The
matrix near the specimen surface was dissolved away. The XRD pattern was taken using a special sample folder that can rotate and tilt the specimen. The obtained peaks were-Fe, M7C3, and M23C6 carbides. The peak of M7C3carbide was
particularly strong.
Table 2 presents elemental concentrations of carbide phases and matrix phases in each specimen as obtained by EDS analysis. The Cr contents in the primary and eutectic carbides are 71–88%; the Ni content is lower than the Cr content. In the matrix, the Cr content is low and Fe and Ni contents are high. In both phases, the Fe content decreases and Cr content increases concomitantly with increased Ni content. A change of Cr content in the matrix changes slightly and that of Fe content is large when Ni content changes greatly. Therefore, it can be said that the added Ni is mostly substituted for Fe. The partition coefficient (k) of each alloying element to primary and M7C3 carbide was
calculated using Thermo-Calc software for Fe-Ni-25%Cr-C alloys. The relation between the partition coefficient and Ni content is presented in Fig. 3. Even if the Ni content increases to 70%, the partition coefficients of alloying elements to primary ( , , , ) change little. They show an almost identical value to that of plain Fe-Cr-C alloy without Ni. Regarding the partition coefficient of each
36
22
75
30
Exothemic powder
CO2mold
Fig. 1 Schematic cross-section view of the CO2mold.
70 Ni 25 Ni
1.6%C 2.0%C 2.4%C 2.8%C
[image:2.595.85.510.512.766.2]element to primary M7C3,kC ( ) is the same as that of
Fe-Cr-C alloy (kC¼2:51), irrespective of Ni content. On the
other hand, kNi ( ) and kFe ( ) to primary M7C3 increase
slightly with increasing Ni content, although kCr ( ) to
primary M7C3carbide increases considerably from 2.29% to
2.84%.
The reason why Cr contents in primary M7C3 carbide
increased from 73.28 to 87.63% as Ni content changes from 25 to 70% is explainable from this increase ofkCrassociated
with Ni content.
3.2 Solidification sequence
Thermal analysis curves of Fe-25%Ni-30%Cr-C alloys with hypoeutectic and hypereutectic compositions are de-picted in Fig. 4. Solidification of 1.5%C alloy proceeds in the order of primaryand (+M7C3) eutectic, whereas primary
M7C3 precipitates first, followed by (+M7C3) eutectic in
the 2.5%C alloy. Each solidification sequence resembles that of Fe-Cr-C alloy. In some alloys, the graphite is produced by a reaction of L!(+Graphite) eutectic from the residual liquid during the (+M7C3) eutectic reaction.
Although the small peaks of M23C6 carbide appeared on
the XRD chart, the exothermic point of M23C6 precipitation
does not appear on the thermal analysis curve; it can also not be found in the solidification structures. The reason might be that the M23C6 carbide precipitates on the mode of cooling
after solidification.
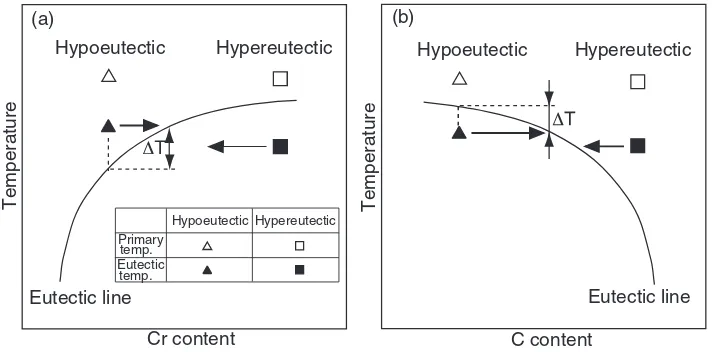
Figure 5 portrays a relation of primary and eutectic temperatures as determined from the thermal analysis curves vs. Cr contents of Fe-25%Ni-Cr-C alloys. Figure 6 shows the temperatures vs. C content. The eutectic lines drawn in both figures are determined from eutectic temperatures of the specimens with a eutectic structure. The eutectic temperature rises with an increase in Cr content up to 25%. When the Cr content increases to greater than 25%, the rise in temperature becomes gradual. In contrast, the eutectic temperature decreases with increasing C content; it does so abruptly with C contents of more than 3%. These results show that the eutectic temperature decreases from the composition of low-C–high-Cr to that of high-C–low-Cr.
Regarding the Cr content, the eutectic temperatures appear to be higher in hypoeutectic alloy ( ) and lower in hypereutectic alloy ( ) than those of eutectic alloy. When related to the C content, on the other hand, the eutectic
0 0.5 1.0 1.5 2.0 2.5 3.0
0 20 40 60 80 100
Partition coefficient of alloys
Ni content (mass%) kNi kFe kCr kC
M7C3
Fig. 3 Effect of Ni content on the partition coefficient of alloying elements to primaryand M7C3carbide in alloys of Fe-Ni-25%Cr with 1.5%C and 3.5%C (Thermo-Calc).
Hypoeutectic (1.5%C)
Hypereutectic (2.5%C)
L
L
L M7C3
M7C3
M7C3
L 1573 1673
1473
Temperature,
T
/K
10 s2
Time, t/s
Fig. 4 Thermal analysis curves of hypereutectic and hypoeutectic Fe-25%Ni-30%Cr-C alloys.
1450 1500 1550 1600 1650
10 15 20 25 30 35 40
Temperature,
T
/K
Cr content (mass%)
Eutectic line Hypo. Eutectic Hyper.
Primary temp. Eutectic
temp.
Fe-25%Ni-Cr-C alloys
[image:3.595.326.525.74.252.2]Fig. 5 Primary and eutectic temperatures vs. Cr content. Table 2 Elemental concentration of the phases in hypereutectic specimens
(mass%).
Cr Ni Fe
25Ni 73.28 2.40 24.31
Primary M7C3 50Ni 79.37 4.59 16.12
70Ni 87.63 4.94 7.43
25Ni 71.31 2.74 25.95
Eutectic M7C3 50Ni 77.34 5.36 17.30
70Ni 81.86 8.76 9.38
25Ni 11.83 35.05 53.12
Matrix 50Ni 12.95 55.92 31.13
[image:3.595.54.281.97.460.2] [image:3.595.320.535.304.500.2]temperatures are lower in hypoeutectic alloy ( ) and higher in hypereutectic alloy ( ) than those in eutectic alloy.
The reason is explainable using the schematic diagrams presented in Fig. 7. In diagram (a), which shows the relation of temperature vs. Cr content, both primary ( ) and (+M7C3) eutectic ( ) temperatures of hypoeutectic alloy
are higher than that of eutectic alloy at the same Cr content. Because the partition coefficient of Cr to primary (kCr)
is less than 1, the Cr content in the residual liquid is enriched as the primary grows. That is, the Cr content moves in the direction of an arrow ( ). Then the eutectic temperature that increases because of the Cr content comes the point at which the arrow crosses the eutectic line. In other words, this point is the eutectic temperature of a hypoeutectic alloy with the same Cr content of which the temperature is high atTðKÞ
from that of the eutectic alloy with same Cr content. In relation to the C content shown by (b), the C content in the residual liquid is also enriched with growth of primary
because the partition of C to primary (k
C) is less than 1.
Therefore, the C content of residual liquid changes in the direction of an arrow ( ); a eutectic temperature at the point where the arrow and the eutectic line cross each other is
obtained. Consequently, the eutectic temperature of hypo-eutectic alloy is low atTfrom that of the eutectic alloy with the same C content.
Regarding hypereutectic alloys, the partition coefficients of Cr and C to primary M7C3 carbide (kM7C3Cr andkM7C3C,
respectively) are larger than 1, so the concentration of Cr and C in the residual liquid decrease with growth of the primary M7C3 carbide. As a result, the actual eutectic temperatures
are obtained at the points of low Cr and low C content. The precipitation of graphite after the (+M7C3) eutectic
solidification might occur because of both the decrease in Cr, which is a strong carbide former, and the increase in C and Ni, which are strong graphite forming elements in the final liquid.9)
3.3 Liquidus surface diagram of Fe-Ni-Cr-C alloys
The liquidus surface diagrams of Fe-25–70%Ni-Cr-C alloys were constructed judging from as-cast microstructures of specimens varying C and Cr content widely. The diagrams are shown in Fig. 8 to Fig. 10. Symbols of , , in the figures respectively represent the microstructures with hypoeutectic, eutectic and hypereutectic composition. Solid symbols of , and denote specimens confirmed as including some graphite.
It is natural that graphite crystallizes in the liquid with high-C and low-Cr composition. Additionally, it is under-stood that the region of graphite crystallization will expand with an increase in Ni content because Ni is a graphite-forming element.
In each diagram, the (-M7C3) eutectic line judged from a
microstructures is drawn as a dashed line; that calculated using Thermo-Calc software is shown as a straight line. The eutectic line of Fe-Cr-C ternary alloy by Jackson11)is shown
as a broken line in this figure. Through comparison of the experimental results with calculated results, both eutectic lines are similar in Fe-25%Ni-Cr-C alloy, although they differ slightly from Fe-Cr-C alloy. In Fe-Ni-Cr-C alloys substituting 50% and 20% Ni for Fe, both eutectic lines are separated approximately in parallel. The gap is larger in the specimen with more Ni. In Fe-50%Ni-Cr-C alloy, as shown in Fig. 9, the calculated eutectic line shifts to the low-Cr– low-C side.
1450 1500 1550 1600 1650
1.0 1.5 2.0 2.5 3.0 3.5 4.0
Temperature,
T
/K
C content (mass%)
Eutectic line
Hyper. Hypo. Eutectic Primary
temp. Eutectic
temp.
Fe-25%Ni-Cr-C alloys
Fig. 6 Primary and eutectic temperatures vs. C content.
Eutectic line
Cr content
Hypereutectic Hypoeutectic
Temperature
C content
Eutectic line Hypoeutectic Hypereutectic
Temperature
Hypereutectic Hypoeutectic
Primary temp. Eutectic
temp.
(a) (b)
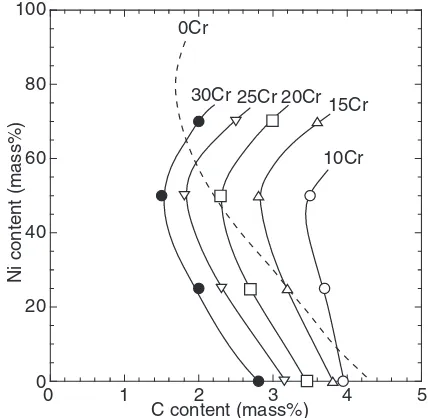
[image:4.595.63.276.73.269.2] [image:4.595.121.477.592.768.2]The C content of eutectic composition is varied according to the Ni and Cr contents. Therefore, the relation between C content of eutectic composition and Ni content in each Cr level is shown in Fig. 11. It is estimated from the cross-sectional phase diagram of Fe-Cr-C alloy12)that the C content
of the eutectic shifts to the low-C site when the Cr content increases. The C content of eutectic composition decreases gradually in each Cr level with Ni content to 50%, but it increases conversely with more than 50%Ni. Here, the C content of (-graphite) eutectic composition is obtained from the liquidus phase diagram of Fe-Ni-C ternary alloy by changing Ni content.13)The relation of C and Ni contents at
eutectic composition is also shown as a dashed line in Fig. 11. In Fe-Ni-C alloys, the C content of the eutectic decreases with increased Ni content until 70%; it increases with more than 70%Ni. This tendency resembles that of Fe-Ni-Cr-C alloy. The reason for this change remains unex-plained, but this might occur in cast iron with Ni.
Diagrams of alloys with the same systems were estimated using Thermo-Calc. They are shown as solid lines in Fig. 8 to Fig. 10. In the 25%Ni system (Fig. 8), the (-M7C3)
estimated eutectic line resembles the experimental one, but a slight difference is apparent between them at the high-Cr region. Nevertheless, a clear difference is apparent between experimental and calculated eutectic lines in alloy systems with 50%Ni and 70%Ni, as shown respectively in Fig. 9 and Fig. 10. The calculated eutectic line shifts to high-Cr–high-C site from the experimental line. Furthermore, when the amount of Ni increases to 70%, the calculated eutectic line moves to a low-Cr–low-C site from the experimental line and the difference between two eutectic lines is expanded. These differences might arise from an inappropriate database of Ni alloy used for this calculation at the high-C site. In Fe-Ni-Cr-C alloy, however, graphite precipitates in the primary area instead of Fe3C in the Fe-Ni-Cr-C diagram shown in Fig. 8.
40
30
20
10
0
1 2 3 4 5
C content (mass%)
Cr content (mass%)
0
M7C3
Hypoeut. Eut. Hypereut.
with Gr.
Experimental
Thermo-Calc Graphite
Eutectic line of Fe-Cr-C system (by Jackson10))
M3C
Fig. 8 Liquidus surface diagram of Fe-25%Ni-Cr-C alloy.
40
30
20
10
0
1 2 3 4 5
C content (mass%)
Cr content (mass%)
0
Graphite M7C3
Hypoeut. Eut. Hypereut.
with Gr.
[image:5.595.65.277.73.281.2]Experimental Thermo-Calc
Fig. 10 Liquidus surface diagram of Fe-70%Ni-Cr-C alloy.
40
30
20
10
0
1 2 3 4 5
C content (mass%)
Cr content (mass%)
0
Graphite M7C3
Hypoeut. Eut. Hypereut.
with Gr.
Experimental Thermo-Calc
Fig. 9 Liquidus surface diagram of Fe-50%Ni-Cr-C alloy.
0 20 40 60 80 100
C content (mass%)
Ni content (mass%)
0 1 2 3 4 5
0Cr
30Cr 25Cr 20Cr15Cr
10Cr
[image:5.595.321.532.74.280.2] [image:5.595.319.533.325.534.2] [image:5.595.64.276.328.530.2]Considering this fact, the calculated results closely resemble the experimental results. It is apparent that the graphite crystallized preferentially because of the fact the temperature of -M3C eutectic dropped and that of -graphite eutectic
closed by the addition of Ni.14) As described above, it is
possible that the results calculated using Thermo-Calc are useful for understanding the solidification of Fe-Ni-Cr-C alloys.
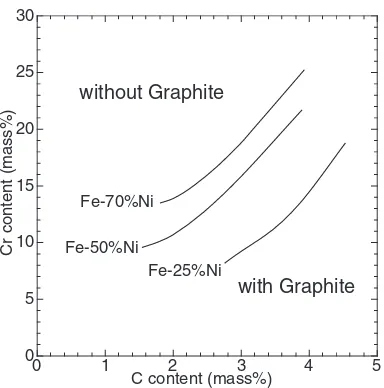
Because the graphite crystallizes at high-C–low-Cr site in these alloys, results show that the precipitation of graphite occurs even in 10–15%Cr cast irons through addition of Ni, although it is not found to occur in plain high-Cr cast irons because Cr is a strong carbide former. Figure 12 depicts effects of Ni, C, and Cr contents on the borderline of graphite formation. The borderline shifts clearly to the low-C–high-Cr site as the Ni content increases.
4. Conclusions
To change the matrix in high-Cr cast iron, Ni was added to cast iron up to 70% as a substitute for Fe. The effects of Ni substitution for Fe on the solidification structure and the liquidus surface diagram were investigated. The obtained results can be summarized as follows.
(1) Microstructures of these alloys comprise austenite () and M7C3 carbide. They resemble those of high-Cr cast
iron. The microstructure is changed only slightly by addition of Ni.
(2) In primary , the Ni concentration increases and Fe concentration decreases with increased Ni addition, although Cr concentration changes slightly. The effect of substitution of Ni on partition coefficients of alloying elements to primary
is small.
(3) In primary and eutectic M7C3 carbide, the Cr and Ni
contents increase and Fe content decreases with increasing Ni addition. The partition coefficient of Cr to M7C3 carbide is
increased greatly, whereas those of other elements are changed only slightly as the content of Ni is increased. (4) The (+M7C3) eutectic temperature rises to 20%Cr, but
the temperature increase becomes slight with contents greater than 20%Cr. In contrast, the eutectic temperature decreases gradually to 3%C and the degree of decrease declines at contents greater than 3%C.
(5) As the Ni content increases, the (-M7C3) eutectic line
shifts to the low-C side with Ni contents and the borderline existence of graphite shifts to the composition of low-C– high-Cr.
(6) The (-M7C3) eutectic line and the borderline of graphite
crystallization estimated using Thermo-Calc software closely resemble those confirmed through experimental results.
REFERENCES
1) T. Fujita and K. Shibata: Bull. Japan Inst. Metals16(1977) 231–239. 2) S. H. Kang, Y. Deguchi, K. Yamamoto and K. Ogi: Mater. Trans.45
(2004) 2728–2733.
3) T. Murakumo, T. Kobayashi, Y. Koizumi and H. Harada: Acta Mater. 52(2004) 3737–3744.
4) C. Walter, B. Hallstedt and N. Warnken: Mater. Sci. Eng. A25(2005) 385–390.
5) N. El-Bagoury, T. Matsuba, K. Yamamoto, H. Miyahara and K. Ogi: Mater. Trans.46(2005) 2478–2483.
6) B. Jansson, M. Schalin, M. Sellby and B. Sundman: Computer software in chemical and extractive metallurgy, ed. by C. W. Bale and G. A. Irons, (The Metal Society of CIM, Quebec, 1993) pp. 57–71. 7) K. Ogi, Y. Matsubara and K. Matsuda: Trans. AFS89(1981) 197–204. 8) Y. Matsubara, K. Ogi and K. Matsuda: IMONO48(1976) 706–711. 9) Y. Matsubara, K. Ogi and K. Matsuda: Trans. AFS89(1981) 183–196. 10) Y. Ono, R. Shimizu, N. Murai and K. Ogi: IMONO63(1991) 340–346. 11) R. S. Jackson: J. Iron Steel Inst.208(1970) 163.
12) V. K. Bungardt, E. Kuntze and E. Horn: Arch. Eisenhu¨tenwes. 29 (1958) 193.
13) G. V. Raynor and V. G. Rivlin: Phase Equilibria in Iron Ternary Alloys, (The Institute of Metals, London, 1988) p. 192.
14) Chuzo kougaku binran, (Maruzen, Tokyo, 2002) p. 229.
0 5 10 15 20 25 30
C content (mass%)
Cr content
(mass%)
without Graphite
with Graphite Fe-25%Ni
Fe-50%Ni Fe-70%Ni
[image:6.595.74.266.71.265.2]0 1 2 3 4 5