Combining Multiple Knowledge Sources for Discourse
Segmentation
D i a n e J . L i t m a n A T & T Bell L a b o r a t o r i e s
600 M o u n t a i n A v e n u e M u r r a y Hill, N J 07974 d i a n e @ r e s e a r c h . a t t . c o m
R e b e c c a J . P a s s o n n e a u * B e l l c o r e
445 S o u t h S t r e e t M o r r i s t o w n , N J 07960
b e c k ~ b e l l c o r e . c o m
A b s t r a c t
We predict discourse segment boundaries from linguistic features of utterances, using a corpus of spoken narratives as data. We present two methods for developing seg- mentation algorithms from training data: hand tuning and machine learning. When multiple types of features are used, results approach human performance on an inde- pendent test set (both methods), and using cross-validation (machine learning). 1 I n t r o d u c t i o n
Many have argued that discourse has a global struc- ture above the level of individual utterances, and that linguistic phenomena like prosody, cue phra- ses, and nominal reference are partly conditioned by and reflect this structure (cf. (Grosz and Hirschberg, 1992; Grosz and Sidner, 1986; Hirschberg and Grosz, 1992; Hirschberg and Litman, 1993; Hirschberg and Pierrehumbert, 1986; Hobbs, 1979; Lascarides and Oberlander, 1992; Linde, 1979; Mann and Thomp- son, 1988; Polanyi, 1988; Reichman, 1985; Webber, 1991)). However, an obstacle to exploiting the rela- tion between global structure and linguistic devices in natural language systems is that there is too little data about how they constrain one another. We have been engaged in a study addressing this gap. In previous work (Passonneau and Litman, 1993), we reported on a method for empirically validating global discourse units, and on our evaluation of algo- rithms to identify these units. We found significant agreement among naive subjects on a discourse seg- mentation task, which suggests that global discourse units have some objective reality. However, we also found poor correlation of three untuned algorithms (based on features of referential noun phrases, cue words, and pauses, respectively) with the subjects' segmentations.
In this paper, we discuss two methods for develo- ping segmentation algorithms using multiple know- *Bellcore did not support the second author's work.
ledge sources. In section 2, we give a brief overview of related work and summarize our previous results. In section 3, we discuss how linguistic features are coded and describe our evaluation. In section 4, we present our analysis of the errors made by the best performing untuned algorithm, and a new algorithm that relies on enriched input features and multiple knowledge sources. In section 5, we discuss our use of machine learning tools to automatically construct decision trees for segmentation from a large set of input features. Both the hand tuned and a u t o m a - tically derived algorithms improve over our previ- ous algorithms. The primary benefit of the hand tuning is to identify new input features for impro- ving performance. Machine learning tools make it convenient to perform numerous experiments, to use large feature sets, and to evaluate results using cross- validation. We discuss the significance of our results and briefly compare the two methods in section 6. 2 D i s c o u r s e S e g m e n t a t i o n
2.1 R e l a t e d W o r k
Segmentation has played a significant role in much work on discourse. The linguistic structure of Grosz and Sidner's (1986) tri-partite discourse model con- sists of multi-utterance segments whose hierarchical relations are isomorphic with intentional structure. In other work (e.g., (Hobbs, 1979; Polanyi, 1988)), segmental structure is an artifact of coherence re- lations among utterances, and few if any specific claims are made regarding segmental structure per se. Rhetorical Structure Theory (RST) (Mann and Thompson, 1988) is another tradition of defining re- lations among utterances, and informs much work in generation. In addition, recent work (Moore and Paris, 1993; Moore and Pollack, 1992) has addressed the integration of intentions and rhetorical relations. Although all of these approaches have involved de- tailed analyses of individual discourses or represen- tative corpora, we believe there is a need for more rigorous empirical studies.
tation, and to propose methodologies for quantify- ing their findings. Several studies have used expert coders to locally and globally structure spoken dis- course according to the model of Grosz and Sid- net (1986), including (Grosz and Hirschberg, 1992; Hirschberg and Grosz, 1992; Nakatani et al., 1995; Stifleman, 1995). Hearst (1994) asked subjects to place boundaries between paragraphs of exposi- tory texts, to indicate topic changes. Moser and Moore (1995) had an expert coder assign segments and various segment features and relations based on RST. To quantify their findings, these studies use notions of agreement (Gale et al., 1992; Mo- set and Moore, 1995) and/or reliability (Passonneau and Litman, 1993; Passonneau and Litman, to ap- pear; Isard and Carletta, 1995).
By asking subjects to segment discourse using a non-linguistic criterion, the correlation of linguistic devices with independently derived segments can then be investigated in a way that avoids circularity. Together, (Grosz and Hirschberg, 1992; Hirschberg and Grosz, 1992; Nakatani et al., 1995) comprise an ongoing study using three corpora: professio- nally read AP news stories, spontaneous narrative, and read and spontaneous versions of task-oriented monologues. Discourse structures are derived from subjects' segmentations, then statistical measures are used to characterize these structures in terms of acoustic-prosodic features. Grosz and Hirschberg's work also used the classification and regression tree system CART (Breiman et al., 1984) to automati- cally construct and evaluate decision trees for classi- fying aspects of discourse structure from intonatio- nal feature values. Morris and Hirst (1991) structu- red a set of magazine texts using the theory of (Grosz and Sidner, 1986), developed a thesaurus-based le- xical cohesion algorithm to segment text, then qua- litatively compared their segmentations with the re- sults. Hearst (1994) presented two implemented seg- mentation algorithms based on term repetition, and compared the boundaries produced to the bounda- ries marked by at least 3 of 7 subjects, using in- formation retrieval metrics. Kozima (1993) had 16 subjects segment a simplified short story, developed an algorithm based on lexical cohesion, and qualita- tively compared the results. Reynar (1994) propo- sed an algorithm based on lexical cohesion in con- junction with a graphical technique, and used infor- mation retrieval metrics to evaluate the algorithm's performance in locating boundaries between conca- tenated news articles.
2 . 2 O u r P r e v i o u s R e s u l t s
We have been investigating a corpus of monologues collected and transcribed by Chafe (1980), known as the Pear stories. As reported in (Passonneau and Litman, 1993), we first investigated whether units of global structure consisting of sequences of utterances could be reliably identified by naive sub-
jects. We analyzed linear segmentations of 20 nar- ratives performed by naive subjects (7 new subjects per narrative), where speaker intention was the seg- ment criterion. Subjects were given transcripts, as- ked to place a new segment boundary between li- nes (prosodic phrases) 1 wherever the speaker had a new communicative goal, and to briefly describe the completed segment. Subjects were free to as- sign any number of boundaries. The qualitative results were that segments varied in size from 1 to 49 phrases in length (Avg.-5.9), and the rate at which subjects assigned boundaries ranged from 5.5% to 41.3%. Despite this variation, we found statistically significant agreement among subjects across all narratives on location of segment boun- daries (.114 z 10 -6 < p < .6 z 10-9).
We then looked at the predictive power of lin- guistic cues for identifying the segment boundaries agreed upon by a significant number of subjects. We used three distinct algorithms based on the distri- bution of referential noun phrases, cue words, and pauses, respectively. Each algorithm (NP-A, CUE- A, PAUSE-A) was designed to replicate the subjects' segmentation task (break up a narrative into conti- guous segments, with segment breaks falling between prosodic phrases). NP-A used three features, while CUE-A and PAUSE-A each made use of a single fea- ture. The features are a subset of those described in section 3.
To evaluate how well an algorithm predicted seg- mental structure, we used the information retrie- val (IR) metrics described in section 3. As repor- ted in (Passonneau and Litman, to appear), we also evaluated a simple additive method for combining algorithms in which a boundary is proposed if each separate algorithm proposes a boundary. We tested all pairwise combinations, and the combination of all three algorithms. No algorithm or combination of algorithms performed as well as humans. NP- A performed better than the other unimodal algo- rithms, and a combination of NP-A and PAUSE-A performed best. We felt that significant improve- ments could be gained by combining the input fea- tures in more complex ways rather than by simply combining the outputs of independent algorithms. 3 M e t h o d o l o g y
3.1 B o u n d a r y C l a s s i f i c a t i o n
We represent each narrative in our corpus as a se- quence of potential boundary sites, which occur bet- ween prosodic phrases. We classify a potential boun- dary site as
boundary
if it was identified as such by at least 3 of the 7 subjects in our earlier study. Otherwise it is classified asnon-boundary.
Agree- ment among subjects on boundaries was significant at below the .02% level for values o f j ___ 3, where j is..Because h e ' s looking at t h e girl.
]1 SUBJECT
(non-boundary)[
[.75] Falls over,[ 5 S U B J E C T S
(boundary) l
[1.35] u h t h e r e ' s no c o n v e r s a t i o n in this movie. [ 0 S U B J E C T S
(non-boundary)[
[.6] T h e r e ' s s o u n d s ,[ 0 S U B J E C T S
(.on-boundary)]
yOU know,I O S U B J E C T S
(non-boundary) l
like t h e birds a n d stuff,
10 S U B J E C T S
(non-boundary)]
b u t there., t h e h u m a n s b e i n g s in it d o n ' t say a n y t h i n g . 1 7 S U B J E C T S
(boundary)[
ll.01 He falls over,
Figure h Excerpt from narr. 6, with boundaries.
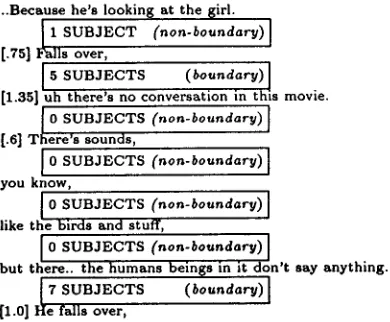
the n u m b e r of subjects (1 to 7), on all 20 narratives. 2 Fig. 1 shows a typical segmentation of one of the narratives in our corpus. Each line corresponds to a prosodic phrase, and each space between the li- nes corresponds to a potential b o u n d a r y site. T h e bracketed numbers will be explained below. T h e bo- xes in the figure show the subjects' responses at each potential b o u n d a r y site, and the resulting b o u n d a r y classification. Only 2 of the 7 possible b o u n d a r y si- tes are classified as boundary.
3.2 C o d i n g o f L i n g u i s t i c F e a t u r e s
Given a narrative of n prosodic phrases, the n-1 po- tential b o u n d a r y sites are between each pair of pros- odic phrases Pi and P/+I, i from 1 to n-1. Each potential b o u n d a r y site in our corpus is coded using the set of linguistic features shown in Fig. 2.
Values for the prosodic features are obtained by a u t o m a t i c analysis of the transcripts, whose con- ventions are defined in (Chafe, 1980) and illustra- ted in Fig. h .... and "?" indicate sentence- final intonational contours; "," indicates phrase-final but not sentence final intonation; "[X]" indicates a pause lasting X seconds; ".." indicates a break in timing too short to be measured. T h e featu-
res before and after depend on the final punctua-
tion of the phrases Pi and Pi+I, respectively. T h e value is '+sentence.final.contour' if "." or "?", '- sentence.final.contour' if ",". Pause is assigned 'true' if Pi+l begins with [X], 'false' otherwise. Duration
is assigned X if pause is 'true', 0 otherwise.
T h e cue phrase features are also obtained by au- t o m a t i c analysis of the transcripts. Cue1 is assigned ' t r u e ' if the first lexical item in PI+I is a m e m b e r of the set of cue words summarized in (Hirschberg and Litman, 1993). Word1 is assigned this lexical item if
2 W e p r e v i o u s l y u s e d a g r e e m e n t b y 4 s u b j e c t s a s t h e
threshold for boundaries; for j > 4, agreement was signi- ficant at the .01~0 level. (Passonneau and Litman, 1993)
• P r o s o d i c F e a t u r e s
- b e f o r e : + s e n t e n c e . f i n a l . c o n t o u r , - s e n t e n c e . f l n a l . c o n t o u r - after: + s e n t e n c e . f i n a l . c o n t o u r , - s e n t e n c e . f l n a l . c o n t o u r . - pause: true, false.
- d u r a t i o n : c o n t i n u o u s . • C u e P h r a s e F e a t u r e s
- cue1: true, false.
- word1: also, a n d , anyway, basically, b e c a u s e , b u t , fi- nally, first, like, m e a n w h i l e , no, now, oh, okay, only, or, see, so, t h e n , well, w h e r e , N A .
-- cue2: t r u e , false.
- word2: a n d , anyway, b e c a u s e , boy, b u t , now, okay, or,
right, so, still, t h e n , N A .
• N o u n P h r a s e F e a t u r e s
- coref: + c o r e f , - c o r e r , N A . - infer: + i n f e r , -infer, N A .
- global.pro: + g l o b a l . p r o , -global.pro, N A .
• C o m b i n e d F e a t u r e
-- c u e - p r o s o d y : c o m p l e x , t r u e , false.
Figure 2: Features and their potential values.
cuel is true, 'NA' (not applicable) otherwise, a Cue2
is assigned 'true' if cue, is true and the second lexi- cal item is also a cue word. Word2 is assigned the second lexical item if cue2 is true, 'NA' otherwise.
Two of the noun phrase (NP) features are hand- coded, along with functionally independent clauses (FICs), following (Passonneau, 1994). T h e two aut- hors coded independently and merged their results. T h e third feature, global.pro, is c o m p u t e d from the hand coding. FICs are tensed clauses t h a t are neit- her verb arguments nor restrictive relatives. If a new FIC (C/) begins in prosodic phrase Pi+I, then NPs in Cj are compared with NPs in previous clauses and the feature values assigned as follows4:
1. corer = ' + c o r e f ' if Cj contains an NP t h a t co- refers with an NP in C j - 1 ; else corer= ' - c o r d '
2. infer= ' + i n f e r ' i f C j contains an NP whose refe- rent can be inferred from an NP in C j - 1 on the basis of a pre-defined set of inference relations; else i n f e r - '-infer'
3. global.pro = ' + g l o b a l . p r o ' if Cj contains a defi- nite pronoun whose referent is mentioned in a previous clause up to the last b o u n d a r y assigned by the algorithm; else global.pro = '-global.pro' If a new FIC is not initiated in Pi+I, values for all three features are 'NA'.
Cue-prosody, which encodes a combination of
prosodic and cue word features, was m o t i v a t e d by an analysis of IR errors on our training data, as de- scribed in section 4. Cue-prosody is 'complex' if:
aThe cue phrases that occur in the corpus &re shown as potential values in Fig. 2.
[image:3.612.328.550.61.238.2] [image:3.612.75.270.63.224.2]..Because hei's looking a t t h e girl. [.75] ( Z I B R O - P R O N O U N i ) Falls over,
b e f o r e a f t e r p a u s e d u r a t i o n c u e 1 word 1 cue~ word;~ c o r e f infer E;lobal.pro c u e - p r o s o d i c +s.f.c -s.f.c true .75 false N A fM~e N A + + true
Figure 3: Example feature coding of a potential boundary site.
1. before = '+sentence.final.contour'
2. pause = 'true' 3. And either:
(a) cuet = 'true', wordt ~ 'and'
(b) cuet = 'true', word1 = 'and', cue2 = 'true',
word2 ¢
'and'Else, cue-prosody has the same values as pause.
Fig. 3 illustrates how the first boundary site in Fig. 1 would be coded using the features in Fig. 2.
The prosodic and cue phrase features were moti- vated by previous results in the literature. For ex- ample, phrases beginning discourse segments were correlated with preceding pause duration in (Grosz and Hirschberg, 1992; ttirschberg and Grosz, 1992). These and other studies (e.g.~ (iiirschberg and Lit- man, 1993)) also found it useful to distinguish bet- ween sentence and non-sentence final intonational contours. Initial phrase position was correlated with discourse signaling uses of cue words in (Hirschberg and Litman, 1993); a potential correlation between discourse signaling uses of cue words and adjacency patterns between cue words was also suggested. Fi- nally, (Litman, 1994) found that treating cue phra- ses individually rather than as a class enhanced the results of (iiirschberg and Litman, 1993).
Passonneau (to appear) examined some of the few claims relating discourse anaphoric noun phrases to global discourse structure in the Pear corpus. Re- suits included an absence of correlation of segmental structure with centering (Grosz et al., 1983; Kamey- ama, 1986), and poor correlation with the contrast between full noun phrases and pronouns. As noted in (Passonneau and Litman, 1993), the NP features largely reflect Passonneau's hypotheses that adja- cent utterances are more likely to contain expres- sions t h a t corefer, or that are inferentially linked, if they occur within the same segment; and that a definite pronoun is more likely than a full NP to re- fer to an entity that was mentioned in the current segment, if not in the previous utterance.
3.3 E v a l u a t i o n
The segmentation algorithms presented in the next two sections were developed by examining only a
training set of narratives. The algorithms are then evaluated by examining their performance in pre- dicting segmentation on a separate test set. We cur- rently use 10 narratives for training and 5 narratives for testing. (The remaining 5 narratives are reser- ved for future research.) The 10 training narratives
Traininl~ S e t .63 .72 .06 .12 T e s t Set .64 .68 .07 .11
Table 1: Average h u m a n performance.
range in length from 51 to 162 phrases (Avg.=101.4), or from 38 to 121 clauses (Avg.=76.8). The 5 test narratives range in length from 47 to 113 phrases
(Avg.=S7.4), or from 37 to 101 clauses (Avg.=69.0). The ratios of test to training d a t a measured in narra- tives, prosodic phrases and clauses, respectively, are 50.0%, 43.1% and 44.9%. For the machine learning algorithm we also estimate performance using cross- validation (Weiss and Kulikowski, 1991), as detailed in Section 5.
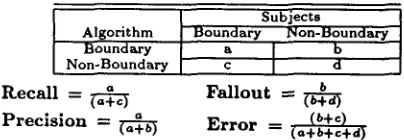
To quantify algorithm performance, we use the in- formation retrieval metrics shown in Fig. 4. Recall is the ratio of correctly hypothesized boundaries to target boundaries. Precision is the ratio of hypo- thesized boundaries t h a t are correct to the total hy- pothesized boundaries. (Cf. Fig. 4 for fallout and error.) Ideal behavior would be to identify all and only the target boundaries: the values for b and c in Fig. 4 would thus both equal O, representing no errors. The ideal values for recall, precision, fallout, and error are 1, 1, 0, and 0, while the worst values are 0, 0, 1, and 1. To get an intuitive s u m m a r y of overall performance, we also sum the deviation o f
the observed value from the ideal value for each me- tric: (1-recall) + (1-precision) + fallout + error. The summed deviation for perfect performance is thus 0. Finally, to interpret our quantitative results, we use the performance of our h u m a n subjects as a tar- get goal for the performance of our algorithms (Gale et al., 1992). Table 1 shows the average human per- formance for both the training and test sets of nar- ratives. Note t h a t h u m a n performance is basically the same for both sets of narratives. However, two
Subjects Algorithm Boundary INon-Doundary
Boundary a b
Non-Boundary c d
R e c a l l = P r e c i s i o n =
F a l l o u t ---- b
E r r o r ---- ~
[image:4.612.306.508.584.654.2]factors prevent this performance from being closer to ideal (e.g., recall and precision of 1). The first is the wide variation in the number of boundaries that subjects used, as discussed above. The second is the inherently fuzzy nature of boundary location. We discuss this second issue at length in (Passonnean and Litman, to appear), and present relaxed IR me- trics that penalize near misses less heavily in (Lit- man and Passonneau, 1995).
4 H a n d T u n i n g
To improve performance, we analyzed the two types of IR errors made by the original NP algorithm (Pas- sonneau and Litman, 1993) on the training data. Type "b" errors (cf. Fig. 4), mis-classification of non-boundaries, were reduced by changing the co- ding features pertaining to clauses and NPs. Most "b" errors correlated with two conditions used in the NP algorithm, identification of clauses and of infe- rential links. The revision led to fewer clauses (more assignments of 'NA' for the three NP features) and more inference relations. One example of a change to clause coding is that formulaic utterances having the structure of clauses, but which function like in- terjections, are no longer recognized as independent clauses. These include the phrases let's see, let me see, I don't know, you know when they occur with no verb phrase argument. Other changes pertained to sentence fragments, unexpected clausal arguments, and embedded speech.
Three types of inference relations linking succes- sive clauses (Ci-1, Ci) were added (originally there were 5 types (Passonneau, 1994)). Now, a pronoun (e.g., it, that, this) in Ci referring to an action, event or fact inferrable from Ci-1 links the two clauses. So does an implicit argument, as in Fig. 5, where the missing argument of notice is inferred to be the event of the pears falling. The third case is where an NP in Ci is described as part of an event that results directly from an event mentioned in Ci-1.
"C" type errors (cf. Fig. 4), mis-classification of boundaries, often occurred where prosodic and cue features conflicted with NP features. The origi- nal NP algorithm assigned boundaries wherever the three values '-coref', '-infer', '-global.pro' (defined in section 3) co-occurred, represented as the first con- ditional statement of Fig. 6. Experiments led to the hypothesis that the most improvement came by as- signing a boundary if the cue-prosody feature had the value 'complex', even if the algorithm would not otherwise assign a boundary, as shown in Fig. 6.
CI. P h r . 6 3.01
[image:5.612.330.548.576.691.2]7 8 3 . 0 2
[1.1 [.7] A - n d ] h e ' s n o t really., d o e s n ' t s e e m t o b e p a y i n g all t h a t m u c h a t t e n t i o n [.557 b e c a u s e [.45]] y o u k n o w the pears f a l l i ,
a n d . . h e d o e s n ' t r e a l l y n o t i c e ( O i ) ,
Figure 5: Inferential link due to implicit argument.
i f ( c o r e f = - c o r e f a n d i n f e r = - i n f e r a n d g l o b a l . p r o = - g l o b a l . p r o )
t h e n boundary
e l s e | f c u e - p r o s o d y ---- c o m p l e x t h e n boundary
e l s e non-boundary
Figure 6: Condition 2 algorithm.
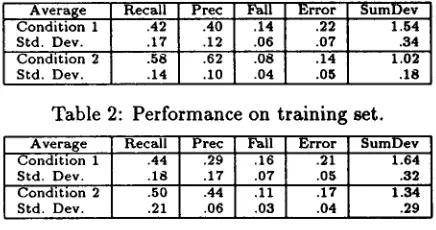
We refer to the original NP algorithm applied to the initial coding as Condition 1, and the tuned al- gorithm applied to the enriched coding as Condition 2. Table 2 presents the average IR scores across the narratives in the training set for both conditi- ons. Reduction of "b" type errors raises precision, and lowers fallout and error rate. Reduction of "c" type errors raises recall, and lowers fallout and error rate. All scores improve in Condition 2, with pre- cision and fallout showing the greatest relative im- provement. The major difference from human per- formance is relatively poorer precision.
The standard deviations in Table 2 are often close to 1/4 or 1/3 of the reported averages. This indicates a large amount of variability in the data, reflecting wide differences across narratives (speakers) in the training set with respect to the distinctions recogni- zed by the algorithm. Although the high standard deviations show that the tuned algorithm is not well fitted to each narrative, it is likely that it is overspe- cialized to the training sample in the sense that test narratives are likely to exhibit further variation.
Table 3 shows the results of the hand tuned al- gorithm on the 5 randomly selected test narratives on both Conditions 1 and 2. Condition 1 results, the untuned algorithm with the initial feature set, are very similar to the training set except for worse precision. Thus, despite the high standard devia- tions, 10 narratives seems to have been a sufficient sample size for evaluating the initial NP algorithm. Condition 2 results are better than condition 1 in Table 3, and condition 1 in Table 2. This is strong evidence that the tuned algorithm is a better pre- dictor of segment boundaries than the original NP algorithm. Nevertheless, the test results of condition 2 are much worse than the corresponding training re- sults, particularly for precision (.44 versus .62). This
A v e r a l s e R e c a l l P r e c Fall E r r o r S u m D e v C o n d i t i o n 1 .42 .40 .14 .22 1.54 S t d . D e v . .17 .12 .06 .07 .34 C o n d i t i o n 2 .58 .62 .08 .14 1.02 S t d . D e v . .14 .10 .04 .05 .18
Table 2: Performance on training set.
A v e r a g e R e c a l l P r e c Fall E r r o r S u m D e v C o n d i t i o n 1 .44 .29 .16 .21 1.64 S t d . D e v . .18 .17 .07 .05 .32 C o n d i t i o n 2 .50 .44 .11 .17 1 . 3 4 S t d . D e v . .21 .06 .03 .04 .29
confirms that the tuned algorithm is over calibrated to the training set.
5 M a c h i n e L e a r n i n g
We use the machine learning program C4.5 (Quin- lan, 1993) to automatically develop segmentation al- gorithms from our corpus of coded narratives, where each potential boundary site has been classified and represented as a set of linguistic features. The first input to C4.5 specifies the names of the classes to be learned
(boundary
andnon-boundary),
and the names and potential values of a fixed set of coding features (Fig. 2). The second input is the training data, i.e., a set of examples for which the class and feature values (as in Fig. 3) are specified. Our trai- ning set of 10 narratives provides 1004 examples of potential boundary sites. The output of C4.5 is a classification algorithm expressed as a decision tree, which predicts the class of a potential boundary gi- ven its set of feature values.Because machine learning makes it convenient to induce decision trees under a wide variety of con- ditions, we have performed numerous experiments, varying the number of features used to code the trai- ning data, the definitions used for classifying a po- tential boundary site as
boundary
ornon-boundary 5
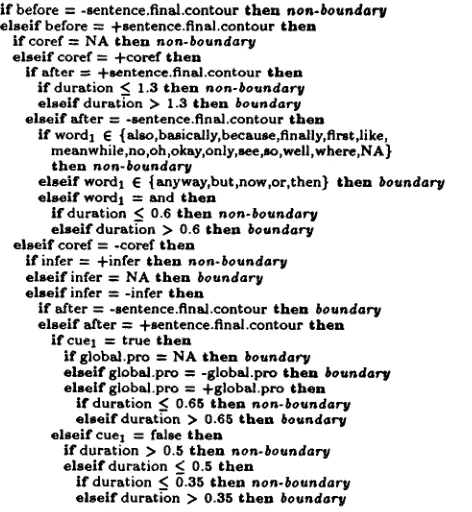
and the options available for running the C4.5 pro- gram. Fig. 7 shows one of the highest-performing learned decision trees from our experiments. This decision tree was learned under the following condi- tions: all of the features shown in Fig. 2 were used to code the training data, boundaries were classified as discussed in section 3, and C4.5 was run using only the default options. The decision tree predicts the class of a potential boundary site based on the featu- res
before, after, duration, cuel, wordl, corer, infer,
and
global.pro.
Note that although not all available features are used in the tree, the included features represent 3 of the 4 general types of knowledge (pros- ody, cue phrases and noun phrases). Each level of the tree specifies a test on a single feature, with a branch for every possible outcome of the test. 6 A branch can either lead to the assignment of a class, or to another test. For example, the tree initially branches based on the value of the featurebefore.
If the value is '-sentence.final.contour' then the first branch is taken and the potential boundary site is as- signed the class
non-boundary.
If the value ofbefore
is 'q-sentence.final.contour' then the second branch is taken and the feature
corer is
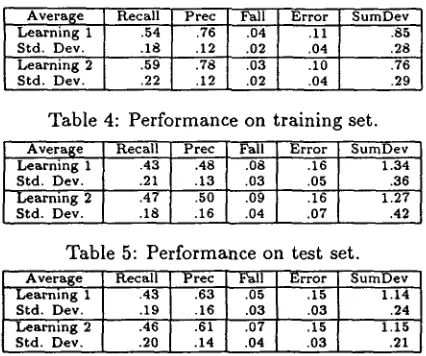
tested.The performance of this learned decision tree ave- raged over the 10 training narratives is shown in Table 4, on the line labeled "Learning 1". The line labeled "Learning 2" shows the results from another
5(Litman and Passonneau, 1995) varies the number of subjects used to determine boundaries.
eThe actual tree branches on every value of
worda;
the figure merges these branches for clarity.i f b e f o r e = - s e n t e n c e . f i n a l . c o n t o u r t h e n non.boundary
e l a e i f b e f o r e = + s e n t e n c e . f i n a l . c o n t o u r t h e n
i f c o r e f = N A t h e n non-boundary
e l s e i f c o r e f = + c o r e r t h e n
i f a f t e r ----. + s e n t e n c e . f i n a l . c o n t o u r t h e n
i f d u r a t i o n <__ 1.3 t h e n non-boundary
e l s e l f d u r a t i o n > 1.3 t h e n boundary
e l s e i f a f t e r = - s e n t e n c e . f i n a l . c o n t o u r t h e n
i f w o r d 1 E {also,basically, b e c a u s e , f i n a l l y , first,like, m e a n w h i l e , n o , o h , o k a y , only, a e e , s o , w e l l , w h e r e , N A }
t h e n non-boundary
e l s e | f w o r d 1 E { a n y w a y , b u t , n o w , o r , t h e n } t h e n boundary
e l s e | f w o r d I = a n d t h e n
i f d u r a t i o n < 0.6 t h e n non-boundary
e l s e i f d u r a t ~ o n > 0.6 t h e n boundary
e l s e i f c o r e f = - c o r e r t h e n
i f infer = + i n f e r t h e n non-boundary
e l s e l f infer = N A t h e n boundary
e l s e i f i n f e r = - i n f e r t h e n
i f a f t e r = - s e n t e n c e . f i n a l . c o n t o u r t h e n boundary
e l s e l f a f t e r = + s e n t e n c e . f i n a l . c o n t o u r t h e n
i f c u e 1 = t r u e t h e n
i f g l o b a l . p r o = N A t h e n boundary
e l s e i f g l o b a l . p r o = - g l o b a l . p r o t h e n boundary
e l s e l f g l o b a l . p r o = + g l o b a l . p r o t h e n
i f d u r a t i o n < 0.65 t h e n non-boundary
e l s e i f d u r a t ~ ' o n > 0.65 t h e n boundary
e l s e i f c u e I = false t h e n
i f d u r a t i o n > 0.5 t h e n non.boundary
e l s e l f d u r a t i o n <: 0.5 t h e n
i f d u r a t i o n < 0.35 t h e n non-boundary
e i s e i f d u r a t ~ o n > 0.35 t h e n boundary
Figure 7: Learned decision tree for segmentation.
machine learning experiment, in which one of the default C4.5 options used in "Learning 1" is over- ridden. The "Learning 2" tree (not shown due to space restrictions) is more complex than the tree of Fig. 7, but has slightly better performance. Note that "Learning 1" performance is comparable to hu- man performance (Table 1), while "Learning 2" is slightly better than humans. The results obtained via machine learning are also somewhat better than the results obtained using hand tuning--particularly with respect to precision ("Condition 2" in Table 2), and are a great improvement over the original NP results ("Condition 1" in Table 2).
The performance of the learned decision trees ave- raged over the 5 test narratives is shown in Table 5. Comparison of Tables 4 and 5 shows that, as with the hand tuning results (and as expected), average per- formance is worse when applied to the testing rather than the training d a t a particularly with respect to precision. However, performance is an improvement over our previous best results ("Condition 1" in Ta- ble 3), and is comparable to ("Learning 1") or very slightly better than ("Learning 2") the hand tuning results ("Condition 2" in Table 3).
[image:6.612.310.546.64.320.2]A v e r a g e R e c a l l P r e c Fall E r r o r S u m D e v L e a r n i n g 1 .54 .76 .04 .11 .85 S t d . D e v . .18 .12 .02 .04 .28 L e a r n i n g 2 .59 .78 .03 .10 .76" S t d . D e v . .22 .12 .02 .04 .29
Table 4: Performance on training set.
A v e r a g e R e c a l l P r e c Fall E r r o r S u m D e v L e a r n i n g 1 .43 .48 .08 .16 1.34 S t d . D e v . .21 .13 .03 .05 .36 L e a r n i n g 2 .47 .50 .09 .16 1.27 S t d . D e v . .18 .16 .04 .07 .42
Table 5: Performance on test set.
A v e r a g e R e c a l l P r e c Fall E r r o r S u m D e v L e a r n i n g 1 .43 .63 .05 .15 1 . 1 4 ' S t d . D e v , .19 .16 .03 .03 .24 L e a r n i n g 2 .46 .61 .07 .15 1.15 S t d . D e v . .20 .14 .04 .03 .21
Table 6: Using 10-fold cross-validation.
training set (for learning the tree) and the remaining narrative for testing. Note that for
each
iteration of the cross-validation, the learning process begins from scratch and thus each training and testing set are still disjoint. While this method does not make sense for humans, computers can truly ignore pre- vious iterations. For sample sizes in the hundreds (our 10 narratives provide 1004 examples) 1O-fold cross-validation often provides a better performance estimate than the hold-out method (Weiss and Ku- likowski, 1991). Results using cross-validation are shown in Table 6, and are better than the estimates obtained using the hold-out method (Table 5), with the major improvement coming from precision. Bec- ause a different tree is learned on each iteration, the cross-validation evaluates the learning method, not a particular decision tree.6 C o n c l u s i o n
We have presented two methods for developing seg- mentation hypotheses using multiple linguistic fea- tures. The first method hand tunes features and algorithms based on analysis of training errors. The second method, machine learning,
automatically
in- duces decision trees from coded corpora. Both me- thods rely on an enriched set of input features com- pared to our previous work. With each method, we have achieved marked improvements in performance compared to our previous work and are approaching human performance. Note that quantitatively, the machine learning results are slightly better than the hand tuning results. The main difference on average performance is the higher precision of the automated algorithm. Furthermore, note that the machine lear- ning algorithm used the changes to the coding fea- tures that resulted from the tuning methods. This suggests that hand tuning is a useful method for understanding how to best code the data, while ms-chine learning provides an effective (and automatic) way to produce an algorithm given a good feature representation.
Our results lend further support to the hypothesis that linguistic devices correlate with discourse struc- ture (cf. section 2.1), which itself has practical im- port. Understanding systems could infer segments as a step towards producing summaries, while ge- neration systems could signal segments to increase comprehensibility/Our results also suggest that to best identify or convey segment boundaries, systems will need to exploit
multiple
signals simultaneously. We plan to continue our experiments by further merging the automated and analytic techniques, and evaluating new algorithms on our final test corpus. Because we have already used cross-validation, we do not anticipate significant degradation on new test narratives. An important area for future research is to develop principled methods for identifying di- stinct speaker strategies pertaining to how they si- gnal segments. Performance of individual speakers varies widely as shown by the high standard deviati- ons in our tables. The original NP, hand tuned, and machine learning algorithms all do relatively poorly on narrative 16 and relatively well on 11 (both in the test set) under all conditions. This lends sup- port to the hypothesis that there may be consistent differences among speakers regarding strategies for signaling shifts in global discourse structure.R e f e r e n c e s
Leo Breiman, Jerome Friedman, Richard Oishen, and C. Stone. 1984.
Classification and Regression
Trees. Wadsworth and Brooks, Monterey, CA. Wallace L. Chafe. 1980.
The Pear Stories.
AblexPublishing Corporation, Norwood, NJ.
William Gale, Ken W. Church, and David Yarow- sky. 1992. Estimating upper and lower bounds on the performance of word-sense disambiguation programs. In
Proc. of the 30th ACL,
pages 249- 256.Barbara Grosz and Julia Hirschberg. 1992. Some intonational characteristics of discourse structure. In
Proc. of the International Conference on Spo-
ken Language Processing.
Barbara Grosz and Candace Sidner. 1986. Atten- tion, intentions and the structure of discourse.
Computational Linguistics,
12:175-204.Barbara J. Grosz, Aaravind K. Joshi, and Scott Weinstein. 1983. Providing a unified account of definite noun phrases in discourse. In
Proc. of the
21st ACL,
pages 44-50.rCf. (Hirschberg a~d Pierrehumbert, 1986) who argue
[image:7.612.81.294.60.238.2]Marti A. Hearst. 1994. Multi-paragraph segmenta- tion of expository text. In Proc, of the 32nd A CL.
Julia Hirschberg and Barbara Grosz. 1992. Intona- tional features of local and global discourse struc- ture. In Proc. of the Darpa Workshop on Spoken Language.
Julia Hirschberg and Diane Litman. 1993. Empiri- cal studies on the disambiguation of cue phrases.
Computational Linguistics, 19(3):501-530.
Julia Hirschberg and Janet Pierrehumbert. 1986. The intonational structuring of discourse. In Proc.
of the 24th A CL.
Jerry R. Hobbs. 1979. Coherence and coreference.
Cognitive Science, 3(1):67-90.
Amy Isard and Jean Carletta. 1995. Replicabi- lity of transaction and action coding in the map task corpus. In AAA1 1995 Spring Symposium Series: Empirical Methods in Discourse Interpre-
tation and Generation, pages 60-66.
Megumi Kameyama. 1986. A property-sharing constraint in centering. In Proc. of the 24th ACL,
pages 200-206.
H. Kozima. 1993. Text segmentation based on si- milarity between words. In Proc. of the 31st ACL
(Student Session), pages 286-288.
Alex Lascarides and Jon Oberlander. 1992. Tempo- ral coherence and defeasible knowledge. Theoreti- cal Linguistics.
Charlotte Linde. 1979. Focus of attention and the choice of pronouns in discourse. In Talmy Givon, editor, Syntax and Semantics: Discourse and Syn-
tax, pages 337-354. Academic Press, New York. Diane J. Litman and Rebecca J. Passonneau. 1995.
Developing algorithms for discourse segmentation.
In A A A I 1995 Spring Symposium Series: Empiri.
cal Methods in Discourse Interpretation and Ge-
neration, pages 85-91.
Diane J. Litman. 1994. Classifying cue phrases in text and speech using machine learning. In Proc.
of the 12th AAA1, pages 806-813.
William C. Mann and Sandra Thompson. 1988. Rhetorical structure theory. TEXT, pages 243- 281.
Johanna D. Moore and Cecile Paris. 1993. Planning text for advisory dialogues: Capturing intentional and rhetorical information. Computational Lin- guistics, 19:652-694.
Johanna D. Moore and Martha E. Pollack. 1992. A problem for RST: The need for multi-level discourse analysis. Computational Linguistics,
18:537-544.
Jane Morris and Graeme ttirst. 1991. Lexical co- hesion computed by thesaural relations as an in- dicator of the structure of text. Computational
Linguistics, 17:21-48.
Megan Moser and Julia D. Moore. 1995. Using dis- course analysis and automatic text generation to study discourse cue usage. In A A A I 1995 Spring Symposium Series: Empirical Methods in Dis-
course Interpretation and Generation, pages 92-
98.
Christine H. Nakatani, Julia Hirsehberg, and Bar- bara J. Grosz. 1995. Discourse structure in spo- ken language: Studies on speech corpora. In
A A A I 1995 Spring Symposium Series: Empirical Methods in Discourse Interpretation and Genera- tion, pages 106-112.
Rebecca J. Passonneau and Diane J. Litman. 1993. Intention-based segmentation: Human reliability
and correlation with linguistic cues. In Proc. o f
the 31st ACL, pages 148-155.
Rebecca J. Passonneau and D. Litman. to appear. Empirical analysis of three dimensions of spoken
discourse. In E. Hovy and D. Scott, editors, In-
terdisciplinary Perspectives on Discourse. Sprin-
ger Verlag, Berlin.
Rebecca J. Passonneau. 1994. Protocol for coding discourse referential noun phrases and their ante- cedents. Technical report, Columbia University. Rebecca J. Passonneau. to appear. Interaction of
the segmental structure of discourse with explicit- ness of discourse anaphora. In E. Prince, A. Joshi, and M. Walker, editors, Proc. of the Workshop
on Centering Theory in Naturally Occurring Dis-
course. Oxford University Press.
Livya Polanyi. 1988. A formal model of discourse structure. Journal of Pragmaties, pages 601-638.
John K. Quinlan. 1993. C4.5 : Programs for Ma-
chine Learning. Morgan Kaufmann Publishers,
San Mates, Calif.
Rachel Reichman. 1985. Getting Computers to Talk
Like You and Me: Discourse Contezt, Focus, and
Semantics. Bradford. MIT, Cambridge.
J. C. Reynar. 1994. An automatic method of fin- ding topic boundaries. In Proc. of the 3$nd ACL
(Student Session), pages 331-333.
Lisa J. Stifleman. 1995. A discourse analysis approach to structured speech. In A A A I 1995 Spring Symposium Series: Empirical Methods in
Discourse Interpretation and Generation, pages
162-167.
Bonnie L. Webber. 1991. Structure and ostension in the interpretation of discourse deixis. Language
and Cognitive Processes, pages 107-135.
Sholom M. Weiss and Casimir Kulikowski. 1991.
Computer systems that learn: classification and
prediction methods from statistics, neural nets,
machine learning, and expert s~/stems. Morgan