Munich Personal RePEc Archive
Technical Efficiency Analysis of Wheat
Farms in the Punjab, Pakistan: DEA
Approach
Muhammad Aamir, Shahzad and Waqar, Akram and
Muhammad, Khan
Minhaj University Lahore, Sukkur Institute of Business
Administration, Sukkur, COMSATS Institute of Information
Technology, Lahore
1 October 2016
TECHNICAL EFFICIENCY ANALYSIS OF WHEAT FARMS
IN THE PUNJAB, PAKISTAN: DEA APPROACH
Muhammad Aamir Shahzad,1 Dr. Waqar Akram,2 Muhammad Khan3 and Muhammad Iftikhar ul Husnain4 1Minhaj University, Lahore.
2Sukkur Institute of Business Administration, Sukkur.
3COMSATS Institute of Information Technology, Lahore. 4COMSATS Institute of Information Technology, Islamabad.
*Corresponding author:Dr. Waqar Akram
ABSTRACT
The wheat productivity in the Punjab is less than the potential maximum due to technical farm and management issues. The farm level panel survey data was used for the said purpose comprising 17 districts of the province of the Punjab from the period 2005-06 to 2007-08. The technical efficiency of wheat farms was analyzed using Data Envelopment Analysis (DEA) approach. Subsequently, the same was calculated by analyzing the socioeconomic factors responsible for (in) efficiency using Tobit Regression Model. The DEA didn’t accommodate statistical noise such as random shocks which were beyond the control of farmers. However, the technical efficiency of wheat farms was estimated using the DEA approach. The mean technical efficiency estimated through variable return to scale (VRS) was 60.13 percent and constant return to scale (CRS) was 56.61 percent. The results of analyses were supported by the literature. The technical efficiency could be improved by educating the young farmers, building road infrastructure and providing access to essential inputs to farmers. The study undertaken supports the argument that technically wheat farmers are less efficient in the Punjab, Pakistan.
Keywords: Data Envelopment Analysis, Variable Return to Scale, Constant Return to Scale.
INTRODUCTION
We can’t deny the importance of wheat in Pakistan’s food system. Wheat is a staple food of Pakistani inhabitants and its contribution to total calories intake during the day is 60 percent. While considering the food need, the wheat is grown on an area of 8578.1 million acres in Pakistan. But per acre productivity of wheat is less as compared to regional and global level of production per acre. It is quite evident from the food crises of 2007-08 that Pakistan faced severe shortage of wheat; specifically, the production shortfall only in the Punjab province was 2.7 million tons. Hence, in such sensitive scenario, there is a need to do timely analysis of wheat productivity (the food price crisis of 2007/2008: Eugenio S. Bobenrieth H. and Brian D. Wright)
In this context, a number of studies have been done in Pakistan and reported that although Pakistani farmers on an average are using more inputs for wheat production; but, the productivity of inputs is on lower side with respect to the developed countries. Byerlee (1992) and Ahmad, Chaudhry, Iqbal, and Khan (2002). In addition to
this, there are other factors which can be named for low productivity such as primitive methods of production, high input prices, low quality seed and less orientation to modern production technologies. Sher and Ahmad (2008). Farmers also lack in managerial skills and ability to make timely decisions about the application of essential inputs like seed and irrigation water application. Ahmad et al. (2002), Bakhsh (2007). The farmers of the Punjab are also constrained by land and water which is one of the major causes of low production and productivity. Hassan and Ahmad (2005).
(2011) used DEA technique and analyzed efficiency of farmers in cotton-wheat and rice-wheat cropping system of the Punjab using farm level survey data.
The study by Islam, Bäckman, and Sumelius (2011) used DEA for rice farming in Bangladesh and found the farm specific and institutional variables representing the (in)efficiency effect by revealing land fragmentation, family size, household wealth, on farm training, and off farm income share are the main determinants of (in)efficiency. The distance of village from markets and farm size negatively impacted the efficiency; however with approved seed and proper irrigation of fields using multiple inlets produced higher efficiency scores relative to others Sohail, Latif, Abbas, and Shahid (2012) and Watkins, Hristovska, Mazzanti, Wilson Jr, and Watkins (2013). However, the DEA technique includes control variables in the analyses, fitted tightly to the data set, neither require any parametric form and attribute nor any deviation from the data due to technical (in) efficiency. All these studies are one point studies which do not take into account the time factor.
That’s why, we use the panel data and try to incorporate time variable in order to know that how much technology has changed on wheat farms over the years. The innovation that takes place during 2005-06 to 2007-08 in terms of availability of innovative production practices
Data Envelopment Analysis: Let there be ‘K’
number of inputs and ‘M’ outputs and ‘N’ farms
and xi be input vector and yi be the output vector
for ith farm, X is input matrix for N farms and Y
represent output matrix for N farms. The constant return to scale input-oriented DEA model for ith
farm can be written as:
Min ѳ, λ ϴ
Subject to: -yi + Yλ ≥ 0
ϴxi –Xλ ≥ 0
λ ≥ 0
Where θ represent the technical efficiency for ith
farm, λ represents Nx1 constants. The θ must satisfy the condition of θ≤1. If θ=1, it shows that
the farm is technically efficient. The variable return to scale DEA is obtained by adding up a convexity constraint that is written as:
Min ѳ, λ ϴ
Subject to: -yi + Yλ ≥ 0
ϴxi –Xλ ≥ 0
N1′λ=1 λ ≥ 0
Where N1′ λ=1represent convexity constraint. The scale efficiency is calculated by the following formula
SE=TECRS/TEVRS
If SE = 1, it indicates scale efficiency and constant return to scale (CRS). If SE<1, it shows that the scale inefficiency exists. Scale inefficiencies originate because of increasing returns to scale or decreasing returns to scale. The computer software DEAP 2.0 is used for estimation of the results and the factors affecting technical (in) efficiency are analyzed using Tobit Regression Model because the dependent variable is continuous and bound between 0 and 1.
Data: The data used in this study was obtained from Punjab Economic Research Institute (PERI). In order to give appropriate coverage to all type of heterogeneous farms, PERI divided the Punjab province into three regions based on the irrigation source: barrani (rain-fed); partial barrani; and irrigated.
The irrigated region was sub-divided based on ecological zones such as: i) Cotton-wheat zone ii) Rice-wheat zone iii) Mixed-wheat zone. The respondents were selected based on the farm size in the sample village. Farm size categories include: 1) Small – A =Under 5.0 acres 2) Small – B=5.0 acres to< 12.50 acres 3) Medium=12.50 acres to < 25 acres 4) Large=25.0 acres and above.
A total of 17 districts were selected to give due coverage to all regions. These districts are: Attock, Rawalpindi and Chakwal represented the barrani areas; Bhakar and Khushab represented the partial barrani areas; and Jhang, Faisalabad, Sarghodha, Okara, Hafizabad, Sheikhupura, Sialkot, D.G. Khan, R.Y.Khan, Vehari, Multan and Khanewal represented the irrigated areas. Two villages were selected from each district; thus, 34 villages from the total 17 districts were taken. The data was collected by the Punjab Economic Research Institute (PERI,) Lahore.
wheat production. The study used wheat yield per acre as dependent variable. As different farms used different levels of inputs, therefore, the wheat yield varied across farms with a minimum from 7.5 mounds per acre to maximum 53 mounds per acre. The minimum and maximum values of the total area used for wheat cultivation: farm yard manure per acre, seed rate applied per acre, cost of pesticides and weedicides/acre, numbers of irrigations/acre, labour used for wheat production for one acre, cost of land
[image:4.612.74.541.177.702.2]preparation/acre and the nutrients of NPK applied per acre are shown in table 1. The input variables were used in quantities on per acre bases except the area cultivated for wheat. Therefore, the parameter estimates of area cultivated for wheat would show returns to scale of farming Ahmad and Ahmad (1998.) The efficiency variables included were the age and education of farmers, total area of the farm, and the transportation cost. The minimum and maximum values of efficiency variables were shown in table 1.
Table 1: Summary of Statistics of Variables used
VARIABLES UNIT STANDARD DEVIATION
MEAN MINIMUM MAXIMUM
Yield/acre Rupees 8.25 32.58 7.5 50
Wheat Area Sown Acres 8.26 5.80 0.25 100
Farm Yard Manure (FYM)/acre
No. of cartloads
35.93 19.43 2 40
Seed rate/acre Kgs 6.45 49.74 30 60
Cost of pesticides & weedicides/acre
Rupees 227.79 309 0 2000
Total irrigations/acre No.s 2.12 4.40 0 14
Total labour/acre Man-days 2.30 2.97 0.33 26.25
Cost of land preparation/acre Rupees 345 868.92 100 2500
NPK/acre Kgs 330.68 336.43 11.5 198
INEFFICIENCY VARIABLES
Total farm area Acres 18.70 14.73 0.5 210
Transportation cost Rupees 977 1004.85 40 3000
Age of farmer No. of years 14.03 43.57 17 75
Education of farmer No. of years 2.90 8.75 2 16
Irrigated farms No.s 202
Results of Data Envelopment Analysis (DEA):
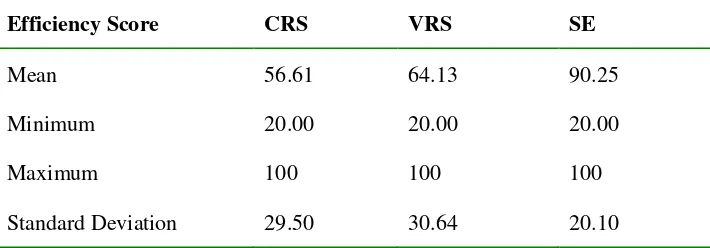
The constant return to scale and variable return to scale input-oriented DEA is estimated using computer program DEAP 2.0. The average technical efficiency estimates for CRS-DEA and VRS-DEA are 56.61 and 64.13 percent, respectively. The results show that VRS-DEA is flexible and envelops data in a tighter way than the CRS-DEA [Sharma, Leung, and Zaleski (1997), Wadud (2003) and Theodoridis and Anwar (2011). The technical efficiency estimates calculated using CRS-DEA are less than the measures using VRS-DEA. The scale efficiency is computed using relationship of CRS and VRS DEA technical efficiency. The average scale efficiency is 90.25 percent. Of the total 1578 farmers, 41 farmers faced decreasing returns to scale, 942 farmers face constant return to scale and on 595 farms DEA technique exhibits increasing return to scale. Under the CRS-DEA
and VRS-DEA, 122 and 333 farmers are fully efficient, respectively. The DEA results indicate existence of significant levels of inefficiencies on wheat farms. Thus, wheat production could be increased significantly by improving the skills of farmers and removing constraints faced by producers.
DEA Estimates of Technical Efficiency:
[image:5.612.74.429.383.507.2]Technical efficiency measures for wheat farms are estimated using data envelopment analysis. The technical efficiency of majority of the farmers lies below 50 percent in DEA model. The 44.15 and 35.30 percent of the farmers in CRS and VRS models, respectively, lies in this range. Whereas, 27.89 and 24.92 percent farmers hold technical efficiency of 50-80 percent in CRS and VRS techniques, respectively.
Table 2: Average Estimates of Technical Efficiency Estimates from DEA Models
Efficiency Score CRS VRS SE
Mean 56.61 64.13 90.25 Minimum 20.00 20.00 20.00 Maximum 100 100 100 Standard Deviation 29.50 30.64 20.10
Technical Efficiency Estimates using DEA Models
Data Envelopment Analysis
Range of TE
CRS VRS SE
No. of farms
% of farms
No. of farms
% of farms
No. of farms
% of farms
60-70 151 9.55 138 8.73 50 3.16 70-80 148 9.36 125 7.90 69 4.36 80-90 168 10.63 164 10.38 84 5.32 90-100 274 17.33 465 29.40 1217 76.98 Total 1581 100 1581 100 1581 100
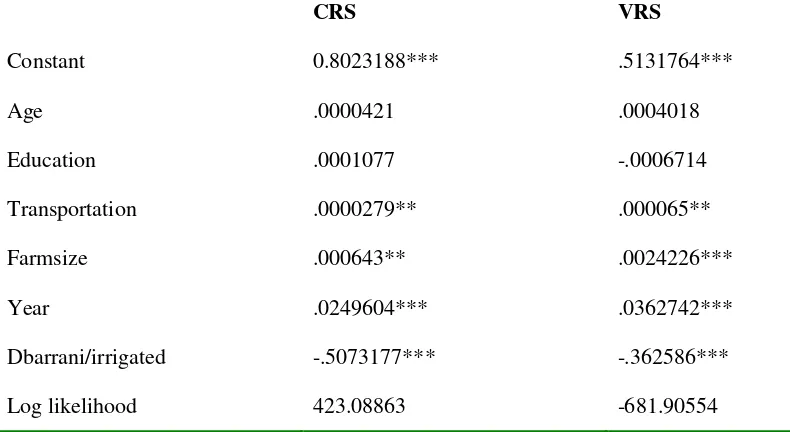
Analysis of the Determinants of Farm Level Inefficiency: The VRS- and CRS-DEA analyses the determinants of technical (in) efficiency are estimated using Tobit Regression Model. The dependent variable in Tobit Regression Model is technical (in) efficiency scores of 1581 wheat farms for the period of 2005-06 to 2007-08. The technical (in) efficiency results of DFA approaches are given in table 5.
The estimated coefficient of age is positive and insignificant in CRS and VRS Tobit Model. This result implies that the young farmers are technically more efficient than the older farmers because older farmers are rigid in adaption of new technologies and the young ones have more adaptability to modern production practices.
The coefficient of education was insignificant and carries a negative sign in VRS Tobit Model. This indicates that educated farmers are more technically efficient than the illiterate farmers. The parameter of farm size is positive and statistically significant at 10% in CRS Tobit Regression. This implies that large farmers are technically more efficient than small farmers— small farmer are less resourceful and having poor access to advanced technology and quality inputs. The transportation cost parameter is positive and significant in CRS and VRS Tobit Regression. This indicates that technical (in) efficiency decreases when the transportation cost increases and vice versa. Ahmad, Chaudhry, and Chaudhry
(2000) Argued that farmers who try to purchase quality essential inputs even from distant markets; thus, relying less on village dealers— that raises the cost of transportation, would naturally get higher productivity than those farmers who relied on village dealers for their inputs. Moreover, even marketing their produce in grain markets rather than selling to the village dealers can fetch them better price. Therefore, it is more likely that such farmers would be more technically efficient.
CRS and VRS Tobit Models indicating that the farmers located in irrigated regions are technically less inefficient than those located in barrani regions.
Table 3: Comparison of Factors Affecting Technical (In) efficiency
CRS VRS
Constant 0.8023188*** .5131764*** Age .0000421 .0004018 Education .0001077 -.0006714 Transportation .0000279** .000065** Farmsize .000643** .0024226*** Year .0249604*** .0362742*** Dbarrani/irrigated -.5073177*** -.362586*** Log likelihood 423.08863 -681.90554
Note: *, ** and *** represent the significance of variables at 10%, 5% and 1% level respectively.
SUMMARY AND CONCLUSION
The major objectives of the study are to estimate the technical efficiency measures using DEA analysis techniques. The data was taken from Punjab Economic Research Institute (PERI.) The data consists of 1578 wheat farms during the period 2006-2008 and it contains information regarding inputs used and production costs for the wheat crop. The same data set was used in DEA estimation. The CRS shows that 122 farms were fully efficient while VRS indicated that 333 farms were fully efficient. Hence the study supports that wheat farmers are technically less efficient than their potential maximum. The wheat production could be increased through increasing efficiency.
POLICY IMPLICATIONS
The estimated technical efficiencies through DEA models show that substantial technical (in) efficiencies exist in wheat farming among the farmers of the Punjab province. The analysis implies that the technical efficiency can be increased on an average, from 16-44%. While making policy, the practitioner should consider the following suggestions based on this study
The study parameters show that the productivity can be increased by improving the soil health so the development programs for agriculture should be designed in such a way that it focuses the soil health and
farmers’ productivity. Farmers can also apply gypsum and green manuring to improve their soil health.
Irrigation water availability increases the crop productivity so canal water should be made available during the required time. Water deficiency can be fulfilled by making the arrangements of popularizing the rain harvesting technology and by reducing the canal water loses either via canal lining or water-course lining.
Agriculture extensions services programs should be designed in such a way that during the start of season, agriculture agents should arrange training programs to educate farmers regarding crop production technologies. Wheat extension programs should be allocated in order to equip farmers with modern technologies and knowledge of production methods.
Marketing of the produce should be facilitated by removing the middleman and making wheat silos near to wheat farms so that farmers can easily market their produce.
REFERENCES
Ahmad, Munir, Chaudhry, Ghulam Mustafa, Iqbal, Mohammad, & Khan, Dilawar Ali. (2002). Wheat Productivity, Efficiency, and Sustainability: A Stochastic Production Frontier Analysis [with Comments]. The Pakistan development review, 643-663.
Ahmad, Munir, Chaudhry, M Ghaffar, & Chaudhry, Ghulam Mustafa. (2000). Some non-price explanatory variables in fertiliser demand: the case of irrigated Pakistan. The Pakistan Development Review, 477-486.
Bakhsh, Khuda. (2007). An analysis of technical efficiency and profitability of growing potato, carrot, radish and bitter gourd: a case study of Pakistani Punjab.
University of Agriculture Faisalabad. Byerlee, Derek. (1992). Technical change,
productivity, and sustainability in irrigated cropping systems of South Asia: Emerging issues in the post‐green revolution Era. Journal of International Development, 4(5), 477-496.
Charnes, Abraham, Cooper, William W, & Rhodes, Edwardo. (1978). Measuring the efficiency of decision making units.
European journal of operational research, 2(6), 429-444.
Farrell, Michael James. (1957). The measurement of productive efficiency. Journal of the Royal Statistical Society. Series A (General), 120(3), 253-290.
Hassan, Sarfraz, & Ahmad, Bashir. (2005). Technical efficiency of wheat farmers in mixed farming system of the Punjab, Pakistan. International Journal of Agriculture and Biology, 3, 431-435. Islam, KM, Bäckman, Stefan, & Sumelius, John.
(2011). Technical, Economic and Allocative Efficiency of Microfinance Borrowers and Non-Borrowers.
European Journal of Social Sciences. Javed, M Ishaq, Adil, Sultan Ali, Hassan,
Sarfaraz, & Al, Asghar. (2009). An
efficiency analysis of Punjab’s cotton -wheat system.
Javed, Mohammad Ishaq, Khurshid, Wasif, Adil, Sultan Ali, Hassan, Ishtiaq, Nadeem, Nasir, Ali, Asghar, & Raza, Muhammad
Arif. (2011). Analysis of technical and scale efficiency of smallholder farms of rice-wheat system in Punjab, Pakistan. J. Agric. Res, 49(1), 125-137.
Seiford, Lawrence M. (1996). Data envelopment analysis: the evolution of the state of the art (1978–1995). Journal of productivity analysis, 7(2-3), 99-137.
Sharma, Khem R, Leung, Pingsun, & Zaleski, Halina M. (1997). Productive efficiency of the swine industry in Hawaii: stochastic frontier vs. data envelopment analysis. Journal of productivity analysis, 8(4), 447-459.
Sher, Falak, & Ahmad, Eatzaz. (2008). Forecasting wheat production in Pakistan.
Sohail, Nadeem, Latif, Khalid, Abbas, Nasir, & Shahid, Muhammad. (2012). Estimation of technical efficiency and investigation of efficiency variables in wheat production: A case of district Sargodha (Pakistan). growth, 3(10).
Theodoridis, Alexandros M, & Anwar, Md Mazharul. (2011). A comparison of DEA and SFA methods: A case study of farm households in Bangladesh. The Journal of Developing Areas, 45(1), 95-110. Van Tran, Dat. (2001). Closing the rice yield gap
for food security. The New Development in Rice Agronomy and Its Effects on Yield and Quality in Mediterranean Areas, 2-12.
Wadud, Md Abdul. (2003). Technical, allocative, and economic efficiency of farms in Bangladesh: A stochastic frontier and DEA approach. The Journal of Developing Areas, 37(1), 109-126. Watkins, K Bradley, Hristovska, Tatjana,