Microstructures and Mechanical and Electrical Properties
of Hypoeutectic Cu-1, C-3 and Cu-5 at
%
Zr Alloy Wires
Preprocessed by Spark Plasma Sintering
Naokuni Muramatsu
1and Takashi Goto
21New Metals Division, NGK Insulators, Ltd., Handa 475-0825, Japan 2Institute for Materials Research, Tohoku University, Sendai 980-8577, Japan
Wires prepared by the solid-phase-compaction followed by heavy wire-drawing of atomized CuZr alloy powders were studied. Microstructures and mechanical and electrical properties of wires drawn from hypoeutectic Cu-1, Cu-3 and Cu5 at%Zr alloys, preprocessed by spark plasma sintering (SPS), were investigated. The microstructures of specimens formed by SPS of the powders changed intofine dual-phased structures comprising phases of Cu and the intermetallic compound Cu5Zr, which was dispersed in the Cu matrix. The volume fraction of the
intermetallic compound Cu5Zr in SPS specimens increased with an increase in the Zr content. The ultimate tensile strength (UTS) values of the
specimens increased, while their electrical conductivity (EC) values decreased simultaneously. The alloy wires, preprocessed by SPS, contained dual-phased microstructures in which the intermetallic compound Cu5Zr was dispersed in the shape of small islands in the Cu matrix. Drawn
Cu-1, Cu-3 and Cu5 at%Zr alloy wires exhibited UTS values of 603, 698 and 789 MPa, respectively, and EC values of 87, 70 and 52%IACS (International Annealed Copper Standard), respectively. The UTS values were about 4056%lower and EC values about 2860%higher than those previously reported for wires preprocessed by casting. The lamellar structures of the¡-Cu and eutectic (Cu+intermetallic compound Cu9Zr2) phases in the drawn wires preprocessed by casting improved the mechanical properties of the wires. The microstructures of the
intermetallic compounds Cu5Zr, which was uniformly dispersed in the Cu matrix in the drawn wires preprocessed by SPS, helped increase the
electrical conductivity of the wires. [doi:10.2320/matertrans.M2013011]
(Received January 8, 2013; Accepted April 19, 2013; Published May 31, 2013)
Keywords: copper-zirconium alloys, hypoeutectic alloys, wire drawing, spark plasma sintering, mechanical properties, electrical conductivity, intermetallic compound phase
1. Introduction
Copper alloys used in electronic devices are expected to exhibit higher strengths and higher electric conductivities. During the development of such materials, the techniques used for processing the raw materials and the following intermediate thermal and mechanical processes greatly affect the final material characteristics as well as the compositions of the alloys.
Several studies investigating the production and character-istics of new copper alloy materials have been reported recently. These materials include CuCr,1)CuFe2)and Cu Nb3)alloys that contain small amounts of hard metal particles dispersed within their matrices. Some examples of such materials are yellow brass or Cu with solid-phase-sintered tungsten4,5) and Cu with Al
2O3 dispersed by an internal
oxidation method.6) Furthermore, drawn CuAg alloy
wires7,8)with a eutectic lamellar structure prepared by casting
have been also studied. Sakai et al. studied CuAg alloys reinforced by fiber-like structures in which the primary and eutectic phases underwent elongation during the cold wire-drawing process.912) Bevk et al.3) reported a high-strength Cu12.5 at%Nb alloy that was heavily worked, leading to the development of Nbfilaments within its matrix; the alloy wire exhibited an ultimate tensile strength (UTS) of 2230 MPa.
We previously investigated the nanosized lamellar struc-tures of hypoeutectic Cu0.55 at%Zr alloy wires that were prepared by casting using a copper mold with a rod-shaped cavity and cold wire drawing. We also studied the effect of the lamellar structures on the mechanical and electrical prop-erties of wires drawn from the Cu-0.55 at%Zr alloys1317)
and found that the UTS and electrical conductivity (EC)
values of these wires were 6902234 MPa and 1683%IACS (International Annealed Copper Standard), respectively.
On the other hand, Kimuraet al.18)reported that extruded
and spark-plasma-sintered (SPS) Cu4.5 at%Zr alloys pre-pared by powder metallurgy exhibit fine hypoeutectic phase structures as well.
This study aimed to develop a new material for wires by the solid-phase compaction of atomized binary CuZr alloy powders followed by heavy wire drawing. We focused on the
fine microstructures formed during the rapid solidification process. The microstructures and mechanical and electrical properties of the drawn hypoeutectic Cu-1, Cu-3 and Cu 5 at%Zr alloy wires, preprocessed by spark plasma sintering, were also investigated.
2. Experimental Procedures
during the sintering process: heating rate=0.4 K/s; final sintering temperature=1173 K, which corresponded to about 0.9 times the melting temperature, Tm, of the test
material; holding time=15 min; and uniaxial pressure= 30 MPa.
For drawing the wires, the sintered plates of the alloys were machined into round bars with dimensions of 10 mm (diameter)©50 mm (length). The bars were drawn down to a diameter of 1 mm (corresponding to a drawing ratio, ©, of 4.6) by swaging, groove rolling, and roller-die drawing, with intermediate annealing at 923 K. Thereafter, wires with diameters of 0.0370.60 mm (©=11.25.6) were drawn continuously using diamond dies. The drawing ratio, ©, is defined by the eq. (1), withAo andAbeing the original and
final cross-sectional areas of the drawn wire specimens, respectively.
©¼lnðAo=AÞ ð1Þ
Specimens for scanning electron microscopy (SEM) observations were prepared using a cross-section polishing apparatus (JEOL SM-9010). Thin film specimens for scanning transmission electron microscopy (STEM) obser-vations were prepared using a twin-jet-type electrolytic polishing apparatus (Struers Tenupol-3) and an electrolyte solution that was a mixture of 30% nitric acid and 70% methanol. High-magnification microstructural imaging was performed usingfield-emission scanning electron microscopy (FE-SEM) (JEOL JSM-7000F), STEM (JEOL JEM-2100F) and the nanoelectron beam diffraction (NBD) method. Energy-dispersive X-ray spectroscopy (EDX) analyses were carried out using a JEOL JED-2300T system and an electron beam with a diameter of approximately 1 nm. Analyses of the intermetallic compound phases were performed by the X-ray diffraction (XRD) method using CoK¡radiation.
The electrical conductivities of the sintered and wire specimens were calculated using eq. (2), where the electrical conductivity (EC) of a standard sample, confirming to the International Annealed Copper Standard (IACS), was 0.017241 µ³m at 293 K.µis the electrical resistivity of the samples measured using a monoprobe in the case of the sintered specimens and a four-probe technique in the case of the wire specimens. These wire specimens were 500 mm in length at room temperature.
ECð%IACSÞ ¼0:017241=µ100ð%Þ ð2Þ
Tensile tests were performed on the drawn wires at room temperature using a multifunctional tensile-testing machine that confirmed to the JIS B7721 Class 0.5 Standard (Shimadzu AG-I). The ultimate tensile strength (UTS) of the drawn wires were measured once (in the case of©=4.6 7.0) and twice (in the case of ©=0), or three times (in the case of©>7.0) to obtain average values.
The hardness and Young’s modulus values of the intermetallic compounds were measured using a nano-indentation system (Agilent Technologies Nanoindenter XP/DCM) under the continuous stiffness measurement (CSM) mode. During the measurement process, the triangular pyramid Berkovich indenter was excited with a frequency of 45 Hz and amplitude of 2 nm. Five indentations within a defined displacement range 2040 nm were made on the
surfaces of the test specimens until the measured hardness and Young’s modulus became almost constant. The results were the average of thefive measurements.
3. Results and Discussion
3.1 Atomized powders
The average sizes of the particles for the Cu-1, Cu-3 and Cu5 at%Zr alloy powders, sifted to less than 106 µm, were 26, 23 and 19 µm, respectively. The particle sizes distribu-tions of these powders were almost log-normal in nature. The particle sizes decreased with an increase of the Zr content of the powders. This fact suggested that the viscosity of the molten alloys decreased when their compositions approached to their eutectic point (Cu8.6 at%Zr19)). The oxygen content of the powders, measured using the He gas fusion infrared absorption method, were approximate 0.100 mass%. All the powders exhibited the same content levels.
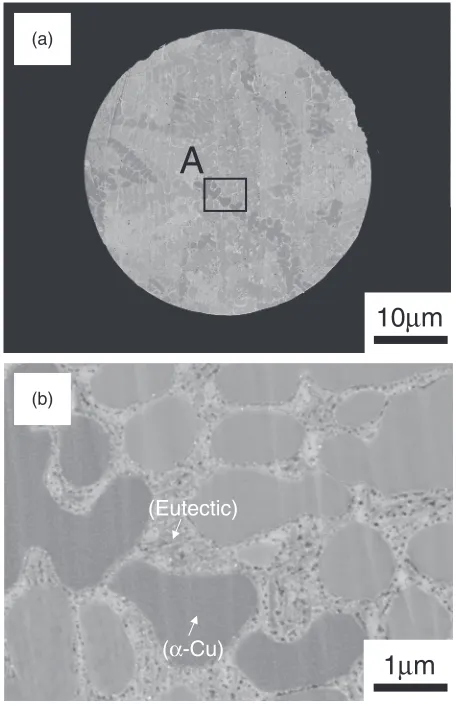
Figure 1(a) shows the scanning electron microscopic backscattered electron image (SEM-BEI) of a cross-section of the particles for the Cu5 at%Zr alloy powder; the particles were approximately 36 µm in size. The atomized particles were almost spherical in shape. Figure 1(b) shows a high-magnification image of the part A enclosed in the square in Fig. 1(a). Dendrite-like microstructures of the ¡-Cu
(a)
(b)
1
μ
m
10
μ
m
A
(Eutectic)
(
α
-Cu)
[image:2.595.313.541.70.423.2]and eutectic phases were formed in the particle. The arms of the secondary dendrite were short. This suggested that these particles solidified rapidly during the atomization process. The average value of secondary dendrite arm spacing (DAS), measured at four other points, was 0.81 µm. This was less than one-third of the value for the Cu4 at%Zr alloy rod that was rapidly cast into a copper mold, which exhibited a secondary DAS value of 2.7 µm.13) On the other hand, the dendrite arms were not formed in the case of the cast Cu5 at%Zr alloy rod, owing to the presence of small¡-Cu phases,13)and hence its DAS value could not be measured. This result indicated that the solidification rates of the atomized powders were higher than those of the cast rods.
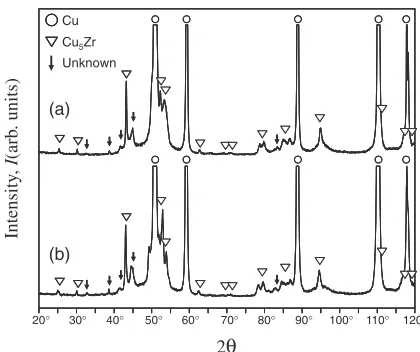
Figure 2(a) shows the X-ray diffraction (XRD) profiles of the atomized powder for the Cu5 at%Zr alloy. In this profile, Cu and Cu5Zr phases (ICDD No. 40-1322) were identified,
indicating that atomized powder is consisted of eutectic phase. Furthermore, other peaks, related to an unknown phase and indicated by the arrows, were also detected. These unknown peaks did not correspond to the diffraction angles of any intermetallic compounds (such as Cu9Zr2) seen in the
CuZr equilibrium phase diagram.19)We intend to investigate the unknown phase further.
3.2 Spark-plasma-sintered specimens
The specific gravities of the spark-plasma-sintered (SPS) Cu-1, Cu-3 and Cu5 at%Zr alloy specimens, measured by means of Archimedes method, were 8.92, 8.85 and 8.79, respectively. These values were comparable to the gravity (8.79) of a compeletely consolidated Cu4.5 at%Zr alloy.18) The XRD profiles of the sintered Cu5 at%Zr alloy specimen are shown in Fig. 2(b). The diffraction peaks of the Cu, Cu5Zr, and the unknown phases were the same as those of the
Cu5 at%Zr alloy powder seen in Fig. 2(a). This suggested that the fundamental structure of this powder did not change after sintering. A few of the diffraction peaks in (b), however, sifted slightly toward smaller angles. This means that the lattice parameters of the sintered specimens were larger than those of the corresponding atomized powder. This might be because the lattice strains induced in the powder by rapid solidification were reduced to a small degree. Similar trends were noticed in the case of the SPS Cu-1 and Cu-3 at%Zr alloy specimens as well.
Figures 3(a)(c) show cross-sectional SEM images of the SPS Cu-1, Cu-3 and Cu5 at%Zr alloys perpendicular to the compression axis. A few voids can be seen in each specimen. This suggests the sintered specimens were sufficiently consolidated. The microstructures of the cross-sections parallel to the compression axis were similar to those of the perpendicular cross-sections. It is observed that the micro-structures were not heterogeneous. The volume fraction of the bright area of the microstructures increased with an increase in the Zr content. In addition, the SEM-EDX results of the microstructures, shown in Fig. 3(c), did not show the presence of Zr in the dark area. It might be reasonable to take the Zr content in this part shown in Fig. 3(c) lower than the detection limit of SEM-EDX system. As reported by Muramatsu et al.13) however, 0.3 at%Zr is soluble in the
matrix of ¡-Cu phases. On the other hand, 16.9 at%Zr was detected in the bright phase. The detected Zr content in the bright phase was in accordance with the stoichiometric composition of 16.9 at%Zr for the intermetallic compound Cu5Zr. This fact shows that Zr existed mainly in the
intermetallic compound phase. The intermetallic compound Cu5Zr was dispersed in the shape of small islands in the Cu
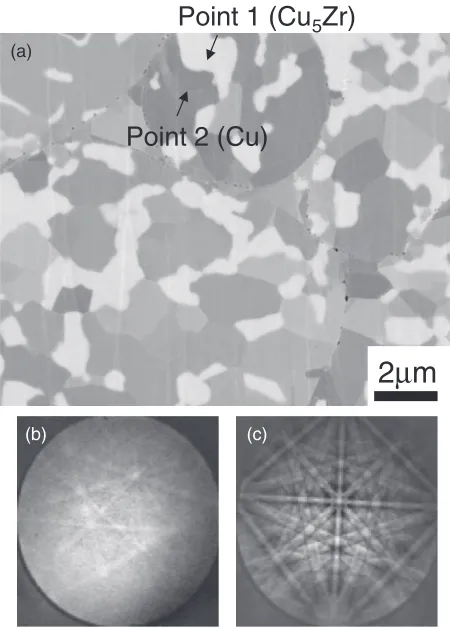
matrix. Figure 4(a) shows the high-magnification micrograph of FE-SEM-BEI for the SPS Cu5 at%Zr alloy specimen.
20° 30° 40° 50° 60° 70° 80° 90° 100° 110° 120° Cu
Cu5Zr
Unknown
(a)
(b)
2θ
Intensity
,
I
(arb
. units)
Fig. 2 X-ray diffraction profiles of (a) the atomized powder and (b) the spark-plasma-sintered specimen of the Cu5 at%Zr alloy.
(c)
10
μ
m
(b)
10
μ
m
(a)
10
μ
m
(Cu
5Zr)
(Cu)
[image:3.595.62.272.378.554.2] [image:3.595.107.490.613.762.2]From the figure, it can be observed that the dual-phased microstructure consisted of the dark (Cu) and bright (intermetallic compound Cu5Zr) phases. The monotone of
the bright area (Cu5Zr) means it was a single-phased
structure. On the other hand, the multiple tone of the dark area (Cu) suggests the Cu grains had different orientations. It was observed that fine oxide particles existed along the original powder’s boundaries. Figures 4(b) and 4(c) show the Kikuchi patterns obtained from the point 1 (Cu5Zr)
and point 2 (Cu), which were in contact with each other. The channeling patterns corresponding to the points were different. This suggests that the Cu5Zr and Cu phases had
different orientations, and there was incoherence between them. This result is in contrast to the coherence between the eutectic (Cu+Cu5Zr) and Cu phases in the cast 0.5,
Cu-1 and Cu-2 at%Zr alloys previously reported by Muramatsu
et al.17) In addition, the microstructures of the SPS Cu-1,
Cu-3 and Cu5 at%Zr alloy specimens, shown in Fig. 3, are more homogeneous than those of the cast Cu-0.55 at%Zr alloy rods13,16,17)and exhibited afiner dual-phased structure. This fact indicates that the SPS specimens can potentially be drawn into wires. This feature is one of important character-istics of alloys prepared by the SPS process which can increase or decrease the temperature of the specimen in a short period.
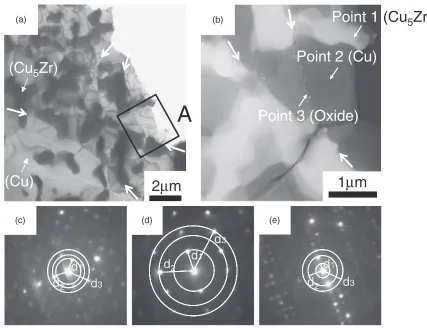
Figure 5 show the STEM images and NBD patterns of the SPS Cu5 at%Zr alloy specimen. Figure 5(a) is a STEM-BF image and Fig. 5(b) is a high-magnification high-angle
annular dark-field (HAADF) image of the portion A in Fig. 5(a). Figures 5(c), 5(d) and 5(e) are the NBD patterns of the points 1 (Cu5Zr), 2 (Cu) and 3 (an oxide particle) in
Fig. 5(b), respectively. The image in Fig. 5(a) shows clearly the dual-phased microstructures of the dark phases (Cu) and the bright phases (Cu5Zr). The curved lines located between
the arrows indicate boundaries of the original atomized powder particles. No dislocation substructure with a high pile-up density was observed in the Cu phases. The Cu phases exhibited coarsened grain structure after their recovery and recrystallization. The HAADF image in Fig. 5(b) shows the bright phase (Cu5Zr) dispersed in the
dark phase (Cu). It can be observed that oxide particles of approximate 3080 nm in size were dispersed along the original boundaries of the powder particles.
The EDX results corresponding to the points 1 (Cu5Zr), 2
(Cu) and 3 (an oxide particle) are shown in Table 1. On the basis of the data listed in Table 1, it can be said that the phases at points 1, 2 and 3 are of the intermetallic compound (Cu5Zr), Cu, and an oxide phase (comprising Cu, Zr and O),
respectively. The EDX results suggest that the SPS Cu 5 at%Zr alloy specimens consisted of Cu, Cu5Zr, and some
CuZrO-system phases. The EDX results suggest that single phases of Cu and Cu5Zr were formed during the sintering
process. These single phases were presumably the results of the change from the dendrites, which comprised of the¡-Cu and the eutectic (Cu+intermetallic compound Cu5Zr)
phases shown in Fig. 1.
The lattice plane spacings obtained from the diffraction patterns are shown in Table 2. Also listed in the table are the interplanar spacings calculated at the specific lattice planes of the intermetallic compounds Cu5Zr, Cu9Zr2 and Cu8Zr3
(those for hypoeutectic Cu-0.55 at%Zr alloy wires were reported previously elsewhere1317)), and those of the Cu,
and the Cu8O7, Cu4O3 and Cu2O2 phases. The lattice plane
spacings corresponding to the d1, d2 and d3 spots, obtained
from the point 1 in Fig. 5(c), were in good agreement with those of the intermetallic compound Cu5Zr. In addition, those
corresponding to the point 2 in Fig. 5(d) agreed with those of the Cu. Those related to the point 3 in Fig. 5(e), however, were not in accordance with those of any copper oxides, because it was a CuZrO-system phase. Through these results, it can be reasonable to consider that the Cu of the eutectic phase diffused during sintering and the surrounding Cu grains coarsened and linked with the original¡-Cu matrix in a network-like manner with those undergoing recovery and recrystallization. On the other hand, it seems that the Cu5Zr
of the eutectic phase was left behind and its structure changed into a single-phased one. This can be understood on the basis of the fact that there was incoherence between the Cu and Cu5Zr phases shown in Figs. 4(b) and 4(c). Moreover, this
was also speculated from the Cu5Zr dispersions, which left
some traces of distribution of the eutectic phase in the dendrites shown in Fig. 1(b).
Table 3 shows the hardness (HIT) and Young’s modulus
(E) values of the intermetallic compound Cu5Zr phase for the
SPS Cu5 at%Zr alloy specimen, measured by means of nanoindentation. The average values and standard deviations were obtained by thefive time measurements. TheHITvalues
of the intermetallic compound Cu5Zr phase was 6.3 GPa.
2
μ
m
(a)
(b) (c)
Point 1 (Cu
5Zr)
Point 2 (Cu)
[image:4.595.56.281.70.384.2]The HIT values can be converted into the Vickers hardness
Hv using eq. (3).20)
Hv¼0:0924HIT ð3Þ Thus, the Hv value of Cu5Zr phase is 585. This value was
24% higher than that of the intermetallic compound Cu9Zr2,
which is 470«30Hv, as determined by Glimois21)and 6.5 times of the hardness of oxygen free copper (OFC) (C10200), which is 89Hv.22) The Young’s modulus, E, of the intermetallic compound Cu9Zr2 was 159.5 GPa, which is
35% higher than that of OFC, 118 GPa.23)
3.3 Drawn wire specimens
Wires were drawn from rod-shaped specimens with dimensions of 10 mm (diameter)©50 mm (length). The rod-shaped specimens were prepared from 50©50© 10 mm plates of the SPS Cu-1, Cu-3 and Cu5 at%Zr alloys
by turning. It was possible to draw down all the sintered specimens to wires of 1 mm in diameter (©=4.6) without any breakage. The Cu-1, Cu-3 and Cu5 at%Zr alloy specimens were further drawn into wires of 0.037 mm in diameter (©=11.2), 0.16 mm in diameter (©=8.3), and 0.60 mm in diameter (©=5.6), respectively. Wire-drawabil-ity of the alloy specimens trended to become higher with a decrease in their Zr content, that is, a decrease in the amount of Cu5Zr. The UTS andECvalues of the wires thus obtained
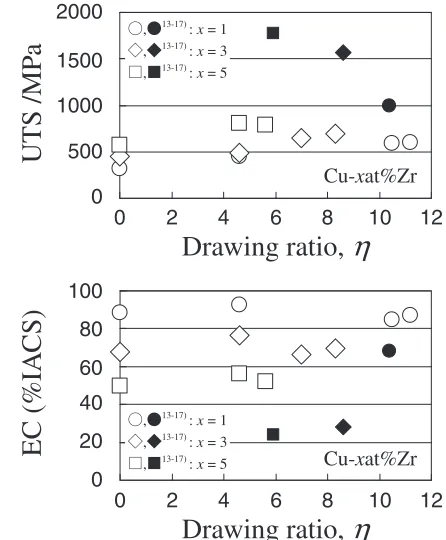
were 603 MPa and 87%IACS, 698 MPa and 70%IACS, and 789 MPa and 52% IACS, respectively. Figure 6 shows the relationship between drawing ratios and the UTS and that between the ratios and the EC for the drawn wires. The UTS increased with an increase in the drawing ratio. On the other hand, the EC remained almost constant for all the drawing ratios. The corresponding values of the Cu-1, Cu-3 and Cu 5 at%Zr alloy wires drawn from cast rods with almost the same drawing ratios were 998 MPa and 68% IACS (©=10.4), 1572 MPa and 28% IACS (©=8.6), and 1773 MPa and 24%IACS (©=5.9), respectively.1317)These relations between UTS or EC and©are also shown in Fig. 6 for comparison. The UTS values of the wires drawn from the SPS specimens were about 4056% lower, while the EC
values were 2860%higher than those of the wires from the cast rods.
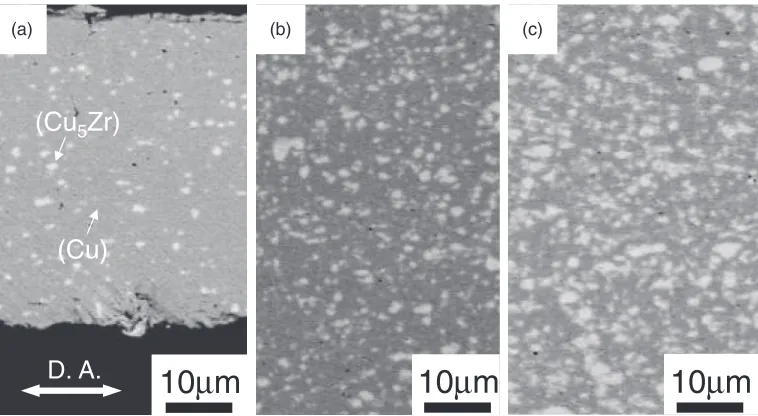
[image:5.595.80.507.67.395.2]Figure 7 shows the cross-sectional SEM images of the Cu-1, Cu-3 and Cu5 at%Zr alloy wires parallel to the drawing axis. The images of (a)(c) are those of the drawn Cu-1 at%Zr
Table 1 Results of EDX analysis of the spark-plasma-sintered Cu5 at%Zr alloy specimen. The points 13 correspond to the points 13 in Fig. 5(b).
Point O
(at%)
Cu (at%)
Zr (at%)
1 ® 83.5 16.5
2 ® 100.0 ®
3 34.3 55.3 10.4
d
d
1d
2d
3d
1 2d
3d
1d
2d
32
μ
m
(a)
(c) (d) (e)
A
1
μ
m
(b)
Point 1
(Cu
5Zr)
Point 2 (Cu)
Point 3 (Oxide)
(Cu
5Zr)
(Cu)
[image:5.595.45.291.480.548.2]alloy wire (©=11.2), Cu-3 at%Zr alloy wire (©=8.3) and Cu5 at%Zr alloy wire (©=5.6), respectively. After heavy wire-drawing, the dispersion of Cu and the intermetallic compound Cu5Zr phases observed in (a)(c) became more
homogeneous. It seems that the intermetallic compound Cu5Zr is hardly deformed due to its high hardness (listed in
Table 3) and incoherence to the Cu matrix. On the other hand, the Cu matrix is easily deformed during drawing. As a result, the dispersion of Cu5Zr becomes more homogeneous.
These dispersed microstructures differed significantly from the small andfine lamellar structures, which consisted of the
¡-Cu and eutectic (Cu+Cu8Zr3 or Cu+Cu9Zr2) phases
seen in the Cu-0.55 at%Zr alloy wires.1317)This suggested
that microstructures of the ¡-Cu and the eutectic (Cu+ Cu9Zr2) phases were effective in improving the mechanical
strength of the corresponding wires. On the other hand, the microstructures of the intermetallic compound Cu5Zr,
dispersed homogeneously in the Cu matrix, were effective in improving the electrical conductivity of the corresponding wires. The mechanical property of the drawn hypoeutectic CuZr alloy wires preprocessed by SPS is attributable to the Cu5Zr dispersive reinforcement and the high electrical
conductivity is supported by the Cu grains linking with each other in a network-like manner. In the future, we aim to study the relationships between the microstructures present in the wires and the mechanical and electrical properties of the wires in greater detail and establish principles for developing new hypoeutectic CuZr alloy wire materials with high strength and high electrical conductivities.
4. Summary
The microstructures and mechanical and electrical proper-ties of drawn hypoeutectic Cu-1, Cu-3 and Cu5 at%Zr alloy wires preprocessed by spark plasma sintering (SPS) were investigated. The following results were obtained.
(1) The microstructures of the sintered specimens formed from the alloy powders changed into fine dual-phased structures comprising single phases of Cu and the intermetallic compound Cu5Zr. The intermetallic
[image:6.595.312.535.71.341.2]com-pound was dispersed in the shape of small islands in the Cu matrix. Finally, the volume fraction of the
Table 2 Spacings of the lattice parameters, obtained from the NBD patterns of the points 13 seen in Fig. 5(b). The spacings of the lattice planes of the phases of the intermetallic compounds Cu5Zr, Cu9Zr2, and Cu8Zr3, and
those of copper, various copper oxides (Cu8O7, Cu4O3 and Cu2O)
obtained by calculations, are also shown for comparison. Point-1 Point-2 Point-3 Symbol Spacing/nm Symbol Spacing/nm Symbol Spacing/nm
d1 0.3431 d1 0.1809 d1 0.5686
d2 0.2427 d2 0.1087 d2 0.2653
d3 0.1716 d3 0.0829 d3 0.1895
Phase System of symmetry Lattice plane Interplanar spacing/nm
Cu5Zr cubic
(200) 0.3435 (220) 0.2429 (400) 0.1717
Cu9Zr2 tetragonal
(200) 0.3428 (220) 0.2424 (400) 0.1714
Cu8Zr3 orthorhombic
(121) 0.3403 (311) 0.2422 (215) 0.1740
Cu cubic
(200) 0.1808 (311) 0.1090 (331) 0.0829
Cu8O7 tetragonal
(100) 0.5817 (210) 0.2601 (222) 0.1899
Cu4O3 tetragonal
(101) 0.5010 (211) 0.2517 (301) 0.1904
Cu2O cubic
(100) 0.4217 (111) 0.2435 (210) 0.1886
Drawing ratio,
η
2000
1500
1000
500
0
UTS /MP
a
0
0
2 4 6 8 10 12
2 4 6 8 10 12
Drawing ratio,
η
EC (%IA
CS)
100
80
60
40
0 20
Cu-xat%Zr
Cu-xat%Zr , 13-17) : x = 1
, 13-17) : x = 3 , 13-17)
: x = 5 , 13-17)
: x = 1 , 13-17) : x = 3 , 13-17)
: x = 5
[image:6.595.46.292.123.489.2]Fig. 6 Relationship between the drawing ratio and ultimate tensile strength (UTS) and that between the drawing ratio and electrical conductivity (EC) for the drawn Cu-xat%Zr (x=1, 3 and 5) alloy wires. Open symbols are obtained by this work, and closed ones are cited from the previous study.1317)
Table 3 Hardness (HIT) and Young’s modulus (E) of the intermetallic
compound Cu5Zr measured over a defined range 2040 nm using the
nanoindentation technique.
Cu5Zr
Hardness HIT/GPa
Young’s modulus
E/GPa
Average 6.3 159.5
[image:6.595.47.291.558.611.2]intermetallic compound Cu5Zr phase in the sintered
specimens increased with an increase in the Zr content. (2) The ultimate tensile strength (UTS) values of the sintered specimens increased, while their electrical conductivity (EC) values decreased simultaneously. (3) The Cu-1, Cu-3 and Cu5 at%Zr alloy wires
prepro-cessed by SPS exhibited dual-phased microstructures in which the intermetallic compound Cu5Zr was dispersed
finely within the Cu matrix.
(4) Finally, the drawn Cu-1, Cu-3 and Cu5 at%Zr alloy wires preprocessed by SPS, whose diameters and drawing ratios (©) were 0.037 mm and 11.2, 0.16 mm and 8.3, and 0.60 mm and 5.6, respectively, exhibited UTS and EC values of 603 MPa and 87% IACS, 698 MPa and 70%IACS, and 789 MPa and 52%IACS, respectively. These values were about 4056% lower (in the case of the UTS values) and about 2860% higher (in the case of the EC values) than those previously reported for wires preprocessed by casting. (5) The results showed that the lamellar structures of the¡
-Cu and eutectic (-Cu+intermetallic compound Cu9Zr2)
phases in the drawn wires preprocessed by casting were effective in improving the mechanical properties of the wires. The microstructures of intermetallic compound Cu5Zr, which was uniformly dispersed within the Cu
matrix in the drawn wires preprocessed by SPS, were advantageous for improving the electrical conductivity of the wires.
Acknowledgements
The authors wish to thank Professor Hisamichi Kimura and Mr. Akira Okubo of the Institute for Materials Research (IMR), Tohoku University for their support during this study.
REFERENCES
1) P. D. Funkenbusch, T. H. Courtney and D. G. Kubisch:Scr. Metall.18
(1984) 10991104.
2) P. D. Funkenbusch, T. H. Courtney and D. G. Kubisch:Scr. Metall.15
(1981) 13491354.
3) J. Bevk, J. P. Harbison and J. L. Bell:J. Appl. Phys.49(1978) 6031 6038.
4) R. M. Vennett, S. M. Wolf and A. P. Levitt:Metall. Trans.1(1970) 15691575.
5) C. Schoene and E. Scala: Metal. Trans.1(1970) 34663469. 6) http://t-kimura03.cc.yamaguchi-u.ac.jp/classic/kaizen01/h13-5m/
5m29c.htm.
7) K. Yamaji: Sosei-to-kakou5(1964) 711724.
8) G. Frommeyer and G. Wassermann: Acta Metall.23 (1975) 1353 1360.
9) Y. Sakai, K. Inoue, T. Asano and H. Maeda: J. Japan Inst. Metals55
(1991) 13821391.
10) Y. Sakai, K. Inoue, H. Wada and H. Maeda:Appl. Phys. Lett.59(1991) 29652967.
11) Y. Sakai and H.-J. Schneider-Muntau:Acta Mater.45(1997) 1017 1023.
12) http://www.nims.go.jp/news/press/2005/12/vk3rak0000005cqz.html. 13) N. Muramatsu, N. Ogawa, H. Kimura and A. Inoue: J. JRICu49(2010)
6772.
14) N. Muramatsu, H. Kimura and A. Inoue: J. JRICu50(2011) 199203. 15) N. Muramatsu, H. Kimura and A. Inoue:Mater. Trans.53(2012) 1062
1068.
16) N. Muramatsu, H. Kimura and A. Inoue: J. Japan Inst. Copper 51
(2012) 3136.
17) N. Muramatsu, H. Kimura and A. Inoue:Mater. Trans.54(2013) 176 183.
18) H. Kimura, N. Muramatsu, A. Inoue and A. Ohkubo: J. JRICu 50
(2011) 7579.
19) D. Arias and J. P. Abriata:Bull. Alloy Phase Diagr.11(1990) 452459.
20) ISO14577-1 Metallic Materials ®Instrumented Indentation Test for Hardness and Materials Parameters®Part 1: Test Method, 2002. 21) J. L. Glimois, P. Forey and J. L. Feron:J. Less-Common Metals113
(1985) 213224.
22) Shindouhin-data-book, 2nd edition, JRICu (2009) p. 76.
23) Shindouhin-data-book, 2nd edition, JRICu (2009) p. 54.
10
μ
m
10
μ
m
10
μ
m
D. A.
(a) (b) (c)
(Cu
5Zr)
(Cu)
[image:7.595.109.488.69.277.2]