Microstructure Evolution of Mg
4.3Zn
0.7Y
0.6Zr Alloy
during Solution Heat Treatment
Junjie Li
1, Yacong Zhang
1, Jincheng Wang
1,+and Zhongming Zhang
21State Key Laboratory of Solidification Processing, Northwestern Polytechnical University, Xi’an 710072, P. R. China 2School of Materials Science and Engineering, Xi’an University of Technology, Xi’an 710048, P. R. China
The microstructure evolution in a Mg4.3Zn0.7Y0.6Zr (mass%) alloy was investigated during solution heat treatment from 300 to 500°C for 12 h. In the as-cast and solution-treated at 300°C for 12 h states, the microstructures are consisting of I-phase and¡-Mg. After solution treated at 400°C for 12 h, besides I-phase and¡-Mg, some long strip precipitates-which are determined as Zn2Zr phase-, also appear in the
microstructure. In the solution-treated sample at 500°C for 12 h, small amounts of Zn2Zr and Mg0.97Zn0.03phases have been found. With the
increase of heat treatment temperature, the phase constituents for different states are:¡-Mg+I-phase (as-cast)¼¡-Mg+I-phase (300°C for 12 h)¼¡-Mg+I-phase+W-phase+Zn2Zr (400°C for 12 h)¼¡-Mg+Zn2Zr+Mg0.97Zn0.03(500°C for 12 h).
[doi:10.2320/matertrans.M2013378]
(Received October 7, 2013; Accepted November 27, 2013; Published January 11, 2014)
Keywords: magnesiumzincyttriumzirconium alloy, solution treatment, phase component, microstructure evolution
1. Introduction
Due to the owning of low density, high specific strength,
excellent cast ability, good electromagnetic shielding ability, good damping and ease of recycling, Mg alloys are attractive as light weight structural materials, which leads to the increasing applications, especially in the areas of
automo-biles, electronic communication, sports and aerospace.1,2)
However, low strength, poor ductility and poor corrosion resistance hinder their widespread application. Therefore, great efforts have been spent to improve the strength, ductility and corrosion resistance of Mg alloys.
The MgZnY alloy system is rich in intermetallic phases and several stable ternary intermetallic compounds, including an icosahedral quasicrystal phase (I-phase) existing near the MgZn edge, making the system promising for developing Mg-based light metallic alloys with a large variety of
candidates of intermetallic reinforcement phases.3)In recent
years, many studies have indicated that MgZnY alloys containing quasicrystal phase exhibit high strength at ambient temperature, good elevated temperature properties, excellent creep resistance and moderate corrosion resistance. Due to the specially ordered quasi-periodic lattice structure, quasicrystals have many interesting properties, such as high
hardness, high corrosion resistance, low coefficient of friction
and low interface energy.4) Therefore, there has been great
interest in MgZnY alloys strengthened by I-phase.57)It has
been reported6) that the interface layer of ¡-Mg with a 3
to 5 nm thickness still preserved the coherency orientation relationship with the I-phase by introducing steps and ledges periodically along the interface. So the atomic bonding between the I-phase and the hexagonal structure was rigid enough to be retained during plastic deformation. Therefore, quasicrystal strengthening is a very effective method to improve the strength of Mg alloys. It is also well known that Zr can act as an effective nucleus for heterogeneous
nucleation of Mg alloys. Moreover, the addition of Zr has
no effect on phase constituents of MgZnYZr alloys.8)
Therefore, it can also be expected to develop MgZnYZr alloys containing I-phase.
In recent years, MgZnYZr system alloys have attracted
significant interest due to the high strength at room and
elevated temperature. Current research mainly focuses on
the microstructures and mechanical properties. Zhanget al.9)
have studied the effects of Y on microstructures and mechanical properties of extruded MgZnYZr alloys. Xu et al.10) have investigated microstructures and mechanical
properties of as-cast and as-extruded MgZnYZr alloys
with different Zn/Y ratios. Huang et al.11)has investigated
the variation of microstructures with composition during
solidification process in MgZnYZr alloys using thermal
analysis with cooling curves. Precipitation hardening is one of the strengthening mechanisms that may be utilized in both the as-cast and the wrought Mg alloys in order to further
improve the strength of the alloys. Recently, Hono et al.12)
has discussed the potential to develop high-strength low-cost wrought Mg alloys through precipitation hardening, and they concluded that further investigations of microalloying elements that enhance the age-hardening responses of Mg alloys may lead to the development of high-strength age-hardenable wrought Mg alloys. As to MgZnYZr alloys containing I-phase, it also can undertake heat treatment because the microstructure of alloys is sensitive to heat treatment. However, the microstructure evolution of MgZn YZr alloys has not yet been well understood during the process of heat treatment. Determining the optimum solution heat treatment condition is a major consideration in the fabrication of high strength MgZnYZr alloys. Therefore, in the present study, we focus on the microstructure development during the solution heat treatment of the
Mg4.3Zn0.7Y0.6Zr (mass%) alloy from 300 to 500°C
with 12 h. The effect of solution heat treatment on phase constituents and precipitate morphology under various heat treatment conditions will be emphasized.
+Corresponding author, E-mail: jchwang@nwpu.edu.cn
mould forming a cylindrical ingot with 35 mm in diameter, and 200 mm in height. Specimens were cut from the ingot by electric spark linear cutting machine. Samples were solution treated at 300, 400 and 500°C for 12 h and then rapidly quenched into the cold water. During the heat treatment,
samples were encapsulated in an iron tankfilled with graphite
powder to prevent oxidation.
Microstructure examinations were performed in an optical microscope (OM, OLYMPUS GX71), a scanning electron microscope (SEM, VEGAIILMH) and a transmission electron microscopy (TEM, Tecnai F30). Phase analysis
was determined by a D/Max 2400 X-ray diffractometer using
monochromatic Cu K¡ radiation from the sample with a
cross-sectional area of 30©30 mm. The ingredient
percent-age of elements Zn, Y and Zr has been measured by the VEGAIILMH using energy-dispersive spectroscopy (EDS). SEM observations with spectrometer using secondary electron imaging (SEI) have been done to determine micro-structures and compositions.
3. Results and Discussions
[image:2.595.326.524.409.571.2]3.1 As-cast microstructures
Figure 1 is a schematic isothermal section of MgZnY near Mg-rich corner at 673 K based on the calculation of Shao et al.3) The chemical position of the alloy in present
study neglecting element Zr (Mg4.3 mass% Zn0.7 mass%
Y or Mg1.68 at% Zn0.2 at% Y) is also indicated in
this figure. Generally, there exist three kinds of ternary
equilibrium phases in MgZnY systems,37) i.e., I-phase
(Mg3Zn6Y, icosahedral quasicrystal structure with five-fold
symmetry), W-phase (Mg3Zn3Y2, cubic structure) and
X-phase (Mg12ZnY, 18R long period modulated structure).
Moreover, it has been noticed that the phase constituents
in MgZnY alloys are largely dependent on the Zn/Y
Mg4.3Zn0.7Y0.6Zr (mass%) alloy. As shown in
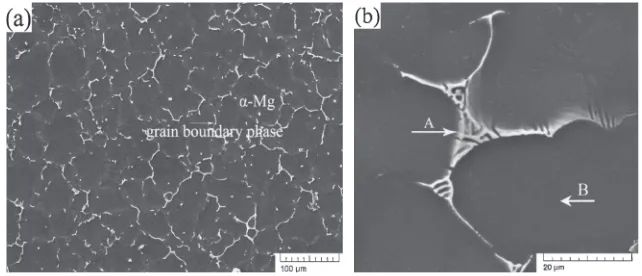
Fig. 2(a), the as-cast sample has a uniform and equiaxed grain structure, with a single phase solid solution and a network of eutectic phase, which is mostly dispersed between the dendrite branches of the Mg solid solution. Some Zr-rich particles are located in the center of the equiaxed grain. The linearly intercepted average grain size of the as-cast sample is about 39 µm. Figure 2(b) shows the X-ray diffraction pattern of the as-cast sample. It can be found that, except diffraction peaks of I-phase, other diffraction peaks with relatively high intensity can be
assigned to the ¡-Mg phase. This indicates that the main
phase constituents of as-cast Mg4.3Zn0.7Y0.6Zr alloy
are I-phase and ¡-Mg phase, which is in agreement with
previous expectations.
α-Mg + I + W
0 2 4 6 8 10 0.5
12 14 16 18 20 1.0
1.5 2.0
2.5 4.0
3.5
3.0
0
Zn (at.%)
α-Mg + I +Liquid α-Mg + I α-Mg + W α-Mg + W + X α-Mg + X
Y (at.%) 673 K
Mg
Fig. 1 Schematic isothermal section of MgZnY system near mg-rich corner at 673 K, based on the calculation of Shaoet al.,3)the solid symbol
indicates the chemical composition of the alloy in present study neglecting element Zr.
20 0 1000 2000 3000 4000
B B A A
A A A A
A
A
A
Intensity
(
arb
. unit
)
2θ (degree)
Α⎯α−Μg B⎯I-phase
(b) (a)
A B
70 60 50 40 30
[image:2.595.131.466.646.771.2]Figure 3(a) is the typical SEM image of the as-cast sample
and the high-magnification microstructure of the eutectic
compounds is shown in Fig. 3(b). It is found that lamellar structures exist in the triple junction, which is the eutectic
phase (¡-Mg+I phase). The compositions of point A and
point B in Fig. 3(b) were determined by EDS as shown in Table 1. Although the amount of Mg in point A is quite high (this may result from the effect of Mg matrix), the atomic percentage of Zn and Y is about 6 : 1, which is in accordance with the atom percentage of the standard I-phase. So the
lamellar eutectic structure phase could be confirmed as
I-phase and¡-Mg phase while the matrix is¡-Mg phase.
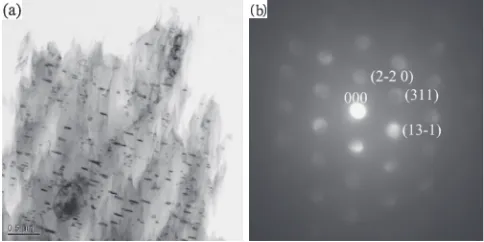
To further validate the existence of I-phase in the Mg
4.3Zn0.7Y0.6Zr alloy, TEM bright-field image of the
as-cast sample is shown in Fig. 4(a). The composition of point B as shown in Fig. 4(a) is determined by EDS as about
Mg(33.10 at%), Zn(56.95 at%) and Y(9.90 at%), which is
very close to the standard composition of icosahedral
quasicrystal Mg3Zn6Y. A typical selected area diffraction
(SAD) pattern taken from I phase in the peripheral eutectic region is shown in Fig. 4(b), which is the corresponding electron diffraction pattern of point B as marked in Fig. 4(a). The 5-fold symmetry of diffraction pattern demonstrates that the particle phase presents icosahedral symmetry with
a scaling relationship defined by the golden mean, ¸¼
ðpffiffiffi5þ1Þ=2, which indicates the particle phase is an
icosahedral quasicrystal phase.14)
It should be noted that solidification segregation is
generally found due to the small solubility of alloying elements in the Mg alloys, yielding an enrichment of Zn and
Y solute in the liquid. The compositions of ¡-Mg phase
(point B in Fig. 3(b)) shown in Table 1 indicate that the
solubilities of Zn and Y in ¡-Mg phase are very small,
meanwhile the concentration of Zn in¡-Mg phase are larger
than that of Y, which means the Zn/Y ratio in the liquid
phase will decrease. So it could be expected that even if the
original atomic ratio of Zn/Y is larger than 6 (or the original
mass ratio is larger than 4.38), the final phase constituent
could include¡-Mg phase, I phase and W phase, which is the
phase constituent for equilibrium solidification with the
atomic ratio of Zn/Y between 1.5 and 6. However, the total
content of Zn and Y in present study is just 5%, and the
atomic ratio of Zn/Y is about 8.4 (the mass ration is 6.14),
which is much higher than the lower limit for completely
forming¡-Mg phase and I phase. Therefore, the quantity of
the W-phase formed due to solute segregation should be tiny and should hardly be detected for the alloy composition
studied here. In the experiments of Lee,13)it has also been
found that when the total content of Zn and Y is less than
10% (mass fraction) and the mass ratio of Zn/Y is 57, the
identified phase constituent in the as-cast microstructure of
MgZnY system only include¡-Mg phase and I-phase. But
when the total content of Zn and Y is large and the atomic
ratio of Zn/Y is just slightly higher than 6, W-phase may be
also detected due to the solute segregation in the liquid phase.
Actually this has already be confirmed in the experiments
of Mg9.25Zn1.79Y7.67Li (mass%) alloy by Xu and
coworkers.15)
3.2 Microstructures of solution treated alloys with
different temperatures
Figure 5 shows the optical microstructures of solution-treated samples with different temperatures for 12 h. After solution treatment at 300°C for 12 h, the microstructure of the alloy remains equiaxed, but a small amount of point-like or
flaky structures appear in some grains. In this case, the grain
size increases from 39 µm of the as-cast state to 45 µm. After solution treatment at 400°C for 12 h, many more block-like and petal-like structures appear in grains, and the grain size
[image:3.595.137.458.70.208.2]Fig. 3 (a) SEM image of the as-cast sample; (b) its high-magnification microstructure of the eutectic compounds.
Table 1 Composition of as-cast sample measured by EDS. Mg (at%) Zn (at%) Y (at%) Zr (at%)
A 79.59 17.60 2.81 0
B 97.99 1.63 0.01 0.37
[image:3.595.307.547.251.368.2] [image:3.595.45.291.261.304.2]increases to 50 µm. After solution treated at 500°C for 12 h, a large number of block-like and petal-like structures appear in the grains, and the average grain size increases to 57 µm. Therefore, with increasing the solution treatment temper-ature, more and more petal-like structures appear and the average grain size also increases.
To further determine the petal-like structures as shown in
Fig. 5(b), TEM bright-field diffraction contrast image and its
corresponding micro-area diffraction pattern for the solution-treated sample at 400°C for 12 h are shown in Fig. 6. As mentioned above, in the as-cast sample, there are some
Zr-rich regions in the center of equaxied grains of¡-Mg matrix.
In Mg alloys containing Zn, it has been found that Zn usually can combine with Zr to form some intermetallic compounds,
such as Zn2Zr3 and ZnZr2.16) When the alloy is
solution-treated at 400°C for 12 h, Zr atoms will diffuse from the Zr-rich zone to the neighbouring area to decrease the concen-tration gradient of Zr. During the process of heat treatment, the morphology of precipitates develops slowly from
point-like orflaky to block-like or petal-like. Strip precipitates with
the average size up to 100 nm in length and 20 nm in width are found in petal-like structures. Figure 6(a) shows the morphology of long-strip precipitates. Its composition was
determined by EDS to be about 4.6 at% Zn and 2.1 at% Zr,
from which the Zn/Zr ratio can be obtained as about 2.2.
Figure 6(b) shows the micro-area diffraction pattern from a
½112zone axis of precipitate. From thisfigure, the long-strip
precipitates can be determined as cubic Zn2Zr intermetallic
compound which is formed as the result of the adsorption of
Zn atoms on Zr-rich particles distributed throughout the ¡
-Mg matrix.17)
Figure 7 shows TEM images of the solution-treated Mg 4.3Zn0.7Y0.6Zr alloy at 500°C for 12 h. As shown in
Fig. 7(a), there are three types of precipitates in the structure; irregular block-like precipitates (marked A), long strip precipitates (marked B) and regular polygonal precipitates (marked C). The compositions of these different precipitates, determined by EDS, are shown in Table 2. From Table 2 we see that precipitate A is almost composed of element Mg. Figure 7(d) shows the selected area diffraction pattern of this
precipitate, which corresponds to a½1213zone axis of Mg.
Furthermore, the c/a ratio (about 1.6492) is near to that of
Mg (1.6235), so the precipitate is ¡-Mg slightly modified
with Zn. Figures 7(b) and 7(c) are high magnification images
for precipitates B and C, respectively. Twins are clearly visible in these HRTEM images. Figures 7(e) and 7(f ) are the microdiffraction patterns of precipitates B and C,
respec-tively. From Table 2 it can be seen that their Zn/Zr ratio is
about 2, and the crystal structure of B is cubic with lattice
parameter a=0.752 nm, very close to Zn2Zr (0.733 nm).
Moreover, the diffraction spots of precipitate C are similar to
B, indicating that C is also Zn2Zr.
3.3 Phase constituents of Mg4.3Zn0.7Y0.6Zr alloy
after solution treatment
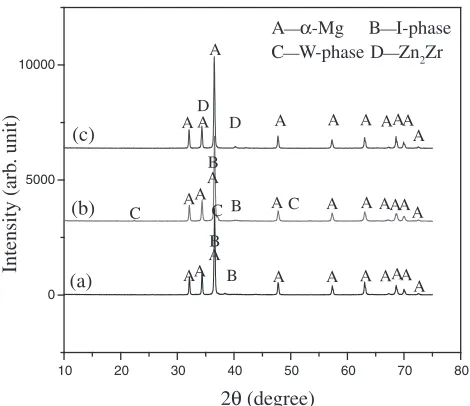
The X-ray diffraction patterns of three solution-treated alloys were shown in Fig. 8. It reveals that the main phase components of the solution-treated alloys at 300°C for 12 h,
400°C for 12 h and 500°C for 12 h are ¡-Mg+I-phase,
¡-Mg+I-phase+W-phase and ¡-Mg+Zn2Zr phase,
respectively. When the solution treatment temperature is 300°C, the quasicrystal phase exhibits good stability due to the low heat treatment temperature, so the microstructure is
still consisted of¡-Mg and I-phase. With the increase of heat
treatment temperature, the ability of atomic diffusion will be strengthened, which results in that some atoms in grain boundaries will diffuse into the grain. Zn and Y elements are enriched in grain boundary originally, and the diffusion ratio of Y is relatively low. Therefore, I-phase with high Zn content may transform into W-phase with low Zn content in grain boundary after water-quenching. From Fig. 6, it
also indicates that the Zn2Zr phase does exist in the matrix,
[image:4.595.100.495.69.176.2]Fig. 6 (a) TEM bright-field diffraction contrast image after solution treated at 400°C for 12 h; (b) micro-area diffraction from a½112zone axes of precipitate revealing the presence of the Zn2Zr phase.
Table 2 Composition of precipitates measured by EDS in the 500°C for 12 h solution-treated samples.
[image:4.595.48.290.217.338.2] [image:4.595.305.548.240.293.2]but it cannot be detected due to the very low content. Therefore, the microstructures of solution treated alloy at
400°C are composed of ¡-Mg, I-phase, W-phase and Zn2Zr
phase.
When the solution treatment temperature rises to 500°C which exceeds the melting point of eutectic phase (about 440
to 450°C18)), the phases in the eutectic pockets begin to
transform and quasicrystal phase disappears. According to the phase diagram, the limit solid solubility of Zn and Y in
Mg are about 6.2 and 11 mass%, respectively. Meanwhile, the
Zn content is about 6 times as much as the Y content in the grain boundary. So after solution treated at 500°C for 12 h, Y
atoms almost dissolved into the matrix to form the solid solution with Mg. However, because Zn cannot completely dissolve into the matrix, Zn and Zr will enrich in somewhere to form new phases. At the same time, small amount of Zn
and matrix Mg will form the new phase of Mg0.97Zn0.03, but
it cannot be detected within the sensitivity limits of XRD due to its low content. Therefore, the phase constituents for
the solution-treated sample with 500°C for 12 h were¡-Mg,
Zn2Zr and Mg0.97Zn0.03.
4. Conclusions
In this paper, the microstructure development during the
solution heat treatment of a Mg4.3Zn0.7Y0.6Zr (mass%)
alloy from 300 to 500°C with 12 h is investigated. The effect of solution heat treatment on phase constituents and precipitate morphology under various heat treatment con-ditions are discussed. The microstructures of the as-cast Mg4.3Zn0.7Y0.6Zr alloy are composed of the I-phase
and the¡-Mg phase. A substantial increase in grain size from
38.55 µm (as-cast state) to 57.45 µm (solution-treated at 500°C for 12 h) was observed. With the increase of solution treatment temperature, the phase constituents of the Mg
4.3Zn0.7Y0.6Zr alloy begin to transform from ¡-Mg+
I-phase (as-cast and solution treatment at 300°C for 12 h)
to ¡-Mg+I-phase+W-phase+Zn2Zr (solution treatment
at 400°C for 12 h) to¡-Mg+Zn2Zr+Mg0.97Zn0.03(solution
treatment at 500°C for 12 h). During the process of solution treatment, the morphology of precipitates changed from
point-like or flocky (300°C for 12 h) to block-like or
petal-like (400°C for 12 h) to petal-petal-like (500°C for 12 h). It has also
been found that the long strip Zn2Zr phase appears in the
petal-like microstructures after solution-treated at 400°C for 12 h and 500°C for 12 h.
Fig. 7 (a) TEM bright-field diffraction contrast image after solution treated at 500°C for 12 h; (b) (c) are high-magnification images of the precipitate B and C; (d) the selected area diffraction from a½0110zone axes of precipitate A; (e) and (f ) are the diffraction spots of precipitate B and C, respectively.
10 20 30 40 50 60 70 80
0 5000 10000
C C
B
B
A A A
AA A A AAAA
A A A
A A
A A A
A B
D A
A A
AA A A A A
Intensity (arb
. unit)
2θ (degree)
A⎯α-Mg B⎯I-phase C⎯W-phase D⎯Zn2Zr A
D
(a) (b) (c)
B
C
[image:5.595.110.484.69.315.2] [image:5.595.53.288.384.587.2]1) R. F. Decker: Adv. Mater. Process.9(1998) 3133.
2) D. Eliezer, E. Aghion and F. H. Froes:Adv. Perfor. Mater.5(1998) 201212.
3) G. Shao, V. Varsani and Z. Fan:CALPHAD30(2006) 286295.
4) F. S. Pierce, S. J. Poon and Q. Guo:Science261(1993) 737739.
5) D. K. Xu, L. Liu, Y. B. Xu and E. H. Han:Acta Mater.56(2008) 985 994.
6) D. H. Bae, S. H. Kim, D. H. Kim and W. T. Kim:Acta Mater.50(2002) 23432356.
7) A. Singh, M. Nakamura, M. Watanabe, A. Kato and A. P. Tsai:Scr.
14) J. P. Lu, T. Odagaki and J. L. Birman:Phys. Rev. B33(1986) 4809 4817.
15) D. K. Xu, L. Liu, Y. B. Xu and E. H. Han:Scr. Mater.57(2007) 285 288.
16) Y. Tamura, N. Kono, T. Motegi and E. Sato:J. Japan Inst. Light Metals
48(1998) 185189.
17) D. Shepelev, M. Bamberger and A. Katsman:J. Mater. Sci.44(2009) 56275635.