cleavage stress for the prismatic plane was determined to be approximately 460 MPa. A crystal that was oriented favorably for gliding on the basal plane exhibited a critical resolved shear stress of approximately 9.4 MPa. When a crystal was loaded along [0001], a sudden load drop was observed at a stress of approximately 250 MPa in the initial linear region of the stressstrain relation. Transmission electron microscopy results after the load drop showed that the deformation microstructure contained a twin-like boundary with a rotation axis along½1120.
[doi:10.2320/matertrans.MH201415]
(Received January 30, 2015; Accepted March 25, 2015; Published May 8, 2015)
Keywords: microtension testing, magnesium alloys, plastic deformation, slip, twinning
1. Introduction
The MgZnY alloy is a promising candidate for practical use as a light-weight structural material. The alloy is composed of an ¡-Mg phase and a long-period stacking ordered (LPSO) structured phase, which exhibits excellent mechanical properties. The kink bands formed by hot extrusion in the LPSO phase are thought to play an important role in the strengthening mechanisms of the alloy.12) However, the details of the deformation process in the LPSO phase have not yet been identified using single crystals. This is because the characteristic size of the LPSO phase is usually in the micrometer range. Even when a directionally solidified Mg85Zn6Y9 alloy is used, which consists of a nearly full LPSO phase, the thickness of the plate is of no more than a few hundred micrometers. For this reason, it is rather difficult to measure the mechanical properties of only the LPSO phase single crystals using conventional mechanical testing tech-niques.
Micro-mechanical characterization techniques are being widely developed.3) If specimen size can be reduced to the scale of the LPSO phase, i.e., several tens of micrometers, then the crystallographic orientation dependence of the plasticity in the LPSO phase can be revealed. A micro-compression-based study by Inoue et al. revealed a strong size dependence in the yield stress values when the crystals are loaded along ½24 12 12 1 and ½2110.4) However, microcompression testing overestimates the flow stresses owing to the deformation constraint of lateral fixation of a sample.5) In addition, this method is not appropriate for observing the fracture process. We recently applied micro-tension testing to the analysis of the mechanical aspects of several alloys.69)It was also reported that no significant size effect does appear in tensile testing using micrometer-sized
specimens with a characteristic size larger than³10 µm.10,11) In this study, we conducted microtension tests on 18R-LPSO phase single crystalline specimens with different crystallo-graphic orientations, which were prepared using a direction-ally solidified Mg85Zn6Y9 alloy, in order to identify their orientation-dependent plasticity.
2. Material and Methods
The material used in this study was a directionally solidified Mg84.8Zn6.4Y8.8 (at%) alloy (hereafter referred to as the Mg85Zn6Y9 alloy) that was produced using the Bridgman method. Crystals were grown at a rate of 0.5 mm min¹1 under Ar atmospheric conditions in a furnace at a temperature of 1073 K. The microstructure contained 18R-LPSO phase plates that were approximately 70 µm thick and a few millimeters long. It was reported that these plates were grown along the basal plane.1) A sample with a thickness of approximately 2 mm was mechanically cut from the alloy and thinned to a thickness of tens of micrometers through grinding with emery paper and diamond paste. For electron back scatter diffraction (EBSD) analysis, the surface was polished using a cross-section polisher. A JEOL field emission gun scanning electron microscope with an EBSD analyzer was used. The crystal orientation was determined by automatic beam scanning, using a step size of 1 µm at an accelerating voltage of 15 kV. EBSD analysis was carried out using TexSEM Laboratories orientation imaging microscopy (OIM) software (v. 7.0.1). Specimens with a gauge section of 20 µm©20 µm©50 µm were fabricated using a focused ion beam (FIB). Four specimens with different misorientation angles between the loading direction (LD) and the [0001] direction were prepared: 89° for the specimen A, 42° for the specimen B, 7° for the specimen C, and 4° for the specimen C1. Figure 1 shows the stereographic projections of the specimens A, B, C, and C1. A tensile test using a micro-gluing grip was performed at a crosshead speed of 0.1 µm s¹1, equivalent to a strain rate of 2©10¹3s¹1, at +1Corresponding author, E-mail: mine@msre.kumamoto-u.ac.jp
+2Present address: Mitsubishi Heavy Industries, Ltd., Nagoya 455-8515,
room temperature in laboratory atmospheric conditions. The gauge section of the tensile specimen was monitored during tensile testing using an optical microscope in order to dynamically measure the strain as a function of time. The transmission electron microscopy (TEM) sample was pre-pared from the deformation microstructure in the speci-men C1 using an FIB. The TEM observations were performed with a JEOL JEM-2000FX system operated at an accelerating voltage of 200 kV.
[image:2.595.54.285.67.293.2]3. Results and Discussion
Figure 2 shows the stressstrain (·¾) curves of the specimens A, B and C. Orientation-dependent ·¾ curves were obtained for the LPSO phase specimens. The specimen A exhibited a linear relation between·and¾until it approached the ultimate tensile strength of·Bµ480 MPa. By contrast, in the case of the specimen B, the ·¾ plot
deviated from a linear relation at an extremely low stress of 20 MPa. The specimen B was deformable at low applied stresses and exhibited a rather large elongation to failure of ¾fµ110%. In the case of the specimen C, a sudden load drop occurred at a flow stress of approximately 250 MPa, concurrent with the occurrence of a large bend in the specimen, as noted below. Beyond this point, it was not possible to track the strain of the gauge section using the optical microscope. Figure 3 shows the flow stress as a function of displacement, instead of the strain for the specimens C and C1. After the sudden load drop, the flow stress exhibited a steep increase up to approximately 80 MPa with increasing displacement at which point it was maintained at this constant value. In the case of the specimen C1, the microtension test was interrupted immedi-ately after the load drop.
Figure 4 shows the deformation process during tensile loading and fracture morphologies of the specimen A. When the stress reached·B, cracking was initiated (Fig. 4(b)). After this initial cracking, another crack began to grow on the other side of the sample, eventually resulting in the final fracture (Fig. 4(c)). It can be seen from Fig. 4(d) that the fracture surface was composed of regularly oriented facets, which corresponded to the ð1100Þ and ð0110Þ prismatic planes. The cleavage fracture stress for the prismatic plane was determined to be approximately 460 MPa. The steps of the basal slip were also observed in the vicinity of the crack tips (Figs. 4(c) and (d)). It is reasonable that the basal slips that exhibited the lowest critical resolved shear stress (CRSS) were activated, owing to the stress singularity at the crack tip.
Figure 5 shows the fracture morphologies of the spec-imen B. After yielding occurred, slip steps corresponding to the basal plane appeared, as shown in Fig. 5(a). The CRSS for the basal slip was therefore determined to be approx-imately 9.4 MPa, which was slightly lower than the values of approximately 1030 MPa obtained by Hagiharaet al.1)The fractographic observations (Fig. 5(b)) and ·¾ plot (Fig. 1) indicate that the shear type fracture occurred in the specimen B through the mechanism of easy slip gliding.
Figure 6 shows the deformation process during tensile loading in the specimen C. As mentioned above, extensive
Fig. 1 Stereographic projections of the specimens (a) A, (b) B, (c) C, and (d) C1. LD and TD represent the loading and transverse directions, respectively.
Fig. 2 Stressstrain curves for the specimens A, B and C with different crystallographic orientations.
[image:2.595.315.532.71.245.2] [image:2.595.60.277.347.521.2]differences in the surface were observed after the sudden load drop shown in the·¾plot (Fig. 6(c)). A close examination shows us that a slip line corresponding to the basal plane appeared just prior to the load drop (Fig. 6(b)). After failure, the specimen was severely deformed owing to gliding on the basal plane. This may be attributed to the crystal rotation caused by the catastrophic structural change at the time when the sudden load drop occurred.
In order to investigate this phenomenon thoroughly, the tensile test was interrupted immediately after the load drop, and the deformation microstructure was examined using TEM. Figure 7 shows the deformation morphologies ob-tained using scanning electron microscopy (SEM) on the specimen C1. One end of the gauge section was bent, containing many slip steps due to gliding on the basal slip. The other end of gauge section was subject to cracking. In the surface of the side of the bent region, a deformation band and kink-like bands are visible (Fig. 7(c)). Figure 8 shows the
Fig. 5 Fracture morphologies of the specimen B.
Fig. 4 Deformation process during microtension testing and the fracture morphologies of the specimen A.
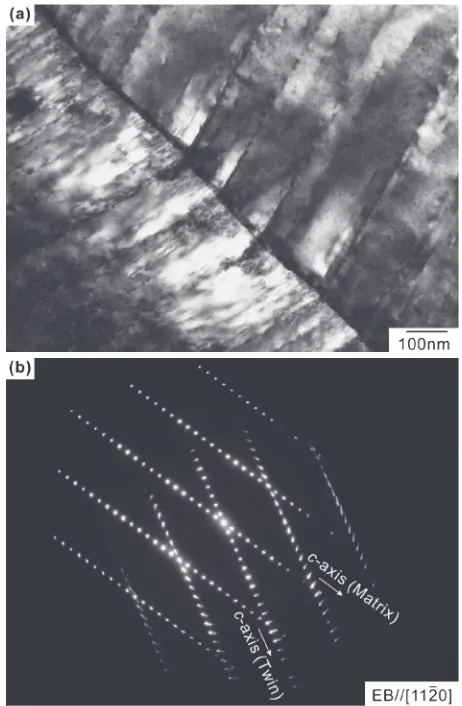
[image:3.595.55.283.67.517.2] [image:3.595.324.531.68.377.2] [image:3.595.324.529.403.771.2]TEM bright-field image and the½1120selected-area electron diffraction (SAED) pattern at the boundary between the deformation band and the matrix in the bent region of the specimen C1 (Fig. 7(a)). The traces of the basal slips in both the deformation band and the matrix were inclined at an angle of approximately 75° with respect to the boundary (Fig. 8(a)). The analysis of the SAED pattern (Fig. 8(b)) shows that the deformation band and the matrix regions, which are rotated approximately 30° about the ½1120axis, are mirrored with respect to the boundary plane of ð2209Þ. Kishidaet al.previously suggested that deformation twins on the habit planes close to f1129g are activated when
micro-pillars of a MgZnY LPSO phase similar to that used in the current study are subjected to compression.12)Although these habit planes differ from each other, these findings show that deformation twinning can occur in both tension and compression of the MgZnY 18R-LPSO phase. If it is assumed that the ð2209Þ ½9904 twinning (Schmid factor: 0.37 for the specimen C1) occurs in tension, the CRSS is determined to be 93 MPa. In contrast, in the specimen A, oriented with the basal plane nearly parallel to the tensile direction, the twinning was not activated but the cleavage cracking occurred on the prismatic planes. It is plausible that the f2209g twinning occurs only under compressive stress owing to the asymmetric feature of the shearing direction. On the other hand, it was observed that the basal slip preceded the catastrophic structural change in the specimen C (Fig. 6(b)). Thisfinding suggests that the occurrence of the basal slip may be a trigger for the twinning. The bent region also contained the kink-like bands (Fig. 7(c)). These are presumably formed to accommodate the plastic inconsistent accompanied with the twin formation.
4. Conclusion
The anisotropic plasticity of 18R-LPSO phase single crystals in an Mg85Zn6Y9 alloy was studied using
micro-Fig. 7 SEM images in the bent region of the specimen C1 observed immediately after the sudden load drop.
[image:4.595.311.542.69.422.2] [image:4.595.56.283.70.587.2]Acknowledgements
The authors are indebted to Mr. K. Fukutomi, Mr. K. Sakamoto, Dr. M. Tsushida and Dr. T. Yamamuro, Kumamoto University, for their assistance with the experiments. The present work was supported in part by a Grant-in-Aid for Scientific Research (B) 21360343 from the Japan Society for the Promotion of Science (JSPS), and in part by a Grant-in-Aid for Scientific Research on the Innovative Area‘Materials Science on Synchronized Long-Period Stacking Ordered
7) Y. Mine, K. Hirashita, M. Matsuda, M. Otsu and K. Takashima:Corros. Sci.53(2011) 529533.
8) Y. Mine, K. Hirashita, H. Takashima, M. Matsuda and K. Takashima:
Mater. Sci. Eng. A560(2013) 535544.
9) Y. Mine, H. Takashima, M. Matsuda and K. Takashima:Mater. Sci. Eng. A618(2014) 359367.
10) N. A. Fleck, G. M. Muller, M. F. Ashby and J. W. Hutchinson:Acta Metall. Mater.42(1994) 475487.
11) J. R. Greer, W. C. Oliver and W. D. Nix:Acta Mater.53(2005) 1821 1830.