Full Terms & Conditions of access and use can be found at
http://www.tandfonline.com/action/journalInformation?journalCode=idre20
Download by: [University of Nottingham] Date: 14 March 2017, At: 04:24
Disability and Rehabilitation
ISSN: 0963-8288 (Print) 1464-5165 (Online) Journal homepage: http://www.tandfonline.com/loi/idre20
Reliability and responsiveness of measures of
pain in people with osteoarthritis of the knee: a
psychometric evaluation
Katie V. Turner, Bryan M. Moreton, David A. Walsh & Nadina B. Lincoln
To cite this article:
Katie V. Turner, Bryan M. Moreton, David A. Walsh & Nadina B. Lincoln
(2017) Reliability and responsiveness of measures of pain in people with osteoarthritis of
the knee: a psychometric evaluation, Disability and Rehabilitation, 39:8, 822-829, DOI:
10.3109/09638288.2016.1161840
To link to this article: http://dx.doi.org/10.3109/09638288.2016.1161840
© 2015 The Author(s). Published by Informa UK Limited, trading as Taylor & Francis Group
Published online: 30 Mar 2016.
Submit your article to this journal Article views: 586
View related articles View Crossmark data
ASSESSMENT PROCEDURES
Reliability and responsiveness of measures of pain in people with osteoarthritis of
the knee: a psychometric evaluation
Katie V. Turner
,
Bryan M. Moreton
,
David A. Walsh
and
Nadina B. Lincoln
Arthritis Research UK Pain Centre, University of Nottingham, Nottingham, UK
ABSTRACT
Purpose: To examine the fit between data from the Short Form McGill Pain Questionnaire (SF-MPQ-2) and the Rasch model, and to explore the reliability and internal responsiveness of measures of pain in people with knee osteoarthritis. Methods: Participants with knee osteoarthritis completed the SF-MPQ-2, Intermittent and Constant Osteoarthritis Pain questionnaire (ICOAP) and painDETECT. Participants were sent the same questionnaires 3 and 6 months later.Results: Fit to the Rasch model was not achieved for the SF-MPQ-2 Total scale. The Continuous subscale yielded adequate fit statistics after splitting item 10 on uniform DIF for gender, and removing item 9. The Intermittent subscale fit the Rasch model after rescoring items. The Neuropathic subscale had relatively good fit to the model. Test–retest reliability was satisfactory for most scales using both original and Rasch scoring ranging from fair to substantial. Effect sizes ranged from 0.13 to 1.79 indicating good internal responsiveness for most scales.Conclusions: These findings sup-port the use of ICOAP subscales as reliable and responsive measure of pain in people with knee osteoarth-ritis. The MPQ-SF-2 subscales found to be acceptable alternatives.
äIMPLICATIONS FOR REHABILITATION
The McGill Pain Questionnaire short version 2 is not a unidimensional scale in people with knee osteo-arthritis, whereas three of the subscales are unidimensional.
The McGill Pain Questionnaire short version 2 Affective subscale does not have good measurement properties for people with knee osteoarthritis.
The McGill Pain Questionnaire short version 2 and the Intermittent and Constant Osteoarthritis Pain scales can be used to assess change over time.
The painDETECT performs better as a screening measure than as an outcome measure.
ARTICLE HISTORY Received 28 July 2015 Revised 8 February 2016 Accepted 1 March 2016
KEYWORDS ICOAP; McGill pain questionnaire; Rasch; test–retest
Introduction
Measures of pain have been developed to assess pain characteris-tics and severity in people with osteoarthritis (OA). Pain question-naires aim to measure the overall severity of pain or the severity or nature of specific dimensions of the pain experience. Overall pain severity is quantified by combining responses to questions that target specific dimension of the pain experience. Ideally ques-tionnaires should demonstrate unidimensionality and combining several dimensions into a single scale can affect the validity of the scale.[1] The scale may not measure the single construct intended but be an amalgamation of measures of several constructs.
The Intermittent and Constant Osteoarthritis Pain (ICOAP) ques-tionnaire was developed to assess two kinds of OA pain [2] based on the aspects of pain that were identified as distinct and important by focus groups of people with OA.[3] Constant pain was characterized as a continuous aching sensation, and intermittent pain was described as being severe but transient. It has been proposed that a total score may be a useful measure of overall pain severity in OA.[2] Moreton et al. [4] reported that the Constant and Intermittent sub-scales of the ICOAP fit the Rasch model following removal of a few items, but raised some concerns over the external validity of the
Total score and recommended that the Constant and Intermittent subscales were used rather than the Total scale. Davis et al. [5] dem-onstrated the responsiveness of the ICOAP to the effect of surgery in people receiving total hip or total knee replacement. Singh et al. [6] demonstrated test–retest reliability in patients with a diagnosis of OA at baseline and 2-week follow-up, and found that the ICOAP was more reliable in patients with hip compared to knee OA.
The Revised Short Form McGill Pain Questionnaire Short Form (revised SF-MPQ) [7] assesses the quality of the pain experience, based on descriptive characteristics. It assesses both neuropathic and non-neuropathic pain in four dimensions, continuous, intermit-tent, neuropathic and affective descriptors. Strand et al. [8] investi-gated the reliability and responsiveness of the Norwegian version of the SF-MPQ (NSF-MPQ) in patients with musculoskeletal and rheumatic pain and found that test–retest reliability and respon-siveness of the NSF-MPQ were satisfactory but reported that the measurement properties varied between groups of patients with pain. Grafton et al. [9] reported good reliability for the McGill Pain Questionnaire in people with osteoarthritis of the hip and knee, but did not examine responsiveness.
The painDETECT [10] was developed to help guide diagnosis of neuropathic pain but has also been used to measure
CONTACTProfessor Nadina Lincoln nadina.lincoln@nottingham.ac.uk Division of Rehabilitation and Ageing, School of Medicine, B127a Medical School, Queens Medical Centre, Nottingham NG7 2UH, UK
ß2016 The Author(s). Published by Informa UK Limited, trading as Taylor & Francis Group
This is an Open Access article distributed under the terms of the Creative Commons Attribution License (http://creativecommons.org/Licenses/by/4.0/), which permits unrestricted use, distribu-tion, and reproduction in any medium, provided the original work is properly cited.
VOL. 39, NO. 8, 822–829
neuropathic-like symptoms.[11,12] The painDETECT classifies peo-ple into groups based on a summative score from nine items. Moreton et al. [13] conducted Rasch analysis on scores from peo-ple with osteoarthritis of the knee and showed that the painDETECT displayed good fit to the Rasch model and was rela-tively well targeted to the sample.
If measures are to be used to assess the effectiveness of inter-ventions, they need to be reliable over time if no change has occurred, yet sensitive to the effects of the intervention. These attributes need to be checked in the target population to optimize the ability to use the scales as outcome measures. Rasch analysis has been used to improve the measurement properties of com-monly used measures of pain.[4,13] One potential advantage of Rasch converted scores is that they are expected to increase the ability to detect change over time.
The aims of the study were:
1. To examine the fit between data obtained from the Short Form McGill Pain Questionnaire version 2 (SF-MPQ-2) and the Rasch model.
2. To measure the reliability and internal responsiveness of Rasch analyzed versions of measures of pain in comparison with standard versions in people with knee osteoarthritis.
Methods
Participants were recruited from a group of patients who took part in previous studies at the University of Nottingham and agreed to be contacted about future research, clinics at Nottingham University Hospitals, Sherwood Forest Hospitals and Derby Hospitals NHS Trusts, General Practitioner (GP) surgeries in the local area and from patients on the Nottinghamshire county OA hip and knee pathway. Participants were included in the study if they had a clinical diagnosis of knee OA, confirmed by a Kellgren–Lawrence grade2, and reported accompanying pain on most days for at least the past month. Participants with another diagnosed arthritic disorder (e.g., rheumatoid arthritis, psoriatic arthritis, gout, fibromyalgia), people who had knee joint surgery in the three months prior to participation, and those who could not speak or understand English were excluded.
Informed consent was obtained from all participants and the research was approved by Nottingham Research Ethics Committee 1 (10/H0403/70).
Participants were sent an invitation letter signed by either a medical professional responsible for their care (e.g., consultant sur-geon, GP, physiotherapist) or the chief investigator of the study they previously took part in. The letter included an information sheet, a consent form, a questionnaire set and a pre-paid reply envelope. Some personal information was recorded from the par-ticipants (e.g., name, address, telephone number) so that they could be contacted. The questionnaires were presented in one of four orders, which were randomly determined, to protect against order effects.
For each participant, the following demographic and clinical information were collected: age, gender, ethnicity, occupation, education, marital status, symptom duration and any other medical treatments they were receiving.
Participants were assessed using the ICOAP,[2] which has 11 items in two subscales. Five items address constant pain and six items deal with intermittent pain. Responses are recorded using a five-point scale. Ten items are phrased to assess the intensity of pain (e.g., How intense has your constant knee pain been?). The response options for these items are 0 (Not at all), 1 (Mildly), 2 (Moderately), 3 (Severely) or 4 (Extremely). Item 7 asks patients about the frequency of pain (How frequently has this knee pain
that comes and goes occurred?). The response options for this item are 0 (Never), 1 (Rarely), 2 (Sometimes), 3 (Often) or 4 (Very often). The raw score for the Constant Pain and Intermittent Pain subscales were transformed into Rasch scores based on the con-versions reported by Moreton et al.[4]
The Short Form McGill Pain Questionnaire 2 (MPQ-SF-2) [14] is comprised of 22 pain descriptors. It has four subscales (con-tinuous pain, intermittent pain, neuropathic pain and affective descriptors) with mean scores of the items ranging from 0 to 10. All items can also be summed to produce a mean total pain score (range 0–10). Respondents rate the intensity of their pain over the past week, using a numerical rating scale from 0 (none) to 10 (worst possible).
ThepainDETECT questionnaire [10] was designed to assess the
neuropathic elements of pain, and classifies people into groups based on a summative score from nine-items: a neuropathic com-ponent is unlikely (12), result is ambiguous (13–18) and neuro-pathic component is likely (19). Most items use a 6-point scale where higher scores are suggestive of greater intensity (where 0¼never and 5¼very strongly). Two items assess the temporal and spatial aspects of pain, using categorical response formats. The raw painDETECT score was transformed into a Rasch score derived from the Rasch analysis conducted and reported by Moreton et al.[13]
As participants were provided with a lengthy set of question-naires they were advised to complete as many as they felt able to. Names and telephone numbers were requested so that it was pos-sible to contact participants if required. Some demographic infor-mation (age, gender) was also collected. The questionnaires were completed at home and returned to the researchers by pre-paid envelope. Non-respondents were sent one reminder letter after 3 weeks.
Participants were invited to indicate on their consent form their willingness to complete three and six month follow-up question-naires to examine change over time. Follow-up questionquestion-naires were sent to the home addresses of all those who consented. Participants were asked if they had undergone partial or full knee replacement surgery for one or both knees.
Five separate analyzes were carried out on the total pain scale and the continuous pain, intermittent pain, neuropathic pain and affective descriptor subscales of the SF-MPQ-2 using RUMM2020.[15]
Rasch analysis assesses fit between data obtained on a scale and the predictions of the Rasch model.[16] This was under-taken because the model shows whether a scale meets the axi-oms underlying additive conjoint measurement (1). To determine whether the rating scale [17] or the partial credit formulation [18] of the Rasch model was most appropriate, a likelihood ratio test was performed for each analysis. If the test was not signifi-cant (i.e., p>0.05), then the rating scale version was adopted; otherwise the partial credit version was used. Individual items were inspected to see whether there was evidence of disor-dered response thresholds.[1,16] When this was observed, the item was rescored (i.e., collapsing appropriate adjacent response options).
Mean and standard deviation fit residuals were calculated for the items and the persons. The means should be close to 0 and the standard deviations (SD) about 1. RUMM2020 creates groups, called class intervals, based on the level of examined trait. An item-trait interaction chi-squared was used to test whether the hierarchical arrangement of the items was invariant across the class intervals andpvalues>0.05 were considered acceptable.[16] A person separation index (PSI) value of0.7 indicated acceptable internal consistency.[19]
Each individual item and person was examined for misfit. For items, chi-squared and Analysis of Variance (ANOVA) fit statistics were calculated with a Bonferroni correction. Fit residuals were also examined for items and persons. Values aboveþ2.5 or below2.5 were considered to be misfitting the model.[16] Differential Item Functioning (DIF) was explored for gender (men and women) and age (<64 years, 64–71 years and>71 years). Response dependencies between items were identified from the residual correlation matrix. A positive correlation of0.3 was con-sidered to be indicative of response dependency for scales with 20 items or more. Each scale was tested for a breach of unidimension-ality [1] and Principal components analysis was performed on the residuals and used to identify two subsets of items; those loading positively and negatively on the first component. Person estimates were then calculated for each subset and then a series of independ-ent t-tests were carried out to see whether the subsets produced significantly different estimates. Assuming that both subsets were measuring the same unidimensional construct no more than 5% of theset-tests should be significant at a 0.05 level. A binomial confidence interval (CI) was applied for cases that were more than 5%.
Sample size calculations for the study were based on Rasch analysis. Approximately 150 participants were required to have at least 95% confidence that item calibrations were within60.5 logits.[20]
Test–retest reliability of all measures was established by com-paring questionnaire scores obtained at baseline (T1) and 3 months (T2) in those who had not had knee surgery. This was ini-tially calculated using raw questionnaire scores. Rasch conversion scores derived from Moreton et al. [4] were then applied to ICOAP Intermittent and Constant subscale scores and from Moreton et al. [13] for thepainDETECT Total score. Test–retest reliability was cal-culated through the Intraclass Correlation Co-efficient (ICC), using a two-way mixed model of absolute agreement.[21] Pearson’s correl-ation coefficients were also calculated to determine the level of linear association between questionnaire scores at T1 and T2. Values were interpreted as follows:>0.80 was excellent, 0.61–0.80 was substantial, 0.41–0.60 was moderate, 0.21–0.40 was fair and<0.21 was slight.[22]
For responsiveness, the Intraclass Correlation Co-efficient (ICC) was calculated between T1 and T3 for those known to have had knee surgery. Cohen’s d was calculated as a measure of effect size using an online calculator (http://www.cognitiveflexi-bility.org/effectsize), whereby the mean and standard deviation of T1 and T3 point were included, and the value was corrected by the correlation coefficient between the two time points.[23]
Results
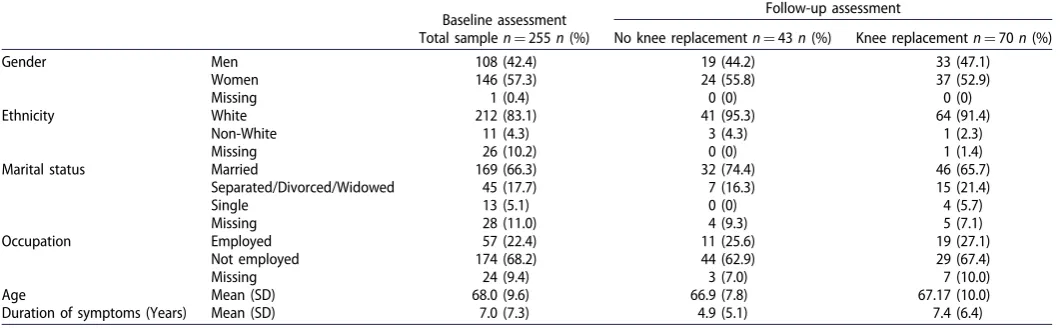
Of the 1359 people with OA invited to take part, 255 (18.8%) pro-vided data for analysis. Participant characteristics are shown in Table 1. Follow-up questionnaires were returned by 113 (44%) participants. Of these, 43 (38%) had no knee replacement (NKR Sample) and 70 (62%) had had a knee replacement within the dur-ation of the study (KR Sample). The two groups were similar on most demographic characteristics, however the KR sample had experienced OA symptoms for significantly longer (mean¼7.4 years) than the NKR sample (mean¼4.9 years) (U (106)¼934.5, Z¼ 2.79,p¼.005).
Descriptive statistics are presented for each scale at baseline, 3 months and 6 months inTable 2.
Rasch analysis of the SF-MPQ 2
On the total scale of the SF-MPQ 2, initial fit to the model indi-cated some misfit. Results are shown inTable 3. Item 11 misfit the model and a number of participants also misfit the model with a mixture of high positive and negative fit residuals. Items 2 and 3, 2 and 4, 3 and 4, 10 and 19 and 21 and 22 exhibited evidence of response dependency. There was no evidence of differential item functioning (DIF) for age or gender. The scale failed the test of uni-dimensionality and all items had disordered response thresholds. A variety of global rescoring options were explored but there was misfit and the revised scale was mistargeted. Therefore, the sub-scales were examined.
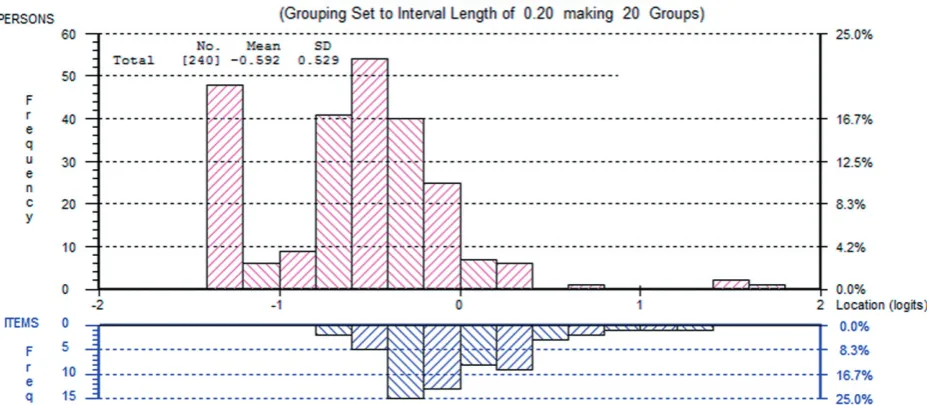
[image:4.609.41.573.65.229.2]On the Continuous subscale, the likelihood ratio test was sig-nificant and so the partial credit model was used. The initial sum-mary fit statistics indicated some misfit between data and the model (Table 3). Items 8 and 9 misfit the model and five partici-pants presented with high negative fit residuals. There was no evi-dence of response dependency, but item 10 presented with uniform DIF for gender. The subscale passed the test of unidimen-sionality. All items had disordered thresholds. A variety of global rescoring options were explored. Rescoring all items 01111122223 resolved the disordered thresholds and improved fit to the model. Following this, 10 participants had high absolute fit residual values and item 10 continued to exhibit DIF for gender. Removal of the misfitting participants did not have a large effect on fit to the model and so they were retained. Item 10 was split for DIF but then item 9 exhibited misfit the model. Removal of item 9 resulted in good fit with no remaining measurement issues. The revised subscale was slightly mistargeted with participants, on average, exhibiting a lower level of continuous pain than measured by
Table 1.Demographic characteristics of participants.
Baseline assessment Follow-up assessment
Total samplen¼255n(%) No knee replacementn¼43n(%) Knee replacementn¼70n(%)
Gender Men 108 (42.4) 19 (44.2) 33 (47.1)
Women 146 (57.3) 24 (55.8) 37 (52.9)
Missing 1 (0.4) 0 (0) 0 (0)
Ethnicity White 212 (83.1) 41 (95.3) 64 (91.4)
Non-White 11 (4.3) 3 (4.3) 1 (2.3)
Missing 26 (10.2) 0 (0) 1 (1.4)
Marital status Married 169 (66.3) 32 (74.4) 46 (65.7)
Separated/Divorced/Widowed 45 (17.7) 7 (16.3) 15 (21.4)
Single 13 (5.1) 0 (0) 4 (5.7)
Missing 28 (11.0) 4 (9.3) 5 (7.1)
Occupation Employed 57 (22.4) 11 (25.6) 19 (27.1)
Not employed 174 (68.2) 44 (62.9) 29 (67.4)
Missing 24 (9.4) 3 (7.0) 7 (10.0)
Age Mean (SD) 68.0 (9.6) 66.9 (7.8) 67.17 (10.0)
items on the scale. Results are shown inFigure 1. Rasch conversion scores are provided in Appendix.
On the Intermittent subscale, the initial summary fit statistics indicated some misfit between data and the model (Table 3). Items 2 and 3 misfit as did a number of participants with high negative fit residuals. There was no response dependency or DIF for age or gender. The scale passed the test of unidimensionality, but all thresholds were disordered. A variety of global rescoring options were explored. Rescoring all items 01111122223 resolved the disordered thresholds and improved fit to the model. Following this, nine participants misfit. However, their removal made fit to the model slightly worse and so they were retained. The rescored subscale was slightly mistargeted with the participants, on average, at a lower level of intermittent pain than measured by the items on the subscale. Results are shown in
Figures 1–3.
Rasch conversion scores are provided inAppendix.
On the Neuropathic subscale, initial fit to the model was rela-tively good (Table 3). There were no misfitting items, but a few
[image:5.609.39.571.62.293.2]participants with high negative fit residuals. There was no evi-dence of response dependency, but item 22 presented with non-uniform DIF for gender. The scale passed the test of unidimension-ality, but all items had disordered response thresholds. A variety of global rescoring options were explored. Rescoring all items 00000011111 resulted in improved fit to the model (v2¼15.87, df¼6,p¼0.01). However, the subscale was now dichotomous and there were large floor effects. Given that fit was already adequate, it was decided to explore the effects of further analysis without rescoring the items. Removal of the misfitting persons did not have a substantial effect on the fit statistics and so they were retained. As the DIF observed for item 22 was non-uniform, it was not possible to split it for DIF. While no other items exhibited sig-nificant DIF, examination of the item characteristics curves indi-cated that item 17 may exhibit an opposite, albeit not significant, pattern of DIF. Grouping these items into a subtest cancelled out the DIF, suggesting that it would not be a problem at the test level. Therefore, no remedial action was taken. The subscale was slightly mistargeted with participants, on average, at a lower level
Table 3.Summary fit statistics for Rasch analysis of SF-MPQ 2.
Analysis
Mean (SD) item fit residual
Mean (SD) person fit
residual Chi-squared (DF) p
Person separation Index
% of significantt-tests (95% CI)
Ideal values 0 (1) 0 (1) >0.05 0.70 <5%
MPQ total
Initial fit 0.17 (1.14) 0.38 (1.50) 89.03 (66) 0.03 0.92 10.2 (7.4–13.0)
Rescoring items 0.78 (0.91) 0.85 (1.76) 88.73 (66) 0.03 0.89 6.0 (3.2–8.8)
Remove misfitting participants 0.30 (0.97) 0.40 (1.15) 65.72 (66) 0.49 0.89 7.3 (4.2–10.4) Subtesting items 2–3–4 and 21–22 0.12 (2.23) 0.29 (1.16) 102.29 (57) <0.001 0.88 7.0 (4.0–10.0)
Remove subtests 0.27 (1.11) 0.37 (1.03) 66.93 (51) 0.07 0.87 5.5 (2.4–8.5)
MPQ continuous
Initial fit 0.37 (0.84) 0.34 (1.20) 35.96 (18) 0.007 0.83 1.8
Rescoring items 0.29 (0.95) 0.43 (1.23) 23.05 (18) 0.19 0.78 1.8
Split item 10 for DIF and remove item 9 0.27 (0.67) 0.37 (1.07) 19.36 (18) 0.37 0.74 * MPQ intermittent
Initial fit 0.13 (0.70) 0.49 (1.23) 40.51 (18) 0.002 0.87 3.8
Rescoring items 0.06 (1.04) 0.53 (1.17) 20.79 (18) 0.29 0.84 5.2 (2.2–8.1)
MPQ neuropathic
Initial fit 0.53 (0.74) 0.42 (1.07) 26.90 (18) .08 0.86 1.7
MPQ affective
Initial fit 0.43 (1.06) 0.48 (1.06) 25.77 (12) .01 0.85 1.1
Remove item 15 0.31 (0.34) 0.42 (0.89) 19.67 (9) .02 0.78 1.1
*Not Possible to t run the test of unidimensionality at this stage because of item split. Table 2.Descriptive statistics for measures of pain.
No knee replacement standard scoring
No knee replacement Rasch converted
Knee replacement standard scoring
Knee replacement Rasch converted
n Mean SD n Mean SD n Mean SD n Mean SD
Baseline ICOAP C 42 32.4 23.4 42 7.4 4.1 69 57.6 23.6 69 10.1 3.7
ICOAP I 42 44.9 20.2 42 7.4 3.1 66 61.2 20.2 66 9.5 3.2
MPQ C 37 3.4 2.2 37 5.6 2.5 64 4.5 2.4 64 6.5 2.5
MPQ I 32 2.9 2.6 32 5.4 3.6 59 4.3 2.4 59 7.4 3.0
MPQ N 36 1.3 1.4 36 10.1 6.3 63 2.0 2.6 63 11.2 8.3
MPQ A 37 1.4 1.9 66 1.8 2.1
PD T 39 10.3 6.6 40 10.2 3.5 67 14.2 6.9 67 12.2 3.2
3 Months ICOAP C 40 34.8 23.1 40 6.6 3.9 66 41.8 30.5 66 7.2 5.0
ICOAP I 39 42.8 19.2 39 7.0 2.9 65 42.4 10.1 66 6.7 4.7
MPQ C 36 2.8 1.9 41 4.7 2.4 63 3.5 2.9 66 5.2 3.1
MPQ I 34 2.8 2.3 34 5.2 3.3 59 3.0 3.1 59 5.6 4.5
MPQ N 36 1.2 1.3 36 9.7 6.3 63 2.4 2.9 63 14.6 9.0
MPQ A 37 1.2 1.6 63 2.6 2.4
PD T 39 10.3 6.5 40 10.0 3.4 60 14.6 7.4 64 12.1 4.5
6 Months ICOAP C 32 30.4 22.8 33 6.0 4.1 51 19.7 23.3 51 3.5 4.0
ICOAP I 33 37.9 17.9 33 6.5 2.6 50 27.2 25.1 50 4.4 3.9
MPQ C 32 2.2 1.6 33 4.1 1.7 49 2.4 2.0 53 3.4 2.7
MPQ I 31 2.3 2.1 31 4.7 3.1 50 1.5 1.7 50 3.6 2.8
MPQ N 32 0.7 1.0 32 7.0 5.9 48 1.2 2.0 48 10.1 6.4
MPQ A 32 1.0 1.8 50 1.4 1.5
PD T 30 9.3 4.5 31 9.9 2.5 37 12.5 6.4 50 10.8 3.1
[image:5.609.41.575.315.510.2]Figure 1. Person item thresholds for subscales of the McGill pain questionnaire – continuous scale.
Figure 2. Person item thresholds for subscales of the McGill pain questionnaire – intermittent scale.
[image:6.609.74.538.544.746.2]of neuropathic pain than measured by items on the subscale. Results are shown in Figure 1. Rasch conversion scores are pro-vided in Appendix.
On the Affective subscale, the initial summary fit statistics indi-cated some misfit between data and the model (Table 3). Item 15 misfit and five participants had high negative fit residuals. There was no evidence of response dependency or DIF for age or gen-der. The scale passed the test of unidimensionality, but all items had disordered response thresholds. A variety of global rescoring options were explored. None of the rescoring options resolved all of the disordered response thresholds and improved overall fit. Therefore, the items were left with disordered thresholds. Removal of the misfitting participants also did not improve fit to the model and so they were retained. Therefore, conversion values are not provided.
Test–retest reliability
Test–retest reliability was assessed between baseline and 3 months later in participants who did not undergo knee replacement sur-gery. Based on the ICC on the standard scoring, the test–retest reliability of measures for the total sample ranged from fair to moderate. Results are shown inTable 4. The ICOAP Constant sub-scale and MPQ Intermittent subsub-scale had substantial test–retest reliability and the MPQ Neuropathic subscale fair reliability.
Rasch conversion scores were applied to all data, apart from the MPQ Affective scale as this scale did not satisfactorily fit the Rasch model. Descriptive statistics for the Rasch converted scores are presented inTable 2. Overall, ICC values were similar to those of the standard scoring (Table 4) and ranged from fair to moder-ate. In terms of bivariate correlations, most correlation coefficients were lower when Rasch conversions were applied (Table 4).
Responsiveness to change
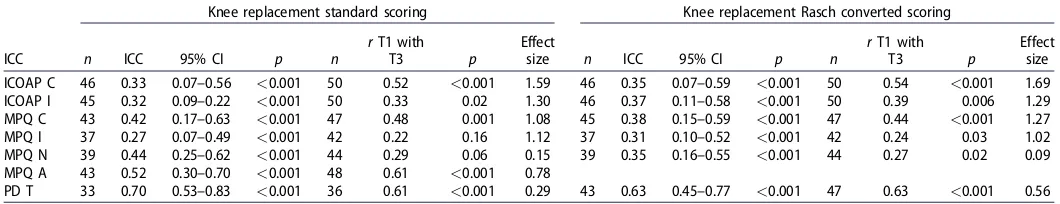
Responsiveness to change was evaluated between baseline and 6 months later in those who had had a knee replacement. When using the standard scoring, ICC’s ranged from 0.27 to 0.70 (Table 5), Bivariate correlations ranged from 0.22 to 0.61.
Using Rasch transformed scores, the ICCs and bivariate correlations were similar (ICC 0.24–0.63,r¼0.24–0.63). Effect sizes between T1 and T3 ranged from small (dz¼0.09) to large (dz¼1.69).
Discussion
Rasch analysis of the MPQ-SF2 did not support the unidimension-ality of the total scale but did support the unidimensionunidimension-ality of three of the four subscales; continuous, intermittent and neuro-pathic. The affective subscale did not fit the Rasch model, and these items could probably be removed, as they do not assess a unidimensional construct. Alternative measures of the affective components of pain should be used. These results support the use of the three subscales of the MPQ-SF but not the total score. The need to separate intermittent and continuous components of pain is consistent with previous Rasch analysis of the OCOAP,[4] which also found that intermittent and constant pain needed to be assessed on separate scales. It also highlights that there may be differences in the mechanisms of pain involved, and the use of total scores on measures, such as the MPQ-SF2 and ICOAP, may mask important differences.
In addition, there were problems with disordered response thresholds on the MPQ-SF2 which required rescoring of items by collapsing response categories. The ten numerical responses were intended to increase responsiveness of the scale for use as an out-come measure in clinical trials,[14] but these results suggest that the ten response categories could be reduced to three. The response categories used in earlier versions [7–9] may be better.
Test–retest reliability of the pain measures varied. The ICOAP constant subscale and the MPQ-SF-2 continuous subscale were the most reliable over time in people who had not had knee replace-ment. However, it is not appropriate to mix subscales from differ-ent questionnaires. Based on this, the ICOAP had higher test–retest reliability than the MPQ-SF-2, especially when using the Rasch converted scores. The results also support previous research on the MPQ-SF2,[8,9] which found acceptable reliability over time.
[image:7.609.40.575.63.157.2]Responsiveness to change following knee surgery was good with moderate to large effect sizes. The ICOAP was more respon-sive than the MPQ-SF-2, with larger effect sizes. The lowest effect
Table 4.Test–retest reliability of measures of pain in participants who did not have knee surgery.
Standard scoring Rasch converted scoring
ICC n ICC 95% CI P n r p n ICC 95% CI n r p
ICOAP C 29 0.61 0.41–0.77 <0.001 39 0.84 <0.001 30 0.60 0.40–0.77 39 0.81 <0.001 ICOAP I 29 0.36 0.12–0.59 0.001 38 0.63 <0.001 29 0.33 0.10–.57 38 0.61 <0.001 MPQ C 26 0.50 0.27–0.71 <0.001 33 0.65 <0.001 29 0.35 0.13–0.58 36 0.61 <0.001 MPQ I 24 0.67 0.47–0.83 <0.001 29 0.71 <0.001 24 0.60 0.38–0.79 29 0.53 0.002
MPQ N 26 0.38 0.15–0.62 <0.001 33 0.43 0.01 28 0.39 0.16–0.61 36 0.47 0.006
MPQ A 28 0.52 0.31–0.72 <0.001 35 0.80 <0.001
PD T 27 0.58 0.36–0.76 <0.001 37 0.71 <0.001 30 0.57 0.37–0.74 39 0.63 <0.001
Table 5.Responsiveness to change in measures of pain for participants who had knee replacement surgery.
Knee replacement standard scoring Knee replacement Rasch converted scoring
ICC n ICC 95% CI p n
rT1 with
T3 p
Effect
size n ICC 95% CI p n
rT1 with
T3 p
Effect size ICOAP C 46 0.33 0.07–0.56 <0.001 50 0.52 <0.001 1.59 46 0.35 0.07–0.59 <0.001 50 0.54 <0.001 1.69 ICOAP I 45 0.32 0.09–0.22 <0.001 50 0.33 0.02 1.30 46 0.37 0.11–0.58 <0.001 50 0.39 0.006 1.29 MPQ C 43 0.42 0.17–0.63 <0.001 47 0.48 0.001 1.08 45 0.38 0.15–0.59 <0.001 47 0.44 <0.001 1.27 MPQ I 37 0.27 0.07–0.49 <0.001 42 0.22 0.16 1.12 37 0.31 0.10–0.52 <0.001 42 0.24 0.03 1.02 MPQ N 39 0.44 0.25–0.62 <0.001 44 0.29 0.06 0.15 39 0.35 0.16–0.55 <0.001 44 0.27 0.02 0.09 MPQ A 43 0.52 0.30–0.70 <0.001 48 0.61 <0.001 0.78
[image:7.609.40.570.188.290.2]sizes were in the MPQ-SF-2 Neuropathic scale and painDETECT. This might reflect a predominant benefit of knee replacement on nociceptive rather than neuropathic pain mechanisms, as indicated by improvements in constant/continuous and intermittent pain rather symptoms that are more characteristic of neuropathic pain. Further research should elucidate whether painDETECT is a useful outcome measure for interventions targeting OA pain mechanisms that overlap with those mediating neuropathic pain. The respon-siveness of the affective scale of the MPQ-SF2 was high, which is in contrast to a previous study [8] which found the affective scale was least responsive to change.
There are limitations to the study. The data on the MPQ-SF-2 was collected as part of an evaluation of a large set of question-naires and therefore was not completed by all those invited to complete the questionnaires. However, the sample was large and obtained from a range of sources and is probably representative of those with OA knee. The retest questionnaires were only com-pleted by 44% of those who were assessed at baseline. Although the demographic characteristics of those who completed initial assessment and those who completed the retest are similar (Table 1), they may have differed on characteristics which were not assessed. The retest interval was quite long and although par-ticipants were known not to have had surgery in this interval they may have had changes to medical management, which could have changed their scores. The reported test–retest reliability estimates may therefore be an underestimate of the stability of the scales over time. The responsiveness was assessed in people who had had knee surgery but did not include those who had received other treatments that may have changed their pain scores. However, responsiveness for constant/continuous and intermittent subscales was shown to be good, although greater responsiveness of neuropathic scales to other kinds of treatment cannot be excluded
Overall the study supports the use of the ICOAP as a reliable and responsive measure of pain in people with osteoarthritis of the knee, comprising two unidimensional scales. The MPQ-SF-2 was found to be an acceptable alternative, but the affective items did not form a unidimensional scale. Use of painDETECT to assess neuropathic qualities of OA pain merits further study, but alterna-tive measures should be used to address affecalterna-tive components of OA pain. Rasch transformations improved the internal validity of questionnaires, despite having little impact on repeatability or responsiveness to change.
Acknowledgements
We would like to thank Bryan Moreton and Heather Cogger for assistance with data analysis, and Maggie wheeler for participant recruitment
Disclosure statement
The study was funded by Arthritis Research UK Pain Centre grant. The authors have no conflict of interest to declare.
ORCID
Nadina B. Lincoln http://orcid.org/0000-0001-5604-2339
References
[1] Tennant A, Conaghan PG. The Rasch measurement model in rheumatology: What is it and why use it? When should it
be applied, and what should one look for in a Rasch paper? Arthritis Rheum. 2007;57:1358–1362.
[2] Hawker GA, Davis AM, French MR, et al. Development and preliminary psychometric testing of a new OA pain meas-ure-an OARSI/OMERACT initiative. Osteoarthr Cartil. 2008;16:409–414.
[3] Hawker GA, Stewart L, French MR, et al. Understanding the pain experience in hip and knee osteoarthritis – an OARSI/ OMERACT initiative. Osteoarthr Cartil. 2008;16:415–422. [4] Moreton BJ, Wheeler M, Walsh DA, et al. Rasch analysis of
the intermittent and constant osteoarthritis pain (ICOAP) scale. Osteoarthr Cartil. 2012;20:1109–1115.
[5] Davis AM, Lohmander LS, Wong R, et al. Evaluating the responsiveness of the ICOAP following hip or knee replace-ment. Osteoarthr Cartil. 2010;18:1043–1045.
[6] Singh JA, Luo R, Landon GC, et al. Reliability and clinically important improvement thresholds for osteoarthritis pain and function scales: a multicenter study. J Rheumatol. 2014;41:509–515.
[7] Melzack R. The short-form McGill Pain Questionnaire. Pain. 1987;30:191–197.
[8] Strand LI, Ljunggren AE, Bogen B, et al. The Short-Form McGill Pain Questionnaire as an outcome measure: test-retest reliability and responsiveness to change. Eur J Pain. 2008;12:917–925.
[9] Grafton KV, Foster NE, Wright CC. Test-retest reliability of the short-form McGill pain questionnaire: assessment of intraclass correlation coefficients and limits of agreement in patients with osteoarthritis. Clin J Pain. 2005;21:73–82. [10] Freynhagen R, Baron R, Gockel U, et al. painDETECT: a new
screening questionnaire to identify neuropathic compo-nents in patients with back pain. Curr Med Res Opin. 2006;22:1911–1920.
[11] Gwilym SE, Filippini N, Douaud G, et al. Thalamic atrophy associated with painful osteoarthritis of the hip is reversible after arthroplasty: a longitudinal voxel-based morphometric study. Arthritis Rheum. 2010;62:2930–2940.
[12] Chen S, Lansdown AJ, Moat SJ, et al. An observational study of the effect of metformin on B12 status and peripheral neuropathy. Br J Diabetes Vasc Dis. 2012;12:189–193. [13] Moreton BJ, Tew V, das Nair R, et al. Pain phenotype in
peo-ple with knee osteoarthritis; classification and measurement properties of painDETECT and S-LANSS in a cross-sectional study. Arthritis Care Res. 2014;67:519–528.
[14] Dworkin RH, Turk DC, Revicki DA, et al. Development and initial validation of an expanded and revised version of the short-form McGill pain questionnaire (Sf-Mpq-2). Pain. 2009;144:35–42.
[15] Andrich D, Lyne A, Sheridan B, et al. RUMM2020. Perth (AU): RUMM Laboratory; 2003.
[16] Pallant JF, Tennant A. An introduction to the Rasch meas-urement model: an example using the Hospital Anxiety and Depression Scale (HADS). Br J Clin Psychol. 2007;46:1–18. [17] Andrich D. A rating formulation for ordered response
cate-gories. Psychometrika. 1978;43:561–573.
[18] Masters GN, Wright BD. The partial credit model. In: van der Linden WJ, Hambleton RK, editors. Handbook of modern item response theory. New York (NY): Springer; 1997. p. 101–122.
[19] Shea T, Tennant A, Pallant JF. Rasch model analysis of the Depression, Anxiety and Stress Scales (DASS). BMC Psychiatry. 2009;9:21.
[21] McGraw KO, Wong SP. Forming inferences about some intraclass correlation coefficients. Psychol Methods. 1996;1:30–46.
[22] Landis JR, Koch GG. The measurement of observer agree-ment for categorical data. Biometrics. 1977;33:159–174. [23] Cohen J. Statistical power analysis for the behavioral
scien-ces. 2nd ed. London, UK: Lawrence Erlabaum Associates; 1988.
Appendix
Conversion of SF-MPQ2 scales to Rasch scores
SF-MPQ 2 Continuous subscale conversion Include scores from only items 1, 5–6, 8, 9 and 10. Rescore all items as follows: 0¼0, 1¼1, 2¼1, 3¼1, 4¼1, 5¼1, 6¼2, 7¼2, 8¼2, 9¼2 and 10¼3.
Discount scores for item 9. Sum the scores for males and females separately to produce a value from 0 to 15. Look up the score in the table below and match it to the corresponding ‘‘Rasch’’ score.
SF-MPQ 2 intermittent subscale conversion Include scores from only items 2–4, 11, 16 and 18. Rescore all items as follows: 0¼0, 1¼1, 2¼1, 3¼1, 4¼1, 5¼1, 6¼2, 7¼2, 8¼2, 9¼2 and 10¼3. Sum the scores from the items to produce a score from 0 to 18. Look up the score in the table below and match it to the corre-sponding ‘‘Rasch’’ score.
SF-MPQ 2 neuropathic subscale conversion Include scores from only items 7, 17, 19–22. Sum the scores from the items to produce a score from 0 to 60. Look up the score in the table below and match it to the corresponding ‘‘Rasch’’ score.
Standard score Women’s ‘‘Rasch’’ score Men’s ‘‘Rasch’’ score
0 0 0
1 1.92 1.96
2 3.29 3.32
3 4.30 4.25
4 5.08 5.00
5 5.78 5.63
6 6.43 6.23
7 7.05 6.82
8 7.70 7.44
9 8.38 8.12
10 9.13 8.91
11 9.97 9.82
12 10.92 10.84
13 11.97 11.96
14 13.32 13.33
15 15 15
Standard score ‘‘Rasch’’ score
0 0
1 1.85
2 3.24
3 4.28
4 5.13
5 5.90
6 6.60
7 7.26
8 7.91
9 8.55
10 9.23
11 9.98
12 10.80
13 11.69
14 12.67
15 13.69
16 14.80
17 16.22
18 18
Standard score ‘‘Rasch’’ score
0 0
1 5.16
2 7.90
3 9.42
4 10.33
5 11.24
6 11.85
7 12.46
8 12.91
9 13.37
10 13.82
11 14.13
12 14.58
13 14.89
14 15.19
15 15.65
16 15.95
17 16.25
18 16.56
19 16.71
20 17.01
21 17.32
22 17.62
23 17.92
24 18.23
25 18.53
26 18.68
27 18.99
28 19.29
29 19.59
30 19.90
31 20.20
32 20.35
33 20.66
34 20.96
35 21.27
36 21.57
37 21.87
38 22.18
39 22.63
40 22.94
41 23.24
42 23.70
43 24.00
44 24.46
45 24.91
46 25.37
47 25.97
48 26.58
49 27.19
50 27.95
51 28.86
52 29.77
53 31.14
54 32.51
55 34.33
56 36.61
57 39.34
58 43.29
59 49.67
60 60