This is the author's Post-print version (final draft post-refereeing as accepted for publication by the journal). The definitive, peer-reviewed and edited version of this article is published as: Manley D. & van Ham M. (2011) Choice-based letting, ethnicity and segregation in England. Urban Studies 48(14), 3125-3143.
http://dx.doi.org/10.1177/0042098010394685
Choice based letting, ethnicity and
segregation in England
David Manley and Maarten van Ham
School of Geography and Geosciences, University
of St Andrews, Irvine Building, North Street, St Andrews, Fife, KY16 0ED, UK. E-mail: djm14@st-andrews.ac.uk and maarten.vanham@st-andrews.ac.uk
Abstract. Choice-based letting (CBL) has been widely introduced to the social housing sector in England to give applicants more freedom in where they live. Concerns have been expressed that giving people more choice in residential locations has the potential to increase neighbourhood segregation. It has also been argued that a lack of real choice, not self-segregation, might be a cause of social and ethnic segregation. In social housing real choice might not be available and the most vulnerable are likely to access the easiest housing options: often in deprived and segregated neighbourhoods. This paper analyses the probability that households applying for social housing using different allocation systems end up in deprived or ethnically concentration neighbourhoods. Using unique data representing lettings made in the social housing sector in England we show that ethnic minorities, and especially those using CBL, are the most likely to end up in deprived and ethnic concentration neighbourhoods.
Keywords: Social Housing, Housing Allocation, Choice Based Letting, Ethnicity, Neighbourhood, Segregation
Introduction
of ethnically and socio-economically mixed neighbourhoods (DETR, 2000a; ODPM, 2005).
Around the time of the riots, the Housing Green Paper, Quality and Choice: A decent home for all (DETR, 2000b) placed choice for social renters at the centre of British social housing policy. Based on the Green Paper, choice-based letting (CBL) was introduced as a means of access for those looking to rent in the public sector. CBL was designed to empower people in social housing to make decisions over how and where they live, and allows applicants to bid on properties in neighbourhoods of their ‘choice’ instead of being allocated to a dwelling by a housing officer (Kullberg, 1997; 2002; DETR, 2000b, Brown & Yates, 2005; Brown & King, 2005). The objectives of policies to create socially mixed neighbourhoods and policies to give people more choice on the housing market are potentially contradictory.
Concerns have been expressed that CBL could lead to higher levels of segregation, or at least will help to sustain current levels of segregation (Van Ham & Manley, 2009). It is well established that there are differences between ethnic groups in the desired ethnic mix of the neighbourhoods in which they live and these (sometimes small) differences can lead to marked patterns of ethnic segregation (Schelling, 1969, 1971; see Clark, 1991 for the US; Van Ham & Feijten, 2008 for the Netherlands). So giving people more choice in residential locations under CBL has the potential to increase neighbourhood segregation. The government report Monitoring the Longer Term Impact of Choice Based Lettings (Pawson et al., 2006) concluded that there is no evidence that CBL had resulted in greater ethnic segregation. However, Pawson and Watkins (2007) state that the above conclusion possibly does not reflect experiences of all British social landlords using CBL.
Paradoxically, it has also been argued that a lack of real choice under CBL, and not self-segregation, might be a cause of (sustained) social and ethnic segregation in neighbourhoods (Pawson & Watkins, 2007). Having real choice means being able to select a preferred option from a set of distinctive alternatives. In social housing, a safety net for those without options, distinctive alternatives might not be available. The most vulnerable housing applicants with urgent or specific housing needs are likely to use CBL to go for the easiest-to-get dwellings in the least desirable areas: often deprived and ethnically segregated neighbourhoods. Those with more time on their hands will have the opportunity to wait until they can secure a more desirable property.
2008/2009 financial years. We will compare patterns of neighbourhood sorting for lettings made by the same social landlords before and after CBL was introduced. In addition, we will investigate for the most recent financial year whether lettings made using CBL lead to different patterns of neighbourhood sorting compared to the old housing allocation systems. Third, we will study both the ethnic and socio-economic dimensions of destination neighbourhoods as this will give us more insight in the various mechanisms that might underlie household neighbourhood ‘choices’. It can be argued that if CBL is enabling the expression of genuine choice, it is unlikely that any households would choose to live in the most deprived neighbourhoods (see for instance Marsh et al., 2005). However, if certain deprived ethnic concentration neighbourhoods offer ethnically specific amenities such neighbourhoods might still be attractive to live in for certain groups (Pawson et al., 2006; see also Bowes et al., 1997).
Background and literature review
Segregation and neighbourhood choice
The proportion of ethnic minorities in the overall population in England was around 9 percent at the time of the 2001 Census. Ethnic minorities are generally concentrated in large urban areas compared to rural areas. Ethnic minorities are also over represented in social housing. On average, 17 percent of the white population in England lives in social housing and 27 percent of the ethnic minority population lives in social housing (SEH, 2007). As mentioned in the introduction, the spatial concentration of ethnic minorities is of great concern to the British Government. Concerns have also been expressed about the concentration of ethnic minorities in social housing – which is not independent from the spatial concentration concerns – which suggests that ethnic minorities are less able than others to satisfy their housing needs in the market (Independent Review Team, 2001; Commission for Racial Equality, 1990; 2004; Cabinet Office, 2003; Home Office 2001).
The severity and the scale of both ethnic and socio-economic spatial separation in England, and whether or not it should be termed ‘segregation’ have been debated extensively. Using 1991 Census data for the United Kingdom, Champion (1996) reported that in England ethnic minorities are spatially dispersed and that areas with the highest concentrations of ethnic minorities do not match the image of racialised ‘ghettos’ as known in the USA (see also Peach, 1996; Johnston et al., 2002). In a more recent analysis using the 2001 Census, the national trend of dispersion of ethnic minorities, albeit with pockets of ethnic concentrations, was confirmed by Johnston (2006, p.988). In another study using both 1991 and 2001 Census data Dorling and Rees (2003) suggested that there was evidence at the local authority level of increasing segregation between the white majority and ethnic minorities. Using proxy measures, such as access to bathrooms and central heating as indicators of socio-economic status, Dorling and Rees (2003) also point to growing economic segregation, especially between housing tenure groups. They state: “[t]o be growing up in a council house now marks a household out geographically far more than it did a decade ago” (p.1301).
2009; Van Ham & Clark, 2009). Individual preferences related to the ethnic composition of the neighbourhood population, and the consequent moving behaviour of these individuals, can cumulate in aggregate to highly segregated neighbourhoods (Schelling, 1969, 1971; see also Clark, 1992; Emerson et al., 2001; Ihlanfeldt and Scafidi, 2002; Ionnides and Zabel, 2003). Alternatively, the ‘racial proxy hypothesis’ argues that members of the majority population leave ethnic concentration neighbourhoods not because they have an aversion to living near minority group members per se, but because these neighbourhoods are often deprived (Taub et al., 1984; Clark, 1992; Harris, 1999; Crowder, 2000). This is partly because some ethnic minority groups are more likely to be unemployed and poor, and partly because ethnic minorities often end up in poor, deprived and unstable neighbourhoods as a result of limited choice on the housing market.
Simpson (2004) has highlighted that to fully understand apparent neighbourhood segregation it is necessary to move beyond issues of selective migration. Using demographic data for Bradford, Simpson (2004) reported that significant changes in the relative distribution of the South Asian community, relative to rest of the population, was caused by natural population growth. Bradford was one of the cities in the North of England that experienced riots during the summer of 2001, and it is notable that Simpson’s conclusion on the causes of segregation was at odds with the government report which focussed on self-segregation of ethnic minorities through their residential choices (Independent Review Team, 2001). The same report does not acknowledge that ‘self-segregation’ is often rooted in poverty and deprivation, and not necessarily the result of real choice (Hickman and Robinson, 2006; Robinson, 2005).
Housing ‘choice’ and segregation
The above discussion of household preferences with regard to the ethnic composition of their neighbourhood and subsequent selective mobility into and out of neighbourhoods is only relevant when households can exercise some level of choice in their housing behaviour. This is the case (to some extent) in the owner-occupied market, but much less so in the social housing sector. Over the last 30 years, the social housing sector in England has undergone major structural changes, eroding the choice set of social housing available. In 1981, 31 percent of all households in England lived in social housing and by 2007 this figure had fallen to 18 percent (SEH, 2007). In under three decades, the social housing sector has been redefined from a tenure of destination (Hickman and Robinson, 2006) into a tenure of last resort, to be accessed only when all other housing options have been exhausted by those unable to afford housing by other means (Taylor, 1998). Historically low investment in the building of new social housing, combined with the sales of millions of social housing units to sitting tenants under the right-to-buy (Jones and Murie, 2006) has severely depleted the social sector. The right-to-buy was mainly used to purchase the most desirable dwellings in the most desirable neighbourhoods, resulting on the residualization of the remaining social housing stock.
housing waiting list (Pawson & Watkins, 2007) or exclusion through one-offer-only policies (Pawson & Kintrea, 2002).
Housing allocation practices from as far back as the 1950s have been linked to current patterns of ethnic segregation. It was repeatedly shown that housing officers intentionally and unintentionally promoted segregated outcomes by discriminating applicants based on ethnicity and socio-economic background and allocated households to dwellings and neighbourhoods based on whether they ‘deserved’ a dwelling, or were ‘suitable’ for a neighbourhood (Duke, 1970; Simpson, 1981; Henderson & Karn, 1984; Clapham & Kintrea, 1984; Malpass & Murie, 1994; Peach, 1996; Somerville, 2001; Sarre et al., 1989). There is no recent research providing evidence of discriminatory practices, so it is fair to assume that these practices have been eliminated. However, also the categorisations used in needs-based assessments as included in the 1996 Housing Act have been accused of reflecting “household types that may be considered especially ‘deserving’” (Fitzpatrick & Pawson, 2006, p.180). As a result of these categorisations, allocation practices using needs based assessment have the propensity to reproduce the geographic concentration of poverty (Fitzpatrick & Pawson, 2006).
In 2001 CBL was introduced to empower people in social housing to make decisions over how and where they live (DETR, 2000b, Brown & Yates, 2005; Brown & King, 2005). The model for CBL came from the ‘advert’ or ‘supply’ model developed in the late 1980s in the city of Delft in the Netherlands (Kullberg, 1997; 2002). The system was designed to “open up the letting of social housing” and operates by enabling eligible households to bid on a range of properties (Pawson et al., 2006, p.5). Eligibility is determined using a variety of different forms of ‘currency’ – such as points and waiting time or housing need bands – to rank bidders (Marsh et al., 2004). Also within the CBL framework, social landlords still have the legal obligation to operate a needs-based allocation system. By introducing a quasi-market system into social housing allocation it was hoped that demand would be stimulated in harder to let areas (Marsh, 2004) and that households would access properties and locations that were more suitable to their needs and reflected the kind of places in which they would like to live, theoretically encouraging households to become stakeholders in their neighbourhoods. The Department of Communities and Local Government, the Government department responsible for social housing policy in England aims to have CBL available to all housing applicants by 2010. Letting data for the 2008/9 financial year as used in this study, shows that CBL is used for 30 percent of all lettings
be of sub-standard quality. An essential prerequisite for real choice is information (knowledge) about alternatives (see Elster, 1999 as in Brown & King, 2005). Some social housing applicants using CBL will have more and better information than others, either as a result of English language skills (Pawson et al., 2006), skills in using the CBL system, time to assess alternatives, or greater knowledge about the local housing market and neighbourhoods in their choice set. Ultimately, this will bias the allocation system in their favour (Brown & King, 2005). Research in the Netherlands showed that applicants with low incomes and those from ethnic minority groups (often overlapping groups) were more likely to lack understanding of the CBL system and therefore fared less well in terms of housing outcomes (Kullberg, 2002).
CBL might also lead to segregation because those with urgent housing needs, but without priority status, use their choice to bid on the easiest-to-get dwellings which increases the likelihood to be accommodated in a less desirable area (Van Ham & Manley, 2009). Fitzpatrick and Pawson noted that “the importance of the ‘ability to wait’ in driving spatial polarisation is germane to the potential impact of the ‘choice’ agenda” (2006 p.172). This is especially true as in cases where households with similar needs bid on the same property, waiting time is often used as a means to allocate the dwelling to the household with the longest waiting time. As a result of the above, concerns have been expressed that CBL might be detrimental to the interests of already disadvantaged groups (Pawson & Watkins, 2007). Ethnic minorities may end up in ethnic concentration neighbourhoods, and especially deprived ethnic concentration neighbourhoods, not as a result of choice, but as a result of a lack of choice (Van Ham & Manley, 2009).
To date, work assessing the impact of CBL on segregation has largely focussed on changes in the level of segregation in the neighbourhoods affected. Work for the Department of Communities and Local Government (Pawson et al., 2006), and extended in Pawson and Watkins (2007), used a number of case studies from social housing estates and concluded that “there is no evidence that [CBL] has resulted in more ethnically polarized patterns of letting than those arising from previous lettings systems where decisions on which properties to offer to which applications were largely in the hands or landlord staff” (Pawson et al., 2006, p.14; see also Pawson & Watkins, 2007). In terms of ethnic mix in communities Pawson and colleagues found that “[m]any applicants preferred ethnically mixed areas, rather than areas where one ethnicity predominated, which suggests that diffusion is more likely than segregation under CBL” (2006, p.183).
In this study we argue that as neighbourhoods are dynamic environments with households moving in and out all the time, some process of neighbourhood sorting must be in place even when overall levels of segregation to stay the same (Van Ham & Manley, 2009). Sorting mechanisms within previous letting systems might simply have been replaced by (self) selection mechanisms within the CBL system.
Data and Methods
shortcomings, but we believe that in combination they provide a robust insight into the effects of housing allocation systems.
In the first approach we compared patterns of neighbourhood sorting for lettings made by the same social landlords before and after the introduction of CBL. We compared lettings from the CORE Housing Association data for the financial years 1999/2000 and 2008/9. The dataset was restricted to include only lettings by Housing Associations which made more than 90% of their lettings through CBL in 2008/9 and for which we could also identify lettings in 1999/2000. We selected lettings made by the same Housing Associations in two time periods, in an attempt to keep housing stock and neighbourhood characteristics constant over time. We acknowledge that there will have been substantial changes in the structure of Housing Associations during the 8 years through the processes of transfers, mergers and acquisitions which alter the staffing composition, management structures and policies practiced by the associations. Nevertheless, we feel that the comparability of the stock is sufficient for the analysis we wish to conduct, especially when combined with the second approach outlined below. To enhance comparability, only lettings made in urban areas were selected. Urban areas were identified using the Office of National Statistics urban – rural classification system (ONS, 2010). In practice the urban restriction did not reduce the data substantially as most CBLs were made in urban areas. The first dataset had a usable set of 26,398 lettings.
In the second approach we compared patterns of neighbourhood sorting for lettings made using CBL and traditional allocation methods in the 2008/9 financial year only. We combined data on lettings by Housing Associations and Local Authorities, effectively creating a census of lettings made in 2008/9 (CORE, 2009). The data is complete for 92% of Local Authorities (CHR, 2009) and for all Housing Associations with more than 250 units or 250 bed spaces in England. Social landlords with less than 250 units or bed spaces or not registered with the Housing Corporation but who are affiliated to the National Housing Federation are invited to complete CORE logs. CORE was launched in 1989 and around 600 Housing Associations are now recording more than 125,000 general needs lettings, 90,000 supported housing lettings and 16,000 sales per year. LACORE, recording lettings made by Local Authorities, was started in 2004 and although the data is not complete, we considered it to be important to include LACORE data in the analysis so the data would be representative of most of the social housing sector. For 2008/9 LACORE comprised of almost 96,000 Supported Housing and General Needs lettings. In total the combined dataset provided us with detailed information on 227,668 useable lettings.
the IMD 2004 was linked to the 1999/200 data and the IMD 2007 to the 2008/9 data. Although the dates of the IMDs are not identical to the dates of the lettings, it is valid to use deprivation information from different time periods as deprivation is largely static over time (see Meen et al., 2007)
Instead of directly using the national absolute measures of neighbourhood deprivation and ethnicity we created bespoke relative measures for local housing markets. Given that most households search locally, not nationally, for housing, we chose to create variables reflecting the relative position of a neighbourhood in the local housing market. We explored various ways to make local housing markets operational such as Local Authorities (LA), Travel to Work Areas (TTWA), and Government Office Regions (GOR). We decided that Travel to Work Areas come closest to what we see as local housing markets as they are defined so that 75% of those living in the area also work in the area and 75% of those working in the area also live in the area (Coombes & Raybould, 2004). Super Output Areas nest conterminously within Travel to Work Areas.
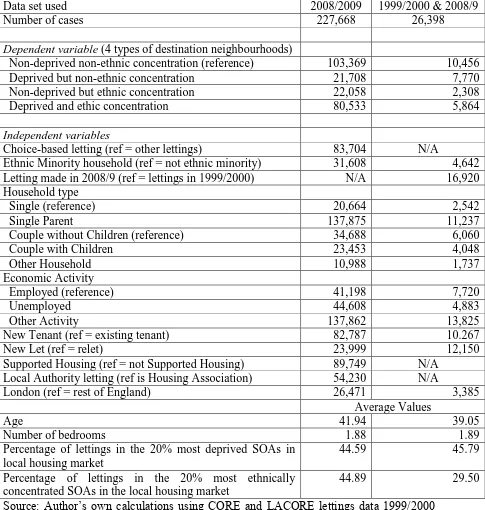
Using the scores for the Index of Multiple Deprivation we identified the 20 percent most deprived Super Output Areas in each Travel to Work Area. Using the percentage of ethnic minorities in each Super Output Areas we identified the 20 percent neighbourhoods with the highest percentage of ethnic minorities in each Travel to Work Area. We then used these bespoke relative measures of neighbourhood deprivation and ethnicity to code our dependent variable (type of destination neighbourhood) into four categories: (1) non-deprived and non-ethnic concentration neighbourhoods; (2) deprived but non-ethnic concentration neighbourhoods; (3) non-deprived but ethnic concentration neighbourhoods, and; (4) deprived and ethnic concentration neighbourhoods. The distribution of lettings according to destination neighbourhood type can be found in Table 1. These four categories are based on research which shows that many people see deprived neighbourhoods and ethnic concentration neighbourhoods as less desirable (Harris, 1999; Bolt et al., 2008). We believe that our four types of neighbourhoods are a proxy for neighbourhood desirability in local housing markets, where the first type of neighbourhood is more desirable than the other three types (although there is no particular order between types two, three or four).
<Table 1 here please>
Most independent variables included in the model were coded as dummies. Ethnic minority households were defined as households where the head does not belong to any of the following groups: White, White Irish or White Other. Ethnic minorities were coded as 1 and others were coded as 0. Employment status was measured in three categories: employed (reference category), unemployed, and other. Household composition was measured in 5 categories: single, single parent, two adult household with children, two adults without children (reference category), and other households. Dummy variables were created for lettings in the Supported Housing sector, lettings to new households entering the social sector from other tenures (compared to lettings made to households within the social sector), lettings made to households entering new stock (compared to household entering existing stock), and lettings made to households using CBL. Because CBL is more common in the Local Authority sector than in Housing Association properties, a dummy for households renting Local Authority dwellings (opposed to renting through a Housing Association) was included. Age of the head of household was measured in years, and included as a continuous variable. The number of bedrooms in the property was not available for all Supported Housing properties. For the rentals where this information was missing the average number of bedrooms was imputed which gives unbiased estimates (see Cohen & Cohen, 1975, chapter 7). The numerical distributions for the variables are described in table 1.
Housing market areas differ largely in the types of neighbourhoods on ‘offer’ and we had to control our models for this fact. In local housing markets with a high percentage of social housing in deprived neighbourhoods, social housing applicants are more likely to end up in a deprived neighbourhood. Likewise, in local housing markets with a high percentage of ethnic minorities, social housing applicants are more likely to end up in an ethnic concentration neighbourhood. To control for structural differences between local housing markets we added two more variables to our models: the proportion of lettings made across the housing market in deprived and ethnic neighbourhoods.
Results
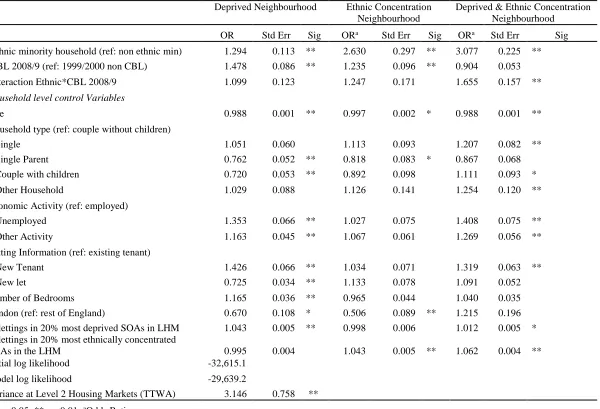
Table 2 shows the results of a multilevel multinomial regression model of neighbourhood outcomes in which we compare neighbourhood outcomes for lettings made in the financial year 1999/2000 (before CBL was introduced) with the outcomes of lettings made in the financial year 2008/9 (after CBL was introduced). As outlined in the data and methods section, for comparability we selected lettings made by the same Housing Associations in both periods. This design allows us to gain insight into the impact of introducing CBL on neighbourhood sorting.
likely to enter a deprived and ethnic concentration neighbourhood compared to the reference category. The interaction effect between the ethnicity dummy and the CBL dummy shows that ethnic minorities using CBL are the most likely to rent a dwelling in deprived neighbourhoods, ethnic concentration neighbourhoods and deprived ethnic concentration neighbourhoods. A full overview of the effects will be given at the end of this section.
<Table 2 here please>
The model in Table 2 also contains a set of additional control variables which will only be discussed briefly here. The effects of the control variables reflect a combinations of factors such as the housing allocation practices of social housing providers, the structure of the local housing market, and a limited degree of choice (even under the old allocation system). The results show that the older the head of the household, the less likely it is that the household is allocated (or has chosen) a dwelling in any of the deprived or ethnic concentration neighbourhoods. The age effect might be a proxy for the time households have been on a waiting list. The longer the waiting time, the more likely it is that a household gets the dwelling of their choice in a more desirable neighbourhood. Alternatively, the age effect might reflect differences in the composition in housing stock between neighbourhoods where housing suitable for older applicants might be more likely to be located in non-deprived and non-ethnic concentration neighbourhoods. Households with children are the least likely of all household types to move into or within any of the deprived or ethnic concentration neighbourhoods. These results are in line with those found by Bolt and colleagues (2008) who demonstrated that households with children tend to avoid areas with negative reputations, which would include deprived and ethnic concentration areas (see Permentier et al., 2008 on neighbourhood reputations). Consistently, single person households (without children) and other household types are the most likely to rent a dwelling in any of the three deprived or ethnic concentration neighbourhood types.
neighbourhoods, the more likely that a social housing applicant ends up in an ethnic-concentration neighbourhood. The direction of these two local housing market effects is in line with our expectations.
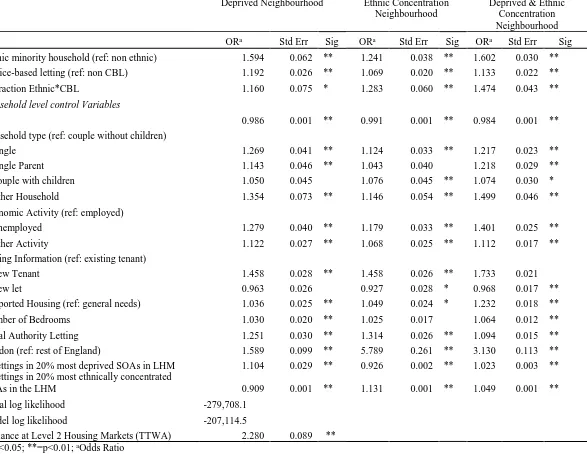
Table 3 reports the results of a multilevel multinomial regression model of neighbourhood outcomes for the full set of lettings from 2008/9. In this model we compare neighbourhood outcomes of CBL and traditional letting practices in the same financial year allowing us to compare the outcomes of the different letting mechanisms. As in the previous table, the reference category consists of non-deprived, non-ethnic concentration neighbourhoods. The results show that ethnic minorities are more likely than others to rent a dwelling in deprived neighbourhoods, ethnic concentration neighbourhoods and deprived and ethnic concentrated neighbourhoods. Those who rented their dwelling using CBL are more likely to end up in a deprived or ethnic concentration neighbourhood than those who rented their dwelling using traditional allocation mechanisms. The interaction effect between the ethnicity dummy and the CBL dummy shows that ethnic minorities using CBL are the most likely to end up in deprived and ethnic concentration neighbourhoods. Table 3 also reports the effects of a range of control variables which show roughly similar results to those found in the model in Table 2.
<Table 3 here please>
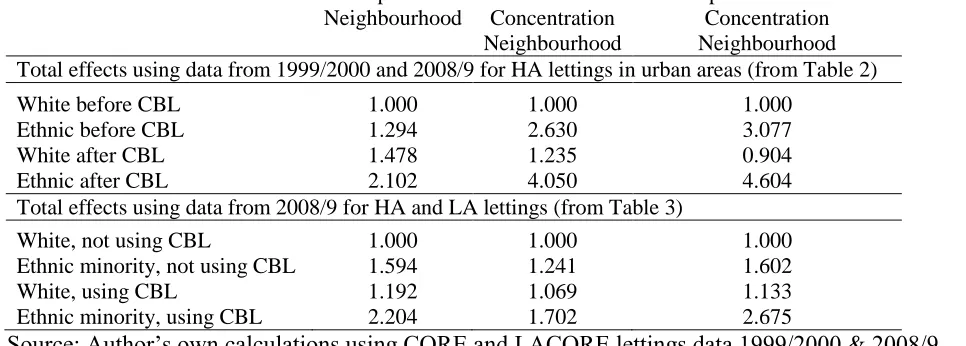
Table 4 shows the overall effects of the ethnicity dummy, the CBL dummy and the interaction effects for the models as presented in Tables 2 and 3. Although different modelling approaches were used, the results are very similar. In both approaches ethnic minorities are consistently more likely to enter not only neighbourhoods with concentrations of other ethnic minorities but also neighbourhoods that have a high level of deprivation. Both approaches also show that ethnic minorities using CBL are far more likely than others (including ethnic minorities using the older allocation mechanisms) to rent a dwelling in deprived neighbourhoods, ethnic concentration neighbourhoods and especially deprived ethnic concentration neighbourhoods.
Discussion
Using unique data on nearly all new lettings in the social housing sector in England from both the 1999/2000 and 2008/9 financial years we analysed whether CBL leads to different types of destination neighbourhoods compared to the old allocation systems and whether CBL leads to different outcomes for ethnic minorities compared to other groups. As discussed, we used two different modelling approaches and we acknowledge that both modelling approaches have shortcomings (as discussed in the data and methods section). However, given that both approaches lead to the same conclusions we are confident that the results are robust.
creating or sustaining segregated neighbourhoods. This is an important finding. The underlying mechanisms might be diverse: self-selection as a result of the limited possibility of rejecting a dwelling offered under the old allocation system; allocation practices of social landlords; and local housing market and population structures. The second conclusion is that those who rent their dwelling through CBL (both non-minority and ethnic minority households) are more likely to end up in a deprived neighbourhood (and to a lesser extent in an ethnic-concentration neighbourhood) than those who get their dwelling using the older allocation systems. This is most likely an indication that CBL is mainly used by social landlords with a lot of stock in deprived neighbourhoods, although we partially controlled for this in our first modelling approach by selecting lettings from the same social landlords in both years. If in a local housing market the majority of dwellings on offer using CBL is located in deprived neighbourhoods, then the majority of tenants using CBL will end up in a deprived neighbourhood. We attempted to control for local housing market structures, but we acknowledge that these variables do not catch all differences between local housing markets.
The third conclusion is that ethnic minorities renting through CBL are much more likely to end up in ethnic concentration neighbourhoods than any other group. This could be seen as a positive result of choice: ethnic minorities choosing to live in neighbourhoods with other ethnic minorities. However, it is interesting that ethnic minorities using CBL are also the most likely to end up in deprived and deprived ethnic-concentration neighbourhoods. As it is unlikely that people ‘choose’ to live in deprived neighbourhoods, this finding gives some support to the alternative explanation that ethnic minorities using CBL end up in (or move within) less desirable neighbourhoods not because of choice, but because of a lack of real choice. We do acknowledge that some of these deprived neighbourhoods will offer ethnic specific amenities which might make them attractive for some groups. Some ethnic minority groups might choose to live in certain deprived neighbourhoods because of the importance of kinship, cultural or infrastructural ties, which are more important in choosing a neighbourhood than the desire to live in less deprived neighbourhoods (see for example Bowes et al., 2007).
Our overall conclusion is that both CBL and the old allocation mechanism sort ethnic minorities into ethnic concentration neighbourhoods. Ethnic minorities renting through CBL are the most likely to end up in ethnic concentration neighbourhoods. We did not investigate whether the level of segregation in neighbourhoods changed after the introduction of CBL, but our analyses at least show that CBL leads to selective sorting. The fact that ethnic minorities using CBL are not only the most likely to end up in ethnic concentration neighbourhoods, but also in deprived neighbourhoods suggests that the selective sorting is not only a result of choice and self-segregation, but also a result of a lack of real choice. Part of this lack of real choice seems to be caused by social landlords using CBL in the most deprived neighbourhoods and the most difficult to let stock. When having real choice means being able to select a preferred option from distinctive alternatives, CBL does not offer real choice.
Acknowledgements
and the anonymous Urban Studies referees for their helpful comments on earlier drafts of this article.
References
Bailey, N. & Livingston, M. (2008) Selective migration and area deprivation: evidence from 2001 Census migration data for England and Scotland, Urban Studies, 45, pp.943-61.
Bolt, G., van Kempen, R., & Van Ham, M. (2008) Minority Ethnic Groups in the Dutch Housing Market: Spatial Segregation, Relocation Dynamics and Housing Policy, Urban Studies, 45, pp.1359-1384.
Bowes, A. Dar, N. & Sim, D. (1997) Tenure preference and housing strategy: An exploration of Pakistani experiences, Housing Studies, 12, pp.63-84.
Brown, T. & King, P. (2005) The power to choose: effective choice and housing policy European Journal of Housing Policy, 5, pp.59-75.
Brown, T. & Yates, N. (2005) Allocations and lettings – Taking customer choice forward in England? European Journal of Housing Policy, 5, pp.343-357.
Cabinet Office (2003). Ethnic minorities and the labour market: Interim Analytical Report. London: Cabinet Office.
Champion, T. (1996). Internal migration and ethnicity in Britain, in P. Ratcliffe (Ed.) Social Geography and Ethnicity in Britain: Geographical Spread, Spatial Concentration and Internal Migration (Ethnicity in the 1991 Census, Vol.3), pp.135-173. London: HMSO.
CHR (2009) Housing Association and Local Authority Key Findings Digest for lettings and sales. London: Tenant Services Authority.
Clapham, D. and K. Kintrea (1984). Allocation Systems and Housing Choice, Urban Studies, 21, pp.261-269.
Clapham, D. and K. Kintrea (1991). Housing Allocation and the Role of the Public Rented Sector, in D Donnison, & D. Maclennan (Eds). The Housing Service of the Future, pp.53-74, Harlow: Longman.
Clark, W. (1991) Residential Preferences and Neighbourhood Racial Segregation: A Test of the Schelling Segregation Model, Demography, 28, pp.1-19.
Clark, W. (1992) Residential Preferences and Residential Choices in a Multiethnic Context, Demography, 29, pp.451-466.
CLG (2007) Using the English Indices of Deprivation 2007, Department of Communities and Local Government, London: HMSO.
Cohen, J. & Cohen, P. (1975) Applied Multiple Regression/Correlation Analysis for the Behavioural Science, New York: John Wiley & Sons.
Commission for Racial Equality (1990) Racial Discrimination in an Oldham Estate Agency. Report of Formal Investigation into Normal Lester and Co. London: CRE. Commission for Racial Equality (2004). Race and Council Housing in Hackney: A
general Investigation. London: CRE.
CORE (2007). What is CORE? Retrieved September 13, 2007, from www.core.ac.uk/introduction.html.
Crowder K, (2000) The racial context of white mobility: An individual-level assessment the white flight hypothesis Social Science Research, 29, pp.223 – 257
Dekker, K. and R. Rowlands (2005) Tackling social cohesion in ethnically diverse estates, in Van Kempen, R. Dekker, K. Hall, S. & Tosics, I. Restructuring Large Housing Estates in European Cities: An Introduction pp.105-126, Bristol: Policy Press.
Denham, J. (2001) Building Cohesive Communities: A Report of the Ministerial Group on Public Order and Community Cohesion, London: Community Cohesion Unit, Home Office.
DETR (2000a) Our Towns and Cities - The Future: Delivering an Urban Renaissance. Urban White Paper, London: HMSO.
DETR, (2000b) Quality and Choice: A Decent Home for All: The Housing Green Paper. London: Department of the Environment, Transport and the Regions.
Dorling, D. & Rees, P. (2003) A nation still dividing: the British census and social polarization 1971–2001, Environment and Planning A, 35, pp.1287-1313.
Duke, C. (1970) Colour and Rehousing: a study of redevelopment in Leeds, Institute of Race Relations.
Elster, J. (1999) Strong Feelings: Emotion, Addiction, and Human Behavior, Bradford Books.
Emerson, M. O., Chai, K. J., & Yancey, G. (2001) Does race matter in residential
segregation? Exploring the preferences of white Americans, American Sociological Review, 66, pp.922-935.
Feijten P.M. and Van Ham M. (2009) Neighbourhood change… reason to leave? Urban Studies 46, pp.2103–2122.
Fitzpatrick, S. & Pawson, H. (2006) Welfare safety net or tenure of choice? The dilemma facing social housing policy in England. Housing Studies. 22 pp.163 – 182.
Galster, G. (2001) On the nature of neighbourhood, Urban Studies, 38, pp.2111–2124 Harris, D. R. (1999) Property values drop when blacks move in, because...: racial and
socioeconomic determinants of neighbourhood desirability, American Sociological Review, 64, pp.461–479.
Henderson, J. & Karn, V. (1984) Race, class and the allocation of public housing in Britain, Urban Studies, 21, pp.115–128.
Hickman, P. & Robinson, D., (2006) Transforming Social Housing: Taking Stock of New Complexities. Housing Studies, 21, pp.157-170.
Home Office (2001). Building Cohesive Communities: A Report of the Ministerial Group on Public Order and Community Cohesion. London: Home Office.
Ihlanfeldt, K.R. & Scafidi, B. (2002) Black self-segregation as a cause of housing segregation: evidence from the multi-city study of urban inequality, Journal of Urban Economics, 51, pp.366-390.
Independent Review Team (2001). Community Cohesion. A report of the Independent Review Team, London: Home Office.
Johnston, R. (2006). School and Residential Ethnic Segregation: An Analysis of Variations across England's Local Education Authorities. Regional Studies, 40, pp.973-990.
Johnston, R. Forrest, J. & Poulsen, M. (2002). Are there Ethnic Enclaves/Ghettos in English Cities? Urban Studies, 39, pp.591-618.
Jones, C. and Murie, A. (2006) The Right to Buy: Analysis and Evaluation of a Housing Policy, Oxford: Wiley-Blackwell Publishing.
Kullberg, J. (1997). From waiting lists to adverts: the allocation of social rented dwellings in the Netherlands. Housing Studies, 12, pp.393-403.
Kullberg, J. (2002). Consumer’s responses to choice based letting mechanisms. Housing Studies, 17, pp.549-579.
Malpass, P. & Murie, A. (1994). Housing Policy and Practice, 4th edition, London and Hong Kong: MacMillan Press.
Marsh, A. (2004) The inexorable Rise of the Rational Consumer? The Blair Government and the reshaping of social housing, European Journal of Housing Policy, 4, pp.185-207.
Marsh, A., Cowen, D., Cameron, A., Jones, M., Kiddle, C & Whitehead, C. (2004) Piloting Choice Based Lettings: An evaluation. London Office of the Deputy Prime Minister.
Meen, G., Meen, J. & Nygaard, C. (2007) A Tale of Two Victorian Cities in the 21st Century. ICHUE Discussion Paper No. 7.
ODPM (2005) Planning for mixed communities, London: Office of the Deputy Prime Minister.
ONS, (2010) Rural and Urban Statistics in England: Guidance Notes. Office for National Statistics. http://www.ons.gov.uk. Last accessed 03/07/2010.
Pawson, H. & Kintrea K. (2002) Part of the Problem or Part of the Solution? Social Housing Allocation Policies and Social Exclusion in Britain. Journal of Social Policy, 31, pp.643-667.
Pawson, H., Jones, C., Donohoe, T,. Clegg, S.& Thomas, A. (2006) Monitoring the Longer Term Impact of Choice Based Lettings. London: HMSO.
Pawson, H. & Watkins, D. (2007) Quasi-marketing access to social housing in Britain: Assessing the distributional impacts, Journal of Housing and the Built
Environment, 22, pp.149-175.
Peach, C. (1996) Does Britain have ghettos? Transactions of the Institute of British Geographers, 21, pp.216-235.
Permentier M., Van Ham M. and Bolt G. (2008) Same Neighbourhood … Different Views? A Confrontation of Internal and External Neighbourhood Reputations, Housing Studies, 23, pp.833-855.
Rabe-Hesketh, S. and Skrondal, A. (2008). Multilevel and Longitudinal Modeling Using Stata (Second Edition). College Station, TX: Stata Press.
Robinson, D, (2005) The search for community cohesion: key themes and dominant concepts of public policy agenda, Urban Studies, 42, pp.1411–1421.
Sarre, P., Phillips, D., & Skellington, R. (1989) Ethnic Minority Housing: Explanations and policies Aldershot: Avebury
Schelling, T.C. (1971) Dynamic models of segregation, Journal of mathematical sociology, 1, pp.143-186.
SEH (2007) Housing in England 2005/06: A report principally from the 2005/06 Survey of English Housing, London: Department for Communities and Local Government. Simpson, A. (1981) Stacking the decks. Nottingham Community Relations Council. Simpson, L. (2004) Statistics of Racial Segregation: Measures, Evidence and Policy,
Urban Studies, 41, pp.661-681.
Somerville, P. (2001) Allocating housing or letting people choose? in D Cowan & A Marsh (Eds) Two Steps Forward: Housing Policy Into the New Millennium, pp.113-132, Bristol: Policy Press.
Taub, R. P., Taylor, G. D. & Dunham, J. D. (1984) Paths of Neighbourhood Change, Chicago: University of Chicago Press.
Taylor, M. (1998) Combating the Social Exclusion of Housing Estates. Housing Studies, 13, pp.819-832.
Van Ham, M., & Clark, W. A.V. (2009) Neighbourhood mobility in context: household moves and changing neighbourhoods in the Netherlands. Environment and
Planning, 41, pp.1442-1459.
Van Ham, M. & Feijten, P. (2008). Who wants to leave the neighbourhood? The effect of being different from the neighbourhood population on wishes to move.
Environment and Planning A, 40, pp.1151-1170.
Table 1: Summary statistics of variables used
Data set used 2008/2009 1999/2000 & 2008/9
Number of cases 227,668 26,398
Dependent variable (4 types of destination neighbourhoods)
Non-deprived non-ethnic concentration (reference) 103,369 10,456
Deprived but non-ethnic concentration 21,708 7,770
Non-deprived but ethnic concentration 22,058 2,308
Deprived and ethic concentration 80,533 5,864
Independent variables
Choice-based letting (ref = other lettings) 83,704 N/A
Ethnic Minority household (ref = not ethnic minority) 31,608 4,642 Letting made in 2008/9 (ref = lettings in 1999/2000) N/A 16,920 Household type
Single (reference) 20,664 2,542
Single Parent 137,875 11,237
Couple without Children (reference) 34,688 6,060
Couple with Children 23,453 4,048
Other Household 10,988 1,737
Economic Activity
Employed (reference) 41,198 7,720
Unemployed 44,608 4,883
Other Activity 137,862 13,825
New Tenant (ref = existing tenant) 82,787 10.267
New Let (ref = relet) 23,999 12,150
Supported Housing (ref = not Supported Housing) 89,749 N/A Local Authority letting (ref is Housing Association) 54,230 N/A
London (ref = rest of England) 26,471 3,385
Average Values
Age 41.94 39.05
Number of bedrooms 1.88 1.89
Percentage of lettings in the 20% most deprived SOAs in local housing market
44.59 45.79
Percentage of lettings in the 20% most ethnically concentrated SOAs in the local housing market
44.89 29.50
Table 2: Multilevel Multinomial Regression Model of neighbourhood outcomes (reference group: non-deprived, non-ethnic concentration neighbourhoods) for lettings made by urban Housing Associations in both 1999/2000 and 2008/9.
Deprived Neighbourhood Ethnic Concentration Neighbourhood
Deprived & Ethnic Concentration Neighbourhood
OR Std Err Sig ORa Std Err Sig ORa Std Err Sig
Ethnic minority household (ref: non ethnic min) 1.294 0.113 ** 2.630 0.297 ** 3.077 0.225 ** CBL 2008/9 (ref: 1999/2000 non CBL) 1.478 0.086 ** 1.235 0.096 ** 0.904 0.053
Interaction Ethnic*CBL 2008/9 1.099 0.123 1.247 0.171 1.655 0.157 **
Household level control Variables
Age 0.988 0.001 ** 0.997 0.002 * 0.988 0.001 **
Household type (ref: couple without children)
Single 1.051 0.060 1.113 0.093 1.207 0.082 **
Single Parent 0.762 0.052 ** 0.818 0.083 * 0.867 0.068 Couple with children 0.720 0.053 ** 0.892 0.098 1.111 0.093 *
Other Household 1.029 0.088 1.126 0.141 1.254 0.120 **
Economic Activity (ref: employed)
Unemployed 1.353 0.066 ** 1.027 0.075 1.408 0.075 **
Other Activity 1.163 0.045 ** 1.067 0.061 1.269 0.056 **
Letting Information (ref: existing tenant)
New Tenant 1.426 0.066 ** 1.034 0.071 1.319 0.063 **
New let 0.725 0.034 ** 1.133 0.078 1.091 0.052
Number of Bedrooms 1.165 0.036 ** 0.965 0.044 1.040 0.035 London (ref: rest of England) 0.670 0.108 * 0.506 0.089 ** 1.215 0.196
% lettings in 20% most deprived SOAs in LHM 1.043 0.005 ** 0.998 0.006 1.012 0.005 * % lettings in 20% most ethnically concentrated
SOAs in the LHM 0.995 0.004 1.043 0.005 ** 1.062 0.004 **
Initial log likelihood -32,615.1
Model log likelihood -29,639.2
Variance at Level 2 Housing Markets (TTWA) 3.146 0.758 **
*=p<0.05; **=p<0.01; aOdds Ratio
Table 3: Multilevel Multinomial Regression Model of neighbourhood outcomes (reference group: non-deprived, non-ethnic concentration neighbourhoods) for full 2008/9 data.
Deprived Neighbourhood Ethnic Concentration Neighbourhood
Deprived & Ethnic Concentration Neighbourhood
ORa Std Err Sig ORa Std Err Sig ORa Std Err Sig
Ethnic minority household (ref: non ethnic) 1.594 0.062 ** 1.241 0.038 ** 1.602 0.030 ** Choice-based letting (ref: non CBL) 1.192 0.026 ** 1.069 0.020 ** 1.133 0.022 **
Interaction Ethnic*CBL 1.160 0.075 * 1.283 0.060 ** 1.474 0.043 **
Household level control Variables
Age 0.986 0.001 ** 0.991 0.001 ** 0.984 0.001 **
Household type (ref: couple without children)
Single 1.269 0.041 ** 1.124 0.033 ** 1.217 0.023 **
Single Parent 1.143 0.046 ** 1.043 0.040 1.218 0.029 **
Couple with children 1.050 0.045 1.076 0.045 ** 1.074 0.030 *
Other Household 1.354 0.073 ** 1.146 0.054 ** 1.499 0.046 **
Economic Activity (ref: employed)
Unemployed 1.279 0.040 ** 1.179 0.033 ** 1.401 0.025 **
Other Activity 1.122 0.027 ** 1.068 0.025 ** 1.112 0.017 **
Letting Information (ref: existing tenant)
New Tenant 1.458 0.028 ** 1.458 0.026 ** 1.733 0.021
New let 0.963 0.026 0.927 0.028 * 0.968 0.017 **
Supported Housing (ref: general needs) 1.036 0.025 ** 1.049 0.024 * 1.232 0.018 **
Number of Bedrooms 1.030 0.020 ** 1.025 0.017 1.064 0.012 **
Local Authority Letting 1.251 0.030 ** 1.314 0.026 ** 1.094 0.015 **
London (ref: rest of England) 1.589 0.099 ** 5.789 0.261 ** 3.130 0.113 ** % lettings in 20% most deprived SOAs in LHM 1.104 0.029 ** 0.926 0.002 ** 1.023 0.003 ** % lettings in 20% most ethnically concentrated
SOAs in the LHM 0.909 0.001 ** 1.131 0.001 ** 1.049 0.001 **
Initial log likelihood -279,708.1
Model log likelihood -207,114.5
Table 4: Total effects of ethnicity and choice-based letting, including interaction effect, using odds ratios from models in Tables 2 and 3.
Deprived Neighbourhood
Ethnic Concentration Neighbourhood
Deprived & Ethnic Concentration Neighbourhood Total effects using data from 1999/2000 and 2008/9 for HA lettings in urban areas (from Table 2)
White before CBL 1.000 1.000 1.000
Ethnic before CBL 1.294 2.630 3.077
White after CBL 1.478 1.235 0.904
Ethnic after CBL 2.102 4.050 4.604
Total effects using data from 2008/9 for HA and LA lettings (from Table 3)
White, not using CBL 1.000 1.000 1.000
Ethnic minority, not using CBL 1.594 1.241 1.602
White, using CBL 1.192 1.069 1.133
Ethnic minority, using CBL 2.204 1.702 2.675