Structure-function clustering in multiplex brain networks
J. J. Crofts1, M. Forrester2 andR. D. O’Dea2
1 Nottingham Trent University - School of Science and Technology, Nottingham, NG11 8NS, UK
2 University of Nottingham - Centre for Mathematical Medicine and Biology, School of Mathematical Sciences,
Not-tingham, NG7 2RD, UK
PACS 87.18.Sn– Neural networks
PACS 89.75.-k– Complex systems
PACS 87.18.Vf– Systems biology
Abstract – A key question in neuroscience is to understand how a rich functional repertoire of brain activity arises within relatively static networks of structurally-connected neural pop-ulations: elucidating the subtle interactions between evoked ‘functional connectivity’ and the underlying ‘structural connectivity’ has the potential to address this. These structural-functional networks (and neural networks more generally) are more naturally described using a multilayer or multiplex network approach, in favour of standard single-layer network analyses that are more typically applied to such systems. In this letter, we address such issues by exploring important structure-function relations in the Macaque cortical network by modelling it as a duplex network that comprises an anatomical layer, describing the known (macro-scale) network topology of the Macaque monkey, and a functional layer derived from simulated neural activity. We investigate and characterize correlations between structural and functional layers, as system parameters con-trolling simulated neural activity are varied, by employing recently described multiplex network measures. Moreover, we propose a novel measure of multiplex structure-function clustering which allows us to investigate the emergence of functional connections that are distinct from the un-derlying cortical structure, and to highlight the dependence of multiplex structure on the neural dynamical regime.
Introduction. – Network science provides a powerful set of tools for studying the complex systems that arise throughout the biological, physical, social, and informa-tion sciences [1]. A defining feature of such systems is that ofemergence,i.e.the collective dynamics of such systems are often poorly predicted by the dynamics of any single node. Thus, understanding the impact of complex network topology on the dynamic processes that these structures sustain is of fundamental importance. Neuroscience, with its heterogeneous, multiscale patterns of neural connectiv-ity and rich dynamic repertoire, provides a paradigmatic model in which to study dynamic processes on complex networks. Synchronisation and propagation behaviour of neural activity, for example, is considered to be a key mechanism for many neural processes, and has been stud-ied intensively in both idealised network structures [2–4] and, more recently, within physiologically inspired net-works such as cortical netnet-works of the rat [5], cat [6, 7], and Macaque monkey [8] and humans [9, 10].
An alternative approach to understand the influence
structure [15–18] and function [19–22]; more widely, a fun-damental question is to elucidate how the relatively static anatomical connectivity of the brain supports a vast func-tional repertoire of higher brain functions, such as action, perception and cognition [23]. Improved understanding of the link between anatomical and functional brain net-works has the potential to address this and yet, despite significant progress in our understanding of human brain connectivity over the past decade, this relationship re-mains poorly understood (see,e.g., [24, 25] and references therein).
This letter builds upon recent theoretical advances in complex networks that allows for the treatment of two or more interacting network structures simultaneously [26–28]. Specifically, we employ multiplex network models to analyse simultaneously anatomical and functional brain networks, thereby gaining additional insights into impor-tant structure-function brain relationships via emergent multiplex network properties. In particular, we employ a multiplex approach to analyse structure-function rela-tions, extending [8] to describe the relationship between a physiologically relevant structural network (obtained from the CoComac database [29]) and functional connections derived from simulated neural activity of a set of neu-ral subunits, whose connectivity is defined by the afore-mentioned structural information. Under systematic vari-ation of the model parameters, we investigate the evoked changes in functional network topology in terms of the structure-function relationships revealed by relevant mul-tiplex measures. In addition, we propose a novel measure of multiplex structure-function clustering in order to de-scribe the emergence of functional connections between brain regions in the absence of direct anatomical links. Such a divergence between functional and structural net-works is fundamental to the brain’s wide functional reper-toire; our new quantification of this within a multiplex framework and, in particular, our proposed new clustering measure which seeks to measure precisely this disparity, represents a new avenue towards understanding structure-function relationships at a more fundamental level.
Multiplex brain setup. – A general multiplex net-work comprises N nodes, connected via edges belonging to theM layers. Such a multiplex is fully specified by the vectorA= [A[1], . . . , A[M]] whose entriesA[α]={aα
ij}are
matrices with non-zero entries in theijth position if node
iconnects to nodej in layerα, otherwise{aαij}= 0. The degree vector, k(i), naturally extends the notion of net-work degree to the multiplex setting such that its entries
k[α](i) =P
ja [α]
ij give the standard network degree of node irestricted to layerα, and with obvious generalisation to a directed multiplex with in- and out-degree vectors hav-ing entries given by kin[α] = P
ja [α] ji and k
[α] out =
P
ja [α] ij
respectively.
Herein, we consider only two-layer networks (duplexes) in which the structural network (layer 1) is given by the known cortical network of the Macaque monkey and the
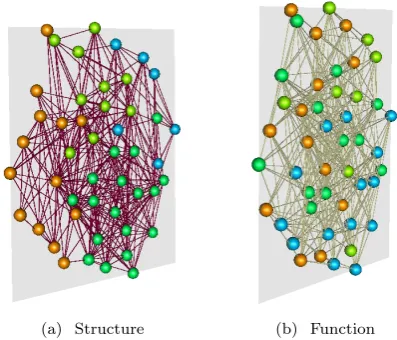
[image:2.595.335.534.87.257.2](a) Structure (b) Function
Fig. 1: An example multiplex brain network, indicating (a) the underlying structural network (the known cortical network of the Macaque monkey) and (b) a functional network derived from synchronisation of neural populations governed by (1).
functional network (layer 2) is derived by measuring pair-wise correlations between time series of simulated neural activity on all nodes (representing cortical areas). Figure 1 shows an example multiplex brain network constructed in this way. More specifically, we use a parcellation of the Macaque cortex consisting of 47 brain regions which are linked by 505 directed fibres [29], yielding a binary con-nectivity matrixA[1]such that{a[1]
ij}= 1 if brain regioni
projects onto brain regionj, and is otherwise zero. To determineA[2], each cortical area is modelled by a
Wilson-Cowan [30] node of two interacting populations of neurons:
dui
dt =−ui+f(c1ui−c2vi+P+
X
j
w[1]ijuj)
dvi
dt =−vi+f(c3ui−c4vi+Q).
(1)
Here, ui(t) denotes the activity of the population of ex-citatory neurons within regioni, andvi(t) the activity of inhibitory neurons. The population firing rate is given by the sigmoid f(x) = 1/(1 + exp (−x)); interconnectiv-ity is encoded by the matrixwij =a[1]ij/P
ka [1]
ik, in which
entries ofa[1]ij are normalised in order that each node re-ceives comparable input. The global between-node con-nectivity strength is controlled by the parameterwhich we henceforth set to unity; for= 0 the network decou-ples, with node dynamics determined only by the parame-ter values and initial data. The constantsc1, . . . , c4 define
the strength of within-node interactions between neural populations and are chosen to be c1 = c2 = c3 = 10
and c4 = −2 as in [31]. The remaining parameters, P
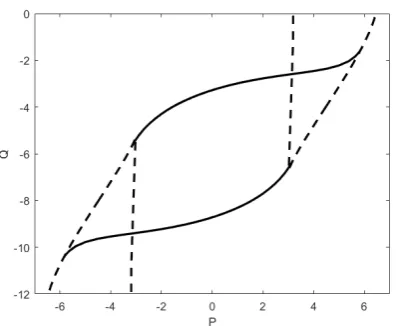
sophis-Fig. 2: Bifurcation sets of a single Wilson-Cowan node forc1 =
c2 =c3 = 10 andc4 =−2. The dashed curve is the
saddle-node bifurcation set, the solid curve is the Hopf bifurcation set.
ticated neural mass models that more faithfully reproduce observed EEG and fMRI data (see,e.g., [32–34] and refer-ences therein) may be employed with little difficulty; how-ever, our focus is to interrogate the relationship between the underlying structural network and the evoked func-tional connections, rather than on detailed analysis of neu-ral population dynamics. The model (1) supports transi-tion between trivial steady-state dynamics and oscillatory neural-like behaviour via a Hopf bifurcation. A skeleton of the bifurcation diagram for a single Wilson-Cowan node is displayed in Figure 2, highlighting, in particular, the Hopf bifurcation set (see [31] for a detailed bifurcation analy-sis). In view of the important role of rhythmic brain activ-ity in neural processing we study only parameter choices that support oscillations. The model (1) supports transi-tion between trivial steady-state dynamics and oscillatory neural-like behaviour under variation of P, Q; in view of the important role of rhythmic brain activity in neural processing we study only parameter choices that support oscillations.
The functional network is derived from the simulated neural activity by calculating pairwise the Pearson’s cor-relation coefficient of the time series of all cortical ar-eas. The resulting correlation matrix was binarised (with threshold chosen such that the resulting functional work is of equal density to the underlying structural work) to obtain an undirected functional connectivity net-work describing cortical areas with statistically similar ac-tivity. In view of the nonlinear oscillations supported by (1), we also investigated functional networks arising from consideration of the mean phase coherence [35], observing qualitatively similar results (as in [8]) which are therefore not included. We remark that more advanced measures may be employed to derive a directed ‘effective connectiv-ity’ structure; however, here we concentrate on undirected functional networks for consistency with similar studies in
the literature, and comparability with [8], in particular. To highlight the influence of the specific topology of the macaque cortical network we compute normalised multi-plex measures obtained by dividing values computed for the structure-function duplex by the corresponding ensem-ble averages obtained from random surrogates. These sur-rogate duplexes are constructed by simulating neural ac-tivity on 100 directed random networks with in- and out-degree sequences matching that of the structural layer.
Multiplex measures. – To characterise the struc-tural properties of the duplex brain network we consider recently forwarded multiplex measures [26–28] and, more-over, propose a novel adaptation of particular relevance to structure-function relationships in neural systems.
Firstly, we quantify the extent to which the link struc-ture varies between the two layers by considering theglobal overlap,O, given by
O=X
i6=j
a[1]ija[2]ij. (2)
Secondly, we consider the multiplex clustering coeffi-cient, in view of the importance of clustering in small-world and hierarchically modular phenomena widely ob-served in both empirical and theoretical analyses of neu-ral networks. Recall that the standard (single-layer) local clustering coefficient, c(i), of node i is given by the ratio of the number of triangles (or 3-cycles) including nodeito the number of connected tuples centered on nodei. Mul-tiplex networks, however, contain more general 3-cycles that traverse multiple layers. Noting that we restrict here to two-layer multiplexes, clustering on each node is given as [27]
C(i) =
P
j6=i,m6=i
a[1]ija[2]jma[1]mi+a[2]ija[1]jma[2]mi k[1]i (ki[1]−1) +k[2]i (ki[2]−1)
(3)
which may be more succinctly expressed
C(i) = A
[1]A[2]A[1]+A[2]A[1]A[2]
ii k[1]i (ki[1]−1) +k[2]i (ki[2]−1)
.
The average clustering coefficient for the network is given by C = (1/N)P
iC(i). Note that both these measures,
as defined in [27], assume that intra-layer adjacency re-lations are symmetric (i.e. A[α] =A[α]T) thus we ignore
directionality of the structural layer when computing (2) and (3).
[image:3.595.57.256.91.254.2]e
C(i) =
P
j6=i,m6=i(a [1] ij +a
[1] ji)a
[2] jm(a
[1] mi+a
[1] im)(1−a
[1] jm)(1−a
[1] mj)
k[1]tot(i)(ktot[1](i)−1)−2 A[1]2
ii 1−c [1] all(i)
=
A[1]+A[1]T A[2]◦ E−A[1]
◦ E−A[1]T
A[1]+A[1]T ii
k[1]tot(i)(k[1]tot(i)−1)−2 A[1]2
ii 1−c [1] all(i)
,
(4)
where◦denotes element-wise multiplication,ktot[1](i) and
c[1]all(i) denote respectively, the total degree (i.e. the sum of the in- and out-degrees) and the directed clustering co-efficient, as defined in [36], for the ith structural node. The factor (1−c[1]all(i)) ensures that Ce(i) ∈ [0,1], while
(1−a[1]jm) and (1−a[1]mj) terms prohibit triads that are closed both in the structural and functional layers. The global version of Equation (4) isCe= (1/N)PiCe(i).
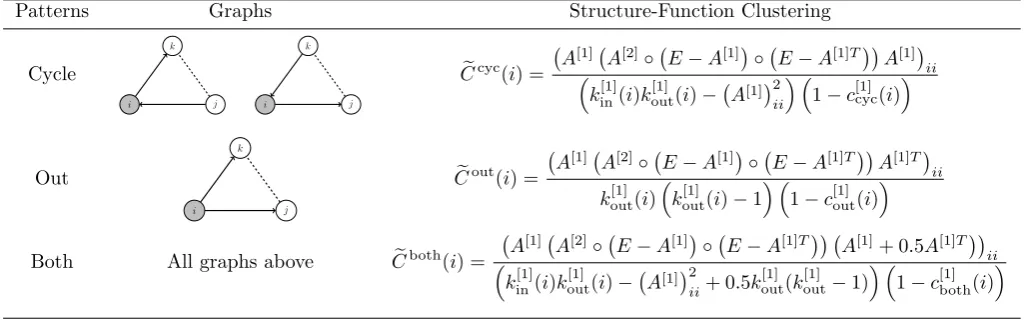
Our definition treats all possible directed triangles equivalently. Of particular interest here, however, are the distinct network properties that emerge by consideration of different structural connectivity motifs since they have been shown to both enrich and diversify the dynamical landscape of synchronised cortical states [37]. Analogously to [36] these may be characterised by considering a single nodek, with neighboursi,j; in the duplex under consider-ation these are (i)cycles: a directed structural connection in layer 1 between i and j viak, closed by a functional edge in layer 2; and (ii) inward (outward): k holds two structural inward (outward) edges.
In view of our current focus on understanding structure-function relationships in a neural context, only three of the four possible triangles are of interest: cycles (of which there are two) have intuitive meaning in the context of indirect functional connectivity, whereas outward tuples correspond to the population synchrony that arises in the presence of common drive;inward structures will not be considered. Table 1 illustrates the relevant triads, together with formulæ for the corresponding clustering coefficient.
Results. – Figure 3 compares the multiplex network measures in (2) and (3) with standard normalised single-layer clustering in the functional single-layer, for a range of choices ofP, andQ. Here and throughout, presented re-sults depict measures normalised relative to that observed in a random graph (i.e. O/hOrandiandC/hCrandi). In all
cases we observe a region of (P, Q)-space in which each measure is elevated. There are two principal features: a central rectangular region, and a pair of branched tures. The boundary reflects closely the bifurcation struc-ture of (1) corresponding to an uncoupled Wilson–Cowan node (in the uncoupled case = 0), at which oscillatory solutions are created; the reduced overlap and clustering observed between the rectangular and branched structure
arises at values ofP and Qat which reduced synchrony occurs in oscillatory node dynamics [8]. Importantly, we observe in general a strong resemblance between structural and functional networks, and high clustering, when the dy-namics are close to a phase transition, in agreement with recent empirical [38, 39] and computational [25, 40] stud-ies suggesting that structure-function relations are height-ened as system dynamics approach criticality. Compari-son of Figure 3(a) and (c), however, indicates significant differences between single and multilayer clustering, ele-vated values of the latter extending over a wider region of parameter space and, in particular, being less tightly constrained to critical transition regions. These results highlight that important additional information regarding emergent structure-function relations is revealed by con-sidering networks simultaneously.
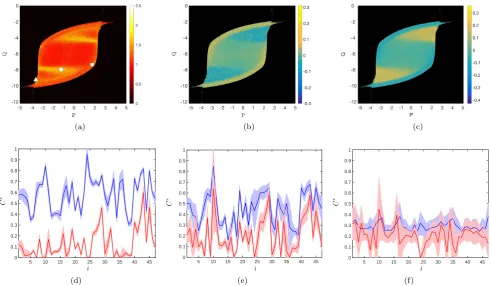
In figure 4 we consider measures of particular relevance to emergent structure-function relations within neural net-works, as defined in Table 1. Figure 4(a) illustrates our new measure eCboth (averaged over all nodes and
nor-malised), indicating considerable additional detail in com-parison to Figure 3(c). Reminiscent of that shown in Fig-ure 3(a), our new measFig-ure reflects less tightly the critical-ity structure observed in Figures 3(b,c). Figures 4(b,c) indicate the individual contributions to Ceboth from the
different network motifs under consideration (see Table 1), highlighting that the kind of structure-function rela-tionships that emerge depend strongly on the dynamical regime under consideration. In particular, we observe dis-tinct areas of parameter space in which clustering is dom-inated by either common drive or indirect functional con-nectivity. Comparison with Figure 3(b) shows that when structural and functional networks show heightened cor-respondence, Ceboth is dominated by common drive, and
(a) (b) (c)
Fig. 3: Comparison of multiplex vs. single-layer measures as a function of the basal activation parameters P and Qof the
Wilson-Cowan model (1). (a) Standard clustering of the functional layer, (b) global overlap, and (c) multiplex clustering. All measures are normalised against random surrogates; see text.
Table 1: Patterns of inter-layer triangles comprising directed structural tuples closed by an undirected functional edge, and their associated clustering coefficients. Here,◦denotes element-wise matrix multiplication,k[1]in(i) andk
[1]
out(i) the in- and out-degree
of theith node in layer one respectively, andc[1]#(i), with{#} ∈ {cycle,out,both}, the directed, single-layer clustering coefficient
as defined in [36]. Global measures are obtained by averaging over all nodes (i.e. eC#= 1/N
P
iCe#(i)).
Patterns Graphs Structure-Function Clustering
Cycle
k
j i
k
j i
e
Ccyc(i) = A
[1] A[2]◦ E−A[1]
◦ E−A[1]T
A[1]
ii
k[1]in(i)kout[1](i)− A[1]2
ii 1−c [1] cyc(i)
Out
k
j i
e
Cout(i) = A
[1] A[2]◦ E−A[1]
◦ E−A[1]T
A[1]T
ii
k[1]out(i)kout[1](i)−1 1−c[1]out(i)
Both All graphs above Ceboth(i) =
A[1] A[2]◦ E−A[1]◦ E−A[1]T A[1]+ 0.5A[1]Tii
k[1]in(i)kout[1](i)− A[1]2
ii+ 0.5k [1] out(k
[1]
out−1) 1−c [1] both(i)
not included here for brevity), indicate that transitions be-tween synchronous and asynchronous regions of parameter space are associated with corresponding transitions in the dynamical regime of (1)—in particular, critical behaviour is associated with high frequency and/or amplitude os-cillation. Our results therefore reflect the divergence of anatomy and the functional network configurations that they support [41]; moreover, they indicate that structure-function relations at, and near, criticality are strongly de-pendent on specific neural dynamics (in contrast with a growing consensus [25, 40, 42, 43] that structure-function relations can be understood predominantly in terms of criticality) and that this is especially true in the case of emergent functional connectivity and of more weakly syn-chronous neural activity.
In Figures 4(d–f) we highlight the variability in network structure for three different fixed values of the basal input parameter pair (P, Q) (as evidenced by clustering) and the local differences between C(i) and Ceboth(i). We
ob-serve strong inter-node variation and, moreover, that even
for low overall clustering particular network areas show very different properties. Comparison ofC(i) andCeboth(i)
shows similar trends, although zeros exist inCeboth(i) that
are not reflected in C(i). One of these is common across Figures 4(d–f) and reflects the local clustering of the un-derlying structural layer; the remainder arise due to syn-chronisation behaviour.
Conclusion. – In this letter, we have considered the application of multiplex network models to shed light on the emergent structure-function relations in neural sys-tems that are fundamental to the wide functional reper-toire of higher brain functions. This work provides the first demonstration that a simultaneous analysis of structure-function networks is better placed to capture emergent features and capabilities of neural systems than standard single-layer analyses.
[image:5.595.33.550.344.507.2](a) (b) (c)
5 10 15 20 25 30 35 40 45 0
0.1 0.2 0.3 0.4 0.5 0.6 0.7 0.8 0.9 1
i
C
∗
(d)
5 10 15 20 25 30 35 40 45 0
0.1 0.2 0.3 0.4 0.5 0.6 0.7 0.8 0.9 1
i
C
∗
(e)
5 10 15 20 25 30 35 40 45 0
0.1 0.2 0.3 0.4 0.5 0.6 0.7 0.8 0.9 1
i
C
∗
[image:6.595.55.547.88.374.2](f)
Fig. 4: Multiplex clustering coefficients corresponding to the neurologically relevant patterns described in Table 1. (a) Variation of eCboth/hCebothrandias a function of the basal input parameters P andQ. (b),(c) The contribution of key network motifs to the clustering Cebothexpressed via Ceboth/hCerandbothi − eC#/hCe#randifor (b) # = cyc, (c) # = out. (d)–(f) Comparison of local standard multiplex clustering C(i) (shown in blue) and Ceboth(i) (shown in red) for specific parameter values (P, Q) = (−3.5,−9.1), (−1.1,−7.8) and (1.8,−7.2) highlighted in (a) by a triangle, circle and square, respectively. The shaded region indicates a confidence interval of width one standard deviation.
with criticality of the underlying neural model. However, the detail of this relation differed significantly to that obtained from single-layer measures. Moreover, by em-ploying a novel multiplex measure, designed specifically to accommodate the divergence between anatomical brain networks and the functional behaviour they support, this work supports a deeper theoretical understanding of the neural substrates underlying cognition. Our results high-light that the form of structure-function relations differs significantly, depending on the specific dynamical regime of the neural system, thereby suggesting a more subtle dependence of network behaviour than one dominated by criticality alone.
Important future work will incorporate more general multilayered aspects of neural systems, including consid-eration of the transient nature of various dynamical brain states, in the form of time-varying multiplex structures, for example. Such studies will have relevance to neurolog-ical disorders (such as epilepsy, Alzheimer’s disease and other dementias), potentially providing additional insight to single layer analyses (see seee.g.[44, 45] for discussion of the clinical applications of network science) that have evidenced altered patterns of connectivity in both
struc-ture and function across a broad range of brain disorders.
∗ ∗ ∗
Multiplex network images were generated using MuxViz [46].
REFERENCES
[1] Newman M. E. J.,Networks: An Introduction (Oxford
University Press) 2010.
[2] Barahona M.andPecora L. M.,Phys. Rev. Lett.,89
(2002) 054101.
[3] Wu Y., Shang Y., Chen M., Zhou C.andKurths J.,
Chaos,18(2008) 037111.
[4] Wang X. F.and Chen G., IEEE Trans. Circuits Syst.
I: Fundam. Theory Appl.,49(2002) 54.
[5] O’Dea R., Crofts J. J. and Kaiser M., J. R. Soc.
Interface,10(2013) 20130016.
[6] Zhou C., Zemanov´a L., Zamora G., Hilgetag C. C.
andKurths J.,Phys. Rev. Lett.,97(2006) 238103.
[7] Lameu E. L., Borges F. S., Borges R. R., Iarosz
K. C., Caldas I. L., Batista A. M., Viana R. L.and
[8] Hlinka J.andCoombes S.,Eur. J. Neurosci.,36(2012) 2137.
[9] Henderson J. and Robinson P., Brain connect., 4
(2014) 112.
[10] Lo Y.-P., O’Dea R., Crofts J. J., Han C. E. and
Kaiser M.,Sci. Rep.,5(2015) 15397.
[11] Sporns O.,Networks of the Brain(The MIT Press) 2010.
[12] Bassett D. S., Meyer-Lindenberg A., Achard S.,
Duke T.andBullmore E.,Proc. Natl. Acad. Sci.,103
(2006) 19518.
[13] van den Heuvel M. P.and Sporns O.,Trends Cogn.
Sci.,17(2013) 683 .
[14] Meunier D., Lambiotte R. and Bullmore E. T.,
Front. Neurosci.,4(2010) 200.
[15] van den Heuvel M. P., Mandl R. C., Stam C. J.,
Kahn R. S.andPol H. E. H.,J. Neurosci.,30(2010)
15915.
[16] Crofts J. J., Higham D. J., Bosnell R., Jbabdi S.,
Matthews P. M., Behrens T. and Johansen-Berg
H.,NeuroImage,54(2011) 161.
[17] Batalle D., Eixarch E., Figueras F., Muoz-Moreno
E., Bargallo N., Illa M., Acosta-Rojas R.,
Amat-Roldan I. and Gratacos E., NeuroImage, 60 (2012)
1352 .
[18] Cabral J., Fernandes H. M., Van Hartevelt T. J.,
James A. C., Kringelbach M. L.andDeco G.,Chaos,
23(2013) 046111.
[19] Stam C., Jones B., Nolte G., Breakspear M. and
Scheltens P.,Cerebral Cortex,17(2007) 92.
[20] Supekar K., Menon V., Rubin D., Musen M. and
Greicius M. D.,PLoS Comput. Biol.,4(2008) e1000100.
[21] Liu Y., Liang M., Zhou Y., He Y., Hao Y., Song M.,
Yu C., Liu H., Liu Z.andJiang T.,Brain,131(2008)
945.
[22] Chavez M., Valencia M., Navarro V., Latora V.
andMartinerie J.,Phys. Rev. Lett.,104(2010) 118701.
[23] Park H.-J. and Friston K., Science, 342 (2013)
1238411.
[24] Wang Z., Dai Z., Gong G., Zhou C.andHe Y.,
Neu-roscientist,21(2015) 290.
[25] Stam C., Straaten E. V., Dellen E., Tewarie P.,
Gong G., Hillebrand A., Meier J.andMieghem P.,
Int. J. Psychophys.,103(2016) 149.
[26] Bianconi G.,Phys. Rev. E,87(2013) 062806.
[27] Battiston F., Nicosia V.and Latora V.,Phys. Rev.
E,89(2014) 032804.
[28] Cozzo E., Kivel¨a M., De Domenico M., Sol´
e-Ribalta A., Arenas A., G´omez S., Porter M. A.
andMoreno Y.,New J. Phys.,17(2015) 073029.
[29] K¨otter R.,Neuroinformatics,2(2004) 127.
[30] Wilson H. R.andCowan J. D.,Biophys. J.,12(1972)
1.
[31] Hoppensteadt F. C. and Izhikevich E. M., Weakly
connected neural networks Vol. 126 of Appl. Math. Sci.
(Springer Science & Business Media) 1997.
[32] Jansen B. H.andRit V. G.,Biol. Cybernet.,73(1995)
357.
[33] Grimbert F. and Faugeras O., Neural Comput., 18
(2006) 3052.
[34] Liley D. T., Bojak I., Dafilis M. P., van Veen
L., Frascoli F. and Foster B. L., Bifurcations and
state changes in the human alpha rhythm: theory and experiment in Modeling Phase Transitions in the Brain
(Springer) 2010 pp. 117–145.
[35] Mormann F., Lehnertz K., David P. and Elger
C. E.,Physica D: Nonlinear Phenom.,144(2000) 358.
[36] Fagiolo G.,Phys. Rev. E,76(2007) 026107.
[37] Gollo L. L.andBreakspear M.,Phil. Trans. R. Soc.
B,369(2014) 20130532.
[38] Haimovici A., Tagliazucchi E., Balenzuela P.and
Chialvo D. R.,Phys. Rev. Lett.,110(2013) 178101.
[39] Yu S., Yang H., Shriki O.andPlenz D.,Front. Syst.
Neurosci.,7(2013) 42.
[40] Deco G., Ponce-Alvarez A., Mantini D., Romani
G., Hagmann P. and Corbetta M., J. Neurosci., 33
(2013) 11239.
[41] Miˇsi´c B., Betzel R. F., de Reus M. A., van den
Heuvel M. P., Berman M. G., McIntosh A. R.and
Sporns O.,Cereb. Cortex,26(2016) 3285.
[42] Rubinov M., Sporns O., Thivierge J.-P.and
Break-spear M.,PLoS Comput. Biol.,7(2011) e1002038.
[43] Haimovici A., Tagliazucchi E., Balenzuela P.and
Chialvo D. R.,Phys. Rev. Lett.,110(2013) 178101.
[44] Bassett D. S.andBullmore E. T.,Curr. Opin.
Neu-rol.,22(2009) 340.
[45] Sporns O.,Dialog. Clin. Neurosci.,15(2013) 247.
[46] De Domenico M., Porter M. A. and Arenas A., J.