Proceedings of the 2019 Conference on Empirical Methods in Natural Language Processing 563
MoverScore: Text Generation Evaluating with Contextualized
Embeddings and Earth Mover Distance
Wei Zhao†, Maxime Peyrard†, Fei Liu‡, Yang Gao†, Christian M. Meyer†, Steffen Eger† †
Computer Science Department, Technische Universit¨at Darmstadt, Germany ‡
Computer Science Department, University of Central Florida, US
zhao@aiphes.tu-darmstadt.de, maxime.peyrard@epfl.ch feiliu@cs.ucf.edu, yang.gao@rhul.ac.uk
meyer@ukp.informatik.tu-darmstadt.de eger@aiphes.tu-darmstadt.de
Abstract
A robust evaluation metric has a profound im-pact on the development of text generation sys-tems. A desirable metric compares system out-put against references based on their seman-tics rather than surface forms. In this paper we investigate strategies to encode system and reference texts to devise a metric that shows a high correlation with human judgment of text quality. We validate our new metric, namely MoverScore, on a number of text generation tasks including summarization, machine trans-lation, image captioning, and data-to-text gen-eration, where the outputs are produced by a variety of neural and non-neural systems. Our findings suggest that metrics combining contextualized representations with a distance measure perform the best. Such metrics also demonstrate strong generalization capability across tasks. For ease-of-use we make our metrics available as web service.1
1 Introduction
The choice of evaluation metric has a significant impact on the assessed quality of natural language outputs generated by a system. A desirable met-ric assigns a single, real-valued score to the sys-tem output by comparing it with one or more ref-erence texts for content matching. Many natural language generation (NLG) tasks can benefit from robust and unbiased evaluation, including text-to-text (machine translation and summarization), data-to-text (response generation), and image-to-text (captioning) (Gatt and Krahmer,2018). With-out proper evaluation, it can be difficult to judge on system competitiveness, hindering the develop-ment of advanced algorithms for text generation.
It is an increasingly pressing priority to develop better evaluation metrics given the recent advances in neural text generation. Neural models provide
1Our code is publicly available athttp://tiny.cc/vsqtbz
the flexibility to copy content from source text as well as generating unseen words (See et al.,2017). This aspect is hardly covered by existing metrics. With greater flexibility comes increased demand for unbiased evaluation. Diversity-promoting ob-jectives make it possible to generate diverse nat-ural language descriptions (Li et al.,2016; Wise-man et al., 2018). But standard evaluation met-rics including BLEU (Papineni et al., 2002) and ROUGE (Lin,2004) compute the scores based pri-marily on n-gram co-occurrence statistics, which are originally proposed for diagnostic evaluation of systems but not capable of evaluating text qual-ity (Reiter,2018), as they are not designed to mea-sure if, and to what extent, the system and refer-ence texts with distinct surface forms have con-veyed the same meaning. Recent effort on the ap-plicability of these metrics reveals that while com-pelling text generation system ascend on standard metrics, the text quality of system output is still hard to be improved (B¨ohm et al.,2019).
Our goal in this paper is to devise an auto-mated evaluation metric assigning a single holistic score to any system-generated text by comparing it against human references for content matching. We posit that it is crucial to provide a holistic mea-sure attaining high correlation with human judg-ments so that various neural and non-neural text generation systems can be compared directly. In-tuitively, the metric assigns a perfect score to the system text if it conveys the same meaning as the reference text. Any deviation from the reference content can then lead to a reduced score, e.g., the system text contains more (or less) content than the reference, or the system produces ill-formed text that fails to deliver the intended meaning.
multiple natural language generation tasks. Our new metric quantifies the semantic distance be-tween system and reference texts by harnessing the power of contextualized representations ( Pe-ters et al.,2018;Devlin et al.,2018) and a power-ful distance metric (Rubner et al.,2000) for better content matching. Our contributions can be sum-marized as follows:
• We formulate the problem of evaluating genera-tion systems as measuring the semantic distance between system and reference texts, assuming powerful continuous representations can encode any type of semantic and syntactic deviations.
• We investigate the effectiveness of existing con-textualized representations and Earth Mover’s Distance (Rubner et al., 2000) for comparing system predictions and reference texts, lead-ing to our new automated evaluation metric that achieves high correlation with human judg-ments of text quality.
• Our metric outperforms or performs compara-bly to strong baselines on four text generation tasks including summarization, machine trans-lation, image captioning, and data-to-text gen-eration, suggesting this is a promising direction moving forward.
2 Related Work
It is of fundamental importance to design evalua-tion metrics that can be applied to natural language generation tasks of similar nature, including sum-marization, machine translation, data-to-text gen-eration, image captioning, and many others. All these tasks involve generating texts of sentence or paragraph length. The system texts are then com-pared with one or more reference texts of similar length for semantic matching, whose scores indi-cate how well the systems perform on each task. In the past decades, however, evaluation of these natural language generation tasks has largely been carried out independently within each area.
Summarization A dominant metric for summa-rization evaluation is ROUGE (Lin,2004), which measures the degree of lexical overlap between a system summary and a set of reference summaries. Its variants consider overlap of unigrams (-1), bi-grams (-2), unigrams and skip bigrams with a max-imum gap of 4 words (-SU4), longest common sub-sequences (-L) and its weighted version (-W-1.2), among others. Metrics such as Pyramid (Nenkova and Passonneau,2004) and BE (Hovy et al.,2006;
Tratz and Hovy, 2008) further compute matches of content units, e.g., (head-word, modifier) tu-ples, that often need to be manually extracted from reference summaries. These metrics achieve good correlations with human judgments in the past. However, they are not general enough to ac-count for the relatedness between abstractive sum-maries and their references, as a system abstract can convey the same meaning using different sur-face forms. Furthermore, large-scale summariza-tion datasets such as CNN/Daily Mail (Hermann et al.,2015) and Newsroom (Grusky et al.,2018) use asingle referencesummary, making it harder to obtain unbiased results when only lexical over-lap is considered during summary evaluation.
Machine Translation A number of metrics are commonly used in MT evaluation. Most of these metrics compare system and reference translations based on surface forms such as word/character n-gram overlaps and edit distance, but not the meanings they convey. BLEU (Papineni et al., 2002) is a precision metric measuring how well a system translation overlaps with human reference translations using n-gram co-occurrence statistics. Other metrics include SentBLEU, NIST, chrF, TER, WER, PER, CDER, and METEOR (Lavie and Agarwal,2007) that are used and described in the WMT metrics shared task (Bojar et al.,2017; Ma et al.,2018). RUSE (Shimanaka et al.,2018) is a recent effort to improve MT evaluation by train-ing sentence embeddtrain-ings on large-scale data ob-tained in other tasks. Additionally, preprocessing reference texts is crucial in MT evaluation, e.g., normalization, tokenization, compound splitting, etc. If not handled properly, different preprocess-ing strategies can lead to inconsistent results uspreprocess-ing word-based metrics (Post,2018).
synonym matching over scene graphs. Novikova et al. (2017) examine a large number of word- and grammar-based metrics and demonstrate that they only weakly reflect human judgments of system outputs generated by data-driven, end-to-end nat-ural language generation systems.
Metrics based on Continuous Representations
Moving beyond traditional metrics, we envision a new generation of automated evaluation metrics comparing system and reference texts based on se-mantics rather than surface forms to achieve better correlation with human judgments. A number of previous studies exploit static word embeddings (Ng and Abrecht, 2015; Lo, 2017) and trained classifers (Peyrard et al.,2017;Shimanaka et al., 2018) to improve semantic similarity estimation, replacing lexical overlaps.
In contemporaneous work, Zhang et al. (2019) describe a method comparing system and refer-ence texts for semantic similarity leveraging the BERT representations (Devlin et al.,2018), which can be viewed as a special case of our metrics and will be discussed in more depth later. More re-cently,Clark et al.(2019) present a semantic met-ric relying on sentence mover’s similarity and the ELMo representations (Peters et al., 2018) and apply them to summarization and essay scoring. Mathur et al. (2019) introduce unsupervised and supervised metrics based on the BERT represen-tations to improve MT evaluation, while Peyrard (2019a) provides a composite score combining re-dundancy, relevance and informativeness to im-prove summary evaluation.
In this paper, we seek to accurately measure the (dis)similarity between system and reference texts drawing inspiration from contextualized represen-tations and Word Mover’s Distance (WMD; Kus-ner et al., 2015). WMD finds the “traveling dis-tance” of moving from the word frequency distri-bution of the system text to that of the reference, which is essential to capture the (dis)similarity be-tween two texts. Our metrics differ from the con-temporaneous work in several facets: (i) we ex-plore the granularity of embeddings, leading to two variants of our metric, word mover and sen-tence mover; (ii) we investigate the effectiveness of diverse pretrained embeddings and finetuning tasks; (iii) we study the approach to consolidate layer-wise information within contextualized em-beddings; (iii) our metrics demonstrate strong gen-eralization capability across four tasks, oftentimes outperforming the supervised ones. We now
de-scribe our method in detail.
3 Our MoverScore Meric
We have motivated the need for better metrics ca-pable of evaluating disparate NLG tasks. We now describe our metric, namely MoverScore, built upon a combination of (i) contextualized repre-sentations of system and reference texts and (ii) a distance between these representations measur-ing the semantic distance between system outputs and references. It is particularly important for a metric to not only capture the amount of shared content between two texts, i.e., intersect(A,B), as is the case with many semantic textual similarity measures (Peters et al.,2018;Devlin et al.,2018); but also to accurately reflect to what extent the system text hasdeviated from the reference, i.e.,
union(A,B)-intersect(A,B), which is the intuition be-hind using a distance metric.
3.1 Measuring Semantic Distance
Letx = (x1, . . . ,xm) be a sentence viewed as a
sequence of words. We denote byxnthe sequence ofn-grams of x(i.e.,x1 = xis the sequence of words and x2 is the sequence of bigrams). Fur-thermore, letfxn ∈ R
|xn|
+ be a vector of weights,
one weight for each n-gram of xn. We can as-sumefTxn1 = 1, makingfxn a distribution over
n-grams. Intuitively, the effect of somen-grams like those including function words can be down-played by giving them lower weights, e.g., using Inverse Document Frequency (IDF).
Word Mover’s Distance (WMD) (Kusner et al., 2015), a special case of Earth Mover’s Dis-tance (Rubner et al., 2000), measures semantic distance between texts by aligning semantically similar words and finding the amount of flow trav-eling between these words. It was shown use-ful for text classification and textual similarity tasks (Kusner et al.,2015). Here, we formulate a generalization operating on n-grams. Let x and y be two sentences viewed as sequences of n -grams: xn andyn. If we have a distance metric
dbetweenn-grams, then we can define the trans-portation costmatrixCsuch thatCij =d(xni,ynj) is the distance between thei-th n-gram of xand thej-thn-gram ofy. The WMD between the two sequences ofn-grams xnandynwith associated
n-gram weightsfxn andfynis then given by:
WMD(xn,yn) := min
F∈R|xn|×|yn|
hC,Fi,
whereF is thetransportation flowmatrix withFij denoting the amount of flow traveling from thei -thn-gram xni inxnto the j-th n-gram ynj inyn. Here,hC,Fidenotes the sum of all matrix entries of the matrixC F, wheredenotes element-wise multiplication. Then WMD(xn,yn) is the minimal transportation cost between xn and yn wheren-grams are weighted byfxn andfyn.
In practice, we compute the Euclidean dis-tance between the embedding representations of
n-grams: d(xni,ynj) = ||E(xni)−E(ynj)||2where E is the embedding function which maps an n -gram to its vector representation. Usually, static
word embeddings like word2vec are used to com-pute E but these cannot capture word order or compositionality. Alternatively, we investigate contextualized embeddings like ELMo and BERT because they encode information about the whole sentence into each word vector.
We compute the n-gram embeddings as the weighted sum over its word embeddings. For-mally, ifxni = (xi, . . . ,xi+n−1)is thei-thn-gram
from sentencex, its embedding is given by:
E(xni) =
i+n−1 X
k=i
idf(xk)·E(xk) (1)
where idf(xk) is the IDF of word xk computed from all sentences in the corpus and E(xk) is its word vector. Furthermore, the weight associated to then-gramxni is given by:
fxn i =
1
Z
i+n−1 X
k=i
idf(xk) (2)
whereZis a normalizing constant s.t. fTxn1= 1,
In the limiting case where n is larger than the sentence’s size,xncontains only onen-gram: the whole sentence. Then WMD(xn,yn) reduces to computing the distance between the two sentence embeddings, namely Sentence Mover’s Distance (SMD), denoted as:
SMD(xn,yn) :=||E(xlx
1 )−E(y
ly
1)||
wherelxandlyare the size of sentences.
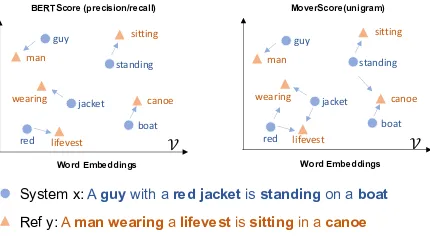
Hard and Soft Alignments In contempora-neous work, BERTScore (Zhang et al.,2019) also models the semantic distance between system and reference texts for evaluating text generation sys-tems. As shown in Figure 1, BERTScore (pre-cision/recall) can be intuitively viewed as hard
System x:A guywith a red jacketis standingon a boat
guy man
wearing
lifevest
sitting
canoe
red
jacket standing
boat
guy man
wearing
lifevest
sitting
canoe
red
jacket standing
boat
Word Embeddings Word Embeddings
Ref y:A man wearinga lifevestis sittingin a canoe
𝒱 𝒱
[image:4.595.309.524.61.179.2]BERTScore (precision/recall) MoverScore(unigram)
Figure 1: An illustration of MoverScore and BERTScore.
alignments (one-to-one) for words in a sentence pair, where each word in one sequence travels to the most semantically similar word in the other sequence. In contrast, MoverScore goes beyond BERTScore as it relies on soft alignments (many-to-one) and allows to map semantically related words in one sequence to the respective word in the other sequence by solving a constrained opti-mization problem: finding the minimum effort to transform between two texts.
The formulation of Word Mover’s Distance pro-vides an important possibility to bias the metric towards precision or recall by using an asymmet-ric transportation cost matrix, which bridges a gap between MoverScore and BERTScore:
Proposition 1 BERTScore (precision/recall) can be represented as a (non-optimized) Mover Dis-tance hC,Fi, where C is a transportation cost matrix based on BERT andF is a uniform trans-portation flow matrix.2
3.2 Contextualized Representations
The task formulation naturally lends itself to deep contextualized representations for inducing word vectorsE(xi). Despite the recent success of multi-layer attentive neural architectures (Devlin et al., 2018;Peters et al.,2018), consolidating layer-wise information remains an open problem as different layers capture information at disparate scales and task-specific layer selection methods may be lim-ited (Liu et al.,2018,2019). Tenney et al.(2019) found that a scalar mix of output layers trained from task-dependent supervisions would be effec-tive in a deep transformer-based model. Instead, we investigate aggregation functions to consol-idate layer-wise information, forming stationary representations of words without supervision.
Consider a sentencexpassed through contextu-alized encoders such as ELMo and BERT withL
layers. Each layer of the encoders produces a
tor representation for each word xi inx. We de-note byzi,l∈Rdthe representation given by layer
l, a d-dimensional vector. Overall, xi receivesL
different vectors(zi,1, . . . ,zi,L). An aggregation
φmaps theseLvectors to one final vector:
E(xi) =φ(zi,1, . . . ,zi,L) (3)
where E(xi) is the aggregated representation of the word xi.
We study two alternatives for φ: (i) the con-catenation of power means (R¨uckl´e et al., 2018) as a generalized pooling mechanism, and (ii) a routing mechanism for aggregation (Zhao et al., 2018, 2019). We relegate the routing method to appendix, as it does not yield better results than power means.
Power Means Power means is an effective gen-eralization of pooling techniques for aggregating information. It computes a non-linear average of a set of values with an exponentp(Eq. (4)). Follow-ingR¨uckl´e et al.(2018), we exploit power means to aggregate vector representations(zi,l)Ll=1
per-taining to thei-th word from all layers of a deep neural architecture. Let p ∈ R∪ {±∞}, the p -mean of(zi,1, . . . ,zi,L)is:
h(ip) = z
p
i,1+· · ·+z
p i,L
L
!1/p
∈Rd (4)
where exponentiation is applied elementwise. This generalized form can induce common named means such as arithmetic mean (p = 1) and geo-metric mean (p = 0). In extreme cases, a power mean reduces to the minimum value of the set when p = −∞, and the maximum value when
p = +∞. The concatenation of p-mean vectors we use in this paper is denoted by:
E(xi) =h(ip1)⊕ · · · ⊕h
(pK)
i (5)
where⊕is vector concatenation;{p1, . . . , pK}are exponent values, and we use K = 3 with p = 1,±∞in this work.
3.3 Summary of MoverScore Variations
We investigate our MoverScore along four dimen-sions: (i) the granularity of embeddings, i.e., the size ofnforn-grams, (ii) the choice of pretrained embedding mechanism, (iii) the fine-tuning task used for BERT3(iv) the aggregation technique (p -means or routing) when applicable.
3
ELMo usually requires heavy layers on the top, which restricts the power of fine-tuning tasks for ELMo.
Granularity We usedn= 1andn= 2as well as full sentences (n=size of the sentence).
Embedding Mechanism We obtained word em-beddings from three different methods:static em-bedding with word2vec as well as contextualized embedding with ELMo and BERT. Ifn > 1, n -gram embeddings are calculated by Eq. (1). Note that they represent sentence embeddings when
n=size of the sentence.
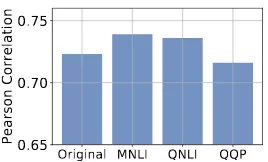
Fine-tuning Tasks Natural Language Inference (NLI) and paraphrasing pose high demands in understanding sentence meaning. This moti-vated us to fine-tune BERT representations on two NLI datasets, MultiNLI and QANLI, and one Paraphrase dataset, QQP—the largest datasets in GLUE (Wang et al., 2018). We fine-tune BERT on each of these, yielding different contextualized embeddings for our general evaluation metrics.
Aggregation For ELMo, we aggregate word representations given by all three ELMo layers, usingp-means or routing (see the appendix). Word representations in BERT are aggregated from the last five layers, usingp-means or routing since the representations in the initial layers are less suited for use in downstream tasks (Liu et al.,2019).
4 Empirical Evaluation
In this section, we measure the quality of dif-ferent metrics on four tasks: machine transla-tion,text summarization,image captioningand di-alogue generation. Our major focus is to study the correlation between different metrics and human judgment. We employ two text encoders to embed
n-grams: BERTbase, which uses a 12-layer
trans-former, and ELMOoriginal, which uses a 3-layer
BiLSTM. We use Pearson’srand Spearman’sρto measure the correlation. We consider two variants of MoverScore: word moverandsentence mover, described below.
Word Mover We denote our word mover
notation containing four ingredients as: WMD-Granularity+Embedding+Finetune+Aggregation. For example, WMD-1+BERT+MNLI+PMEANS represents the semantic metric using word mover distance where unigram-based word embeddings fine-tuned on MNLI are aggregated byp-means.
Sentence Mover We denote our sentence mover notation with three ingredients as:
metric using sentence mover distance where two sentence embeddings are computed as the weighted sum over their word2vec embeddings by Eq. (1).
Baselines We select multiple strong baselines for each task for comparison: SentBLEU, ME-TEOR++ (Guo et al., 2018), and a supervised metric RUSE for machine translation; ROUGE-1 and ROUGE-2 and a supervised metric Sbest3
(Peyrard et al., 2017) for text summarization; BLEU and METEOR for dialogue response gen-eration, CIDEr, SPICE, METEOR and a super-vised metric LEIC (Cui et al.,2018) for image cap-tioning. We also report BERTScore (Zhang et al., 2019) for all tasks (see§2). Due to the page limit, we only compare with the strongest baselines, the rest can be found in the appendix.
4.1 Machine Translation
Data We obtain the source language sentences, their system and reference translations from the WMT 2017 news translation shared task (Bojar et al.,2017). We consider 7 language pairs: from German (de), Chinese (zh), Czech (cs), Latvian (lv), Finnish (fi), Russian (ru), and Turkish (tr), resp. to English. Each language pair has approxi-mately 3,000 sentences, and each sentence has one reference translation and multiple system transla-tions generated by participating systems. For each system translation, at least 15 human assessments are independently rated for quality.
Results Table 1: In all language pairs, the best correlation is achieved by our word mover met-rics that use a BERT pretrained on MNLI as the embedding generator and PMeans to aggregate the embeddings from different BERT layers, i.e., WMD-1/2+BERT+MNLI+PMeans. Note that our unsupervised word mover metrics even outper-forms RUSE, a supervised metric. We also find that our word mover metrics outperforms the sen-tence mover. We conjecture that important infor-mation is lost in such a sentence representation while transforming the whole sequence of word vectors into one sentence embedding by Eq. (1).
4.2 Text Summarization
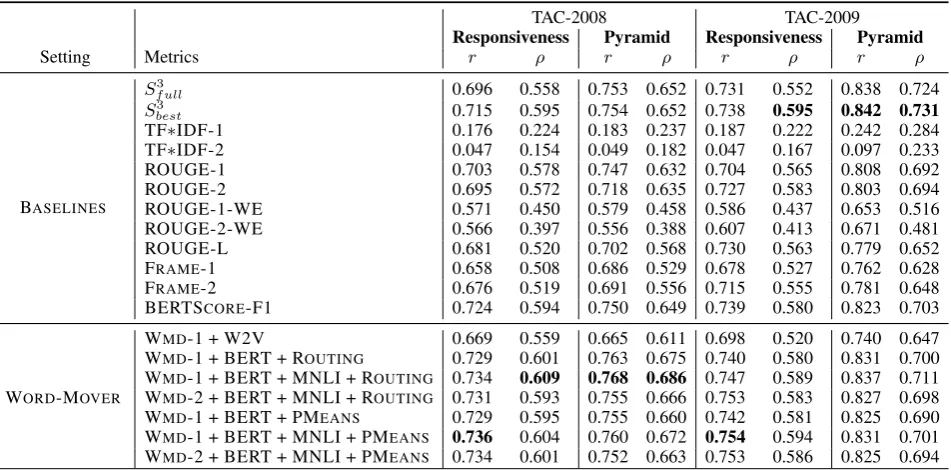
We use two summarization datasets from the Text Analysis Conference (TAC)4: TAC-2008 and TAC-2009, which contain 48 and 44clusters, re-spectively. Each cluster includes 10 news articles
4http://tac.nist.gov
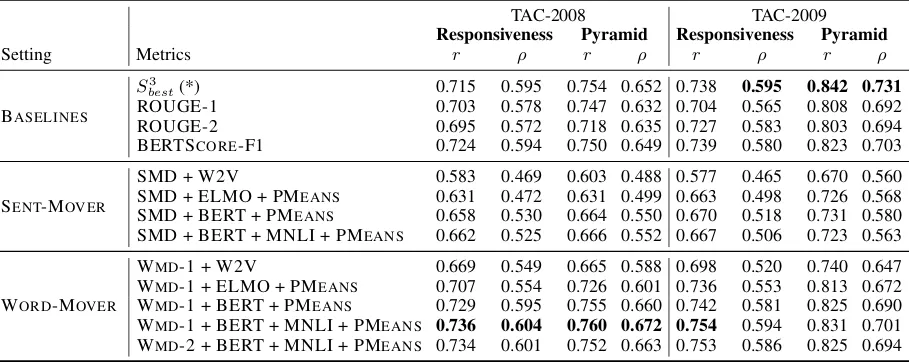
(on the same topic), four reference summaries, and 57 (in TAC-2008) or 55 (in TAC-2009) tem summaries generated by the participating sys-tems. Each summary (either reference or system) has fewer than 100 words, and receives two human judgment scores: thePyramidscore (Nenkova and Passonneau,2004) and theResponsivenessscore. Pyramid measures how many important semantic content units in the reference summaries are cov-ered by the system summary, while Responsive-ness measures how well a summary responds to the overall quality combining both content and lin-guistic quality.
Results Tables 2: We observe that lexical met-rics like ROUGE correlate above-moderate on TAC 2008 and 2009 datasets. In contrast, these metrics perform poorly on other tasks like Di-alogue Generation (Novikova et al., 2017) and Image Captioning (Anderson et al., 2016). Ap-parently, strict matches on surface forms seems reasonable for extractivesummarization datasets. However, we still see that our word mover met-rics, i.e., WMD-1+BERT+MNLI+PMeans, per-form better than or come close to even the super-vised metricSbest3 .
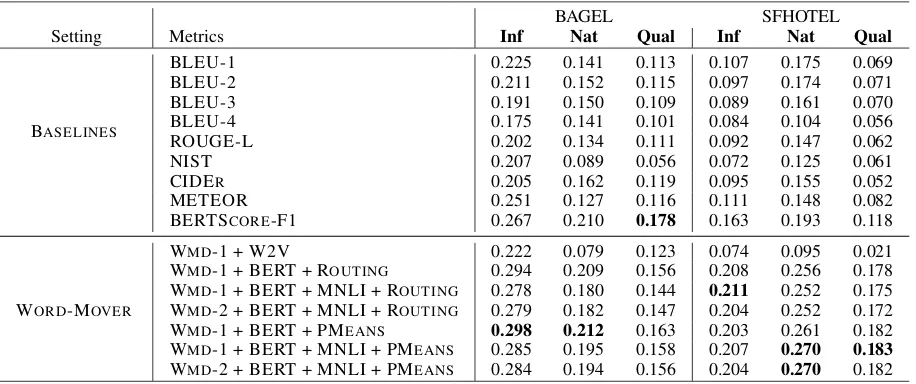
4.3 Data-to-text Generation
We use two task-oriented dialogue datasets: BAGEL (Mairesse et al., 2010) and SFHOTEL (Wen et al., 2015), which contains 202 and 398 instances of Meaning Representation (MR). Each MR instance includes multiple references, and roughly two system utterances generated by dif-ferent neural systems. Each system utterance re-ceives three human judgment scores: informa-tiveness,naturalnessandqualityscore (Novikova et al.,2017). Informativeness measures how much information a system utterance provides with re-spect to an MR. Naturalness measures how likely a system utterance is generated by native speak-ers. Quality measures how well a system utterance captures fluency and grammar.
Direct Assessment
Setting Metrics cs-en de-en fi-en lv-en ru-en tr-en zh-en Average
BASELINES
METEOR++ 0.552 0.538 0.720 0.563 0.627 0.626 0.646 0.610 RUSE(*) 0.624 0.644 0.750 0.697 0.673 0.716 0.691 0.685 BERTSCORE-F1 0.670 0.686 0.820 0.710 0.729 0.714 0.704 0.719
SENT-MOVER
SMD+ W2V 0.438 0.505 0.540 0.442 0.514 0.456 0.494 0.484 SMD+ ELMO + PMEANS 0.569 0.558 0.732 0.525 0.581 0.620 0.584 0.595 SMD+ BERT + PMEANS 0.607 0.623 0.770 0.639 0.667 0.641 0.619 0.652 SMD+ BERT + MNLI + PMEANS 0.616 0.643 0.785 0.660 0.664 0.668 0.633 0.667
WORD-MOVER
WMD-1 + W2V 0.392 0.463 0.558 0.463 0.456 0.485 0.481 0.471 WMD-1 + ELMO + PMEANS 0.579 0.588 0.753 0.559 0.617 0.679 0.645 0.631 WMD-1 + BERT + PMEANS 0.662 0.687 0.823 0.714 0.735 0.734 0.719 0.725 WMD-1 + BERT + MNLI + PMEANS 0.670 0.708 0.835 0.746 0.738 0.762 0.744 0.743
[image:7.595.75.530.249.430.2]WMD-2 + BERT + MNLI + PMEANS 0.679 0.710 0.832 0.745 0.736 0.763 0.740 0.743
Table 1: Absolute Pearson correlations with segment-level human judgments in 7 language pairs on WMT17 dataset.
TAC-2008 TAC-2009
Responsiveness Pyramid Responsiveness Pyramid
Setting Metrics r ρ r ρ r ρ r ρ
BASELINES
Sbest3 (*) 0.715 0.595 0.754 0.652 0.738 0.595 0.842 0.731
ROUGE-1 0.703 0.578 0.747 0.632 0.704 0.565 0.808 0.692 ROUGE-2 0.695 0.572 0.718 0.635 0.727 0.583 0.803 0.694 BERTSCORE-F1 0.724 0.594 0.750 0.649 0.739 0.580 0.823 0.703
SENT-MOVER
SMD + W2V 0.583 0.469 0.603 0.488 0.577 0.465 0.670 0.560 SMD + ELMO + PMEANS 0.631 0.472 0.631 0.499 0.663 0.498 0.726 0.568 SMD + BERT + PMEANS 0.658 0.530 0.664 0.550 0.670 0.518 0.731 0.580 SMD + BERT + MNLI + PMEANS 0.662 0.525 0.666 0.552 0.667 0.506 0.723 0.563
WORD-MOVER
WMD-1 + W2V 0.669 0.549 0.665 0.588 0.698 0.520 0.740 0.647 WMD-1 + ELMO + PMEANS 0.707 0.554 0.726 0.601 0.736 0.553 0.813 0.672 WMD-1 + BERT + PMEANS 0.729 0.595 0.755 0.660 0.742 0.581 0.825 0.690 WMD-1 + BERT + MNLI + PMEANS 0.736 0.604 0.760 0.672 0.754 0.594 0.831 0.701 WMD-2 + BERT + MNLI + PMEANS 0.734 0.601 0.752 0.663 0.753 0.586 0.825 0.694
Table 2: Pearsonrand Spearmanρcorrelations with summary-level human judgments on TAC 2008 and 2009.
4.4 Image Captioning
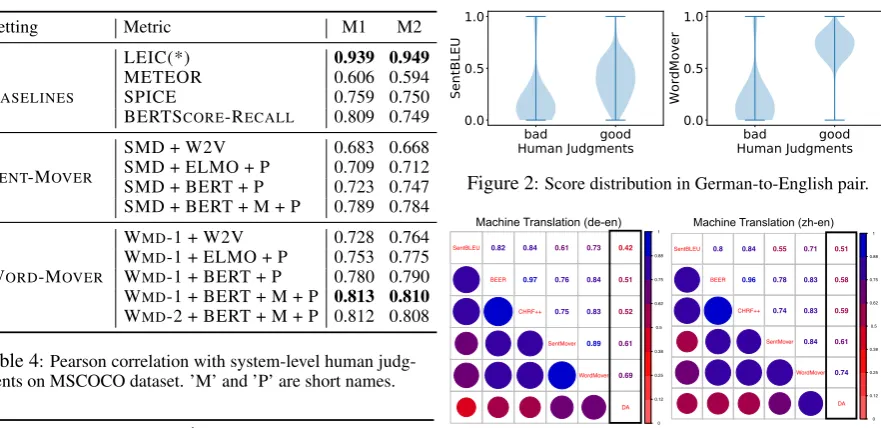
We use a popular image captioning dataset: MS-COCO (Lin et al., 2014), which contains 5,000 images. Each image includes roughly five refer-ence captions, and 12 system captions generated by the participating systems from 2015 COCO Captioning Challenge. For the system-level hu-man correlation, each system receives five huhu-man judgment scores: M1, M2, M3, M4, M5 ( Ander-son et al., 2016). The M1 and M2 scores mea-sure overall quality of the captions while M3, M4 and M5 scores measure correctness, detailedness and saliency of the captions. FollowingCui et al. (2018), we compare the Pearson correlation with two system-level scores: M1 and M2, since we fo-cus on studying metrics for the overall quality of the captions, leaving metrics understanding cap-tions in different aspects (correctness, detailedness and saliency) to future work.
Results Table 4: Word mover metrics outper-form all baselines except for the supervised metric
LEIC, which uses more information by consider-ingbothimages and texts.
4.5 Further Analysis
Hard and Soft Alignments BERTScore is the harmonic mean of BERTScore-Precision and BERTScore-Recall, where both two can be de-composed as a combination of “Hard Mover Dis-tance” (HMD) and BERT (see Prop.1).
BAGEL SFHOTEL Setting Metrics Inf Nat Qual Inf Nat Qual
BASELINES
BLEU-1 0.225 0.141 0.113 0.107 0.175 0.069 BLEU-2 0.211 0.152 0.115 0.097 0.174 0.071 METEOR 0.251 0.127 0.116 0.111 0.148 0.082 BERTSCORE-F1 0.267 0.210 0.178 0.163 0.193 0.118
SENT-MOVER
SMD + W2V 0.024 0.074 0.078 0.022 0.025 0.011 SMD + ELMO + PMEANS 0.251 0.171 0.147 0.130 0.176 0.096 SMD + BERT + PMEANS 0.290 0.163 0.121 0.192 0.223 0.134 SMD + BERT + MNLI + PMEANS 0.280 0.149 0.120 0.205 0.239 0.147
WORD-MOVER
WMD-1 + W2V 0.222 0.079 0.123 0.074 0.095 0.021 WMD-1 + ELMO + PMEANS 0.261 0.163 0.148 0.147 0.215 0.136 WMD-1 + BERT + PMEANS 0.298 0.212 0.163 0.203 0.261 0.182 WMD-1 + BERT + MNLI + PMEANS 0.285 0.195 0.158 0.207 0.270 0.183
WMD-2 + BERT + MNLI + PMEANS 0.284 0.194 0.156 0.204 0.270 0.182
Table 3: Spearman correlation with utterance-level human judgments for BAGEL and SFHOTEL datasets.
Setting Metric M1 M2
BASELINES
LEIC(*) 0.939 0.949
METEOR 0.606 0.594 SPICE 0.759 0.750 BERTSCORE-RECALL 0.809 0.749
SENT-MOVER
SMD + W2V 0.683 0.668 SMD + ELMO + P 0.709 0.712 SMD + BERT + P 0.723 0.747 SMD + BERT + M + P 0.789 0.784
WORD-MOVER
WMD-1 + W2V 0.728 0.764 WMD-1 + ELMO + P 0.753 0.775 WMD-1 + BERT + P 0.780 0.790 WMD-1 + BERT + M + P 0.813 0.810
[image:8.595.82.523.264.478.2]WMD-2 + BERT + M + P 0.812 0.808
Table 4: Pearson correlation with system-level human judg-ments on MSCOCO dataset. ’M’ and ’P’ are short names.
Metrics cs-en de-en fi-en lv-en
RUSE 0.624 0.644 0.750 0.697
HMD-F1 + BERT 0.655 0.681 0.821 0.712 HMD-RECALL+ BERT 0.651 0.658 0.788 0.681 HMD-PREC+ BERT 0.624 0.669 0.817 0.707
WMD-UNIGRAM+ BERT 0.651 0.686 0.823 0.710 WMD-BIGRAM+ BERT 0.665 0.688 0.821 0.712
Table 5: Comparison on hard and soft alignments.
Distribution of Scores In Figure 2, we take a closer look at sentence-level correlation in MT. Results reveal that the lexical metric SENTBLEU can correctly assign lower scores to system trans-lations of low quality, while it struggles in judg-ing system translations of high quality by assign-ing them lower scores. Our findassign-ing agrees with the observations found in Chaganty et al.(2018); Novikova et al. (2017): lexical metrics correlate better with human judgments on texts of low qual-ity than high qualqual-ity. Peyrard (2019b) further show that lexical metrics cannot be trusted because
bad good Human Judgments 0.0 0.5 1.0 SentBLEU bad good Human Judgments 0.0 0.5 1.0 WordMover
Figure 2: Score distribution in German-to-English pair.
1 0.82 1 0.84 0.97 1 0.61 0.76 0.75 1 0.73 0.84 0.83 0.89 1 0.42 0.51 0.52 0.61 0.69 1 0 0.12 0.25 0.38 0.5 0.62 0.75 0.88 1 SentBLEU BEER CHRF++ SentMover WordMover DA
Machine Translation (de−en) Machine Translation (de−en)
Machine Translation (de-en)
1 0.8 1 0.84 0.96 1 0.55 0.78 0.74 1 0.71 0.83 0.83 0.84 1 0.51 0.58 0.59 0.61 0.74 1 0 0.12 0.25 0.38 0.5 0.62 0.75 0.88 1 SentBLEU BEER CHRF++ SentMover WordMover DA Machine Translation (zh−en) Machine Translation (zh−en)
[image:8.595.71.299.474.565.2]Machine Translation (zh-en)
Figure 3: Correlation in similar language (de-en) and distant language (zh-en) pair, where bordered area shows correla-tions between human assessment and metrics, the rest shows inter-correlations across metrics and DA is direct assessment rated by language experts.
they strongly disagree on high-scoring system out-puts. Importantly, we observe that our word mover metric combining BERT can clearly distinguish texts of two polar qualities.
Correlation Analysis In Figure 3, we ob-serve existing metrics for MT evaluation attaining medium correlations (0.4-0.5) with human judg-ments but high inter-correlations between them-selves. In contrast, our metrics can attain high correlations (0.6-0.7) with human judgments, per-forming robust across different language pairs. We believe that our improvements come from clearly distinguishing translations that fall on two ex-tremes.
com-Original MNLI QNLI QQP
0.65 0.70 0.75
[image:9.595.115.249.59.140.2]Pearson Correlation
Figure 4: Correlation is averaged over 7 language pairs.
pares Pearson correlations with our word mover metrics combining BERT fine-tuned on three dif-ferent tasks. We observe that fine-tuning on closely related tasks improves correlations, espe-cially fine-tuning on MNLI leads to an impressive improvement by 1.8 points on average.
4.6 Discussions
We showed that our metric combining contextual-ized embeddings and Earth Mover’s Distance out-performs strong unsupervised metrics on 3 out of 4 tasks, i.e., METEOR++ on machine translation by 5.7 points, SPICE on image captioning by 3.0 points, and METEOR on dialogue response gen-eration by 2.2 points. The best correlation we achieved is combining contextualized word em-beddings and WMD, which even rivals or exceeds SOTA task-dependent supervised metrics across different tasks. Especially in machine translation, our word mover metric pushes correlations in ma-chine translation to 74.3 on average (5.8 points over the SOTA supervised metric and 2.4 points over contemporaneous BERTScore). The major improvements come from contextualized BERT embeddings rather than word2vec and ELMo, and from fine-tuning BERT on large NLI datasets. However, we also observed that soft alignments (MoverScore) marginally outperforms hard align-ments (BERTScore). Regarding the effect of n -grams in word mover metrics, uni-grams slightly outperforms bigrams on average. For the effect of aggregation functions, we suggested effective techniques for layer-wise consolidations, namely
p-means and routing, both of which are close to the performance of the best layer and on par with each other (see the appendix).
5 Conclusion
We investigated new unsupervised evaluation met-rics for text generation systems combining contex-tualized embeddings with Earth Mover’s Distance. We experimented with two variants of our metric, sentence mover and word mover. The latter has
demonstrated strong generalization ability across four text generation tasks, oftentimes even outper-forming supervised metrics. Our metric provides a promising direction towards a holistic metric for text generation and a direction towards more ‘human-like’ (Eger et al.,2019) evaluation of text generation systems.
In future work, we plan to avoid the need for costly human references in the evaluation of text generation systems, and instead base evalua-tion scores on source texts and system predicevalua-tions only, which would allow for ‘next-level’, unsuper-vised (in a double sense) and unlimited evaluation (Louis and Nenkova,2013;B¨ohm et al.,2019).
Acknowledgments
We thank the anonymous reviewers for their com-ments, which greatly improved the final version of the paper. This work has been supported by the German Research Foundation as part of the Re-search Training Group Adaptive Preparation of In-formation from Heterogeneous Sources (AIPHES) at the Technische Universit¨at Darmstadt under grant No. GRK 1994/1. Fei Liu is supported in part by NSF grant IIS-1909603.
References
Peter Anderson, Basura Fernando, Mark Johnson, and Stephen Gould. 2016. SPICE: semantic proposi-tional image caption evaluation. InComputer Vision - ECCV 2016 - 14th European Conference, Amster-dam, The Netherlands, October 11-14, 2016, Pro-ceedings, Part V, pages 382–398.
Florian B¨ohm, Yang Gao, Christian M. Meyer, Ori Shapira, Ido Dagan, and Iryna Gurevych. 2019. Bet-ter rewards yield betBet-ter summaries: Learning to summarise without references. In Proceedings of the 2019 Conference on Empirical Methods in Nat-ural Language Processing, Hong Kong, China.
Ondrej Bojar, Yvette Graham, and Amir Kamran. 2017. Results of the WMT17 metrics shared task. InProceedings of the Conference on Machine Trans-lation (WMT).
Arun Chaganty, Stephen Mussmann, and Percy Liang. 2018. The price of debiasing automatic metrics in natural language evalaution. In Proceedings of the 56th Annual Meeting of the Association for Compu-tational Linguistics (Volume 1: Long Papers), pages 643–653.
the 57th Annual Meeting of the Association for Com-putational Linguistics, pages 2748–2760, Florence, Italy. Association for Computational Linguistics.
Dorin Comaniciu and Peter Meer. 2002. Mean shift:
A robust approach toward feature space analysis.
IEEE Transactions on Pattern Analysis & Machine Intelligence, (5):603–619.
Yin Cui, Guandao Yang, Andreas Veit, Xun Huang, and Serge Belongie. 2018. Learning to evaluate im-age captioning. InProceedings of the IEEE Confer-ence on Computer Vision and Pattern Recognition, pages 5804–5812.
Jacob Devlin, Ming-Wei Chang, Kenton Lee, and Kristina Toutanova. 2018. BERT: pre-training of deep bidirectional transformers for language under-standing.arXiv:1810.04805.
Steffen Eger, G¨ozde G¨ul S¸ahin, Andreas R¨uckl´e, Ji-Ung Lee, Claudia Schulz, Mohsen Mesgar, Kr-ishnkant Swarnkar, Edwin Simpson, and Iryna Gurevych. 2019. Text processing like humans do:
Visually attacking and shielding NLP systems. In
Proceedings of the 2019 Conference of the North American Chapter of the Association for Compu-tational Linguistics: Human Language Technolo-gies, Volume 1 (Long and Short Papers), pages 1634–1647, Minneapolis, Minnesota. Association for Computational Linguistics.
Albert Gatt and Emiel Krahmer. 2018. Survey of the state of the art in natural language generation: Core tasks, applications and evaluation.Journal of Artifi-cial Intelligence Research (JAIR).
Max Grusky, Mor Naaman, and Yoav Artzi. 2018. NEWSROOM: A dataset of 1.3 million summaries with diverse extractive strategies. InProceedings of the 2018 Conference of the North American Chap-ter of the Association for Computational Linguistics: Human Language Technologies (NAACL-HLT).
Yinuo Guo, Chong Ruan, and Junfeng Hu. 2018. Me-teor++: Incorporating copy knowledge into machine translation evaluation. InProceedings of the Third Conference on Machine Translation: Shared Task Papers, pages 740–745.
Karl Moritz Hermann, Tomas Kocisky, Edward Grefenstette, Lasse Espeholt, Will Kay, Mustafa Su-leyman, and Phil Blunsom. 2015. Teaching
ma-chines to read and comprehend. InProceedings of
Neural Information Processing Systems (NIPS).
Eduard Hovy, Chin-Yew Lin, Liang Zhou, and Junichi Fukumoto. 2006. Automated summarization
eval-uation with basic elements. In Proceedings of the
Fifth Conference on Language Resources and Eval-uation (LREC 2006), pages 604–611.
Matt J. Kusner, Yu Sun, Nicholas I. Kolkin, and Kil-ian Q. Weinberger. 2015.From word embeddings to document distances. InProceedings of the Interna-tional Conference on Machine Learning (ICML).
Alon Lavie and Abhaya Agarwal. 2007. Meteor: An Automatic Metric for MT Evaluation with High
Levels of Correlation with Human Judgments. In
Proceedings of the Second Workshop on Statistical Machine Translation, StatMT ’07, pages 228–231, Stroudsburg, PA, USA. Association for Computa-tional Linguistics.
Jiwei Li, Michel Galley, Chris Brockett, Jianfeng Gao, and Bill Dolan. 2016. A diversity-promoting objec-tive function for neural conversation models. In Pro-ceedings of the North American Chapter of the As-sociation for Computational Linguistics (NAACL).
Chin-Yew Lin. 2004. ROUGE: A Package for
Au-tomatic Evaluation of summaries. InProceedings
of ACL workshop on Text Summarization Branches Out, pages 74–81, Barcelona, Spain.
Tsung-Yi Lin, Michael Maire, Serge Belongie, James Hays, Pietro Perona, Deva Ramanan, Piotr Doll´ar, and C Lawrence Zitnick. 2014. Microsoft coco:
Common objects in context. InEuropean
confer-ence on computer vision, pages 740–755. Springer.
Chia-Wei Liu, Ryan Lowe, Iulian V. Serban, Michael Noseworthy, Laurent Charlin, and Joelle Pineau. 2016. How NOT to evaluate your dialogue system: An empirical study of unsupervised evaluation met-rics for dialogue response generation. In Proceed-ings of the Conference on Empirical Methods in Nat-ural Language Processing (EMNLP).
Liyuan Liu, Xiang Ren, Jingbo Shang, Xiaotao Gu, Jian Peng, and Jiawei Han. 2018. Efficient con-textualized representation: Language model pruning
for sequence labeling. InProceedings of the
Con-ference on Empirical Methods in Natural Language Processing (EMNLP).
Nelson F Liu, Matt Gardner, Yonatan Belinkov, Matthew Peters, and Noah A Smith. 2019. Linguis-tic knowledge and transferability of contextual rep-resentations.arXiv preprint arXiv:1903.08855.
Chi-kiu Lo. 2017. MEANT 2.0: Accurate semantic MT evaluation for any output language. In Proceed-ings of the Second Conference on Machine Transla-tion, WMT 2017, Copenhagen, Denmark, September 7-8, 2017, pages 589–597.
Annie Louis and Ani Nenkova. 2013. Automatically assessing machine summary content without a gold
standard. Computational Linguistics, 39(2):267–
300.
Qingsong Ma, Ondrej Bojar, and Yvette Graham. 2018.
Results of the WMT18 metrics shared task. In
Pro-ceedings of the Third Conference on Machine Trans-lation (WMT).
using graphical models and active learning. In Pro-ceedings of the 48th Annual Meeting of the Asso-ciation for Computational Linguistics, pages 1552– 1561. Association for Computational Linguistics.
Nitika Mathur, Timothy Baldwin, and Trevor Cohn. 2019.Putting evaluation in context: Contextual
em-beddings improve machine translation evaluation.
In Proceedings of the 57th Annual Meeting of the Association for Computational Linguistics, pages 2799–2808, Florence, Italy. Association for Compu-tational Linguistics.
Ani Nenkova and Rebecca J. Passonneau. 2004. Evalu-ating content selection in summarization: The
pyra-mid method. In Proceedings of the 2004
Confer-ence of the North American Chapter of the Associ-ation for ComputAssoci-ational Linguistics: Human Lan-guage Technologies, pages 145–152. Association for Computational Linguistics.
Jun-Ping Ng and Viktoria Abrecht. 2015. Better sum-marization evaluation with word embeddings for
rouge. In Proceedings of the 2015 Conference on
Empirical Methods in Natural Language Process-ing, pages 1925–1930, Lisbon, Portugal. Associa-tion for ComputaAssocia-tional Linguistics.
Jekaterina Novikova, Ondˇrej Duˇsek, Amanda Cer-cas Curry, and Verena Rieser. 2017. Why We Need
New Evaluation Metrics for NLG. InProceedings
of the 2017 Conference on Empirical Methods in Natural Language Processing, pages 2241–2252, Copenhagen, Denmark. Association for Computa-tional Linguistics.
Kishore Papineni, Salim Roukos, Todd Ward, and Wei-Jing Zhu. 2002. BLEU: A Method for Automatic
Evaluation of Machine Translation. InProceedings
of the 40th Annual Meeting on Association for Com-putational Linguistics, ACL ’02, pages 311–318, Stroudsburg, PA, USA. Association for Computa-tional Linguistics.
Matthew E. Peters, Mark Neumann, Mohit Iyyer, Matt Gardner, Christopher Clark, Kenton Lee, and Luke Zettlemoyer. 2018. Deep contextualized word rep-resentations. InProceedings of the North American Chapter of the Association for Computational Lin-guistics (NAACL).
Maxime Peyrard. 2019a. A simple theoretical model of importance for summarization. InProceedings of the 57th Annual Meeting of the Association for Com-putational Linguistics, pages 1059–1073, Florence, Italy. Association for Computational Linguistics.
Maxime Peyrard. 2019b. Studying summarization evaluation metrics in the appropriate scoring range. In Proceedings of the 57th Annual Meeting of the Association for Computational Linguistics, pages 5093–5100, Florence, Italy. Association for Compu-tational Linguistics.
Maxime Peyrard, Teresa Botschen, and Iryna Gurevych. 2017. Learning to score system summaries for better content selection evaluation. In Proceedings of the Workshop on New Frontiers in Summarization.
Matt Post. 2018. A call for clarity in reporting bleu
scores. InProceedings of the Third Conference on
Machine Translation (WMT).
Ehud Reiter. 2018. A structured review of the validity
of BLEU. Computational Linguistics, 44(3):393–
401.
Yossi Rubner, Carlo Tomasi, and Leonidas J. Guibas. 2000. The earth mover’s distance as a metric for image retrieval. International Journal of Computer Vision.
Andreas R¨uckl´e, Steffen Eger, Maxime Peyrard, and Iryna Gurevych. 2018. Concatenated power mean word embeddings as universal cross-lingual sen-tence representations.CoRR, abs/1803.01400.
Abigail See, Peter J. Liu, and Christopher D. Manning. 2017.Get to the point: Summarization with
pointer-generator networks. InProceedings of the Annual
Meeting of the Association for Computational Lin-guistics (ACL).
Hiroki Shimanaka, Tomoyuki Kajiwara, and Mamoru Komachi. 2018. RUSE: Regressor using sentence embeddings for automatic machine translation
eval-uation. InProceedings of the Third Conference on
Machine Translation (WMT).
Ian Tenney, Patrick Xia, Berlin Chen, Alex Wang, Adam Poliak, R Thomas McCoy, Najoung Kim, Benjamin Van Durme, Samuel R Bowman, Dipan-jan Das, et al. 2019. What do you learn from
context? probing for sentence structure in
con-textualized word representations. arXiv preprint
arXiv:1905.06316.
Stephen Tratz and Eduard H Hovy. 2008. Summa-rization Evaluation Using Transformed Basic Ele-ments. InProceedings of the text analysing confer-ence, (TAC 2008).
Ramakrishna Vedantam, C. Lawrence Zitnick, and Devi Parikh. 2015. CIDEr: Consensus-based
Im-age Description Evaluation. In IEEE Conference
on Computer Vision and Pattern Recognition, CVPR 2015, Boston, MA, USA, June 7-12, 2015, pages 4566–4575.
Matt P Wand and M Chris Jones. 1994.Kernel smooth-ing. Chapman and Hall/CRC.
Tsung-Hsien Wen, Milica Gasic, Nikola Mrksic, Pei-Hao Su, David Vandyke, and Steve Young. 2015. Semantically conditioned lstm-based natural
lan-guage generation for spoken dialogue systems.
arXiv preprint arXiv:1508.01745.
Sam Wiseman, Stuart M. Shieber, and Alexander M. Rush. 2018. Learning neural templates for text
gen-eration. InProceedings of the Conference on
Em-pirical Methods in Natural Language Processing (EMNLP).
Suofei Zhang, Wei Zhao, Xiaofu Wu, and Quan Zhou. 2018. Fast dynamic routing based on weighted ker-nel density estimation.CoRR, abs/1805.10807.
Tianyi Zhang, Varsha Kishore, Felix Wu, Kilian Q. Weinberger, and Yoav Artzi. 2019. Bertscore:
Evaluating text generation with BERT. CoRR,
abs/1904.09675.
Wei Zhao, Haiyun Peng, Steffen Eger, Erik Cambria, and Min Yang. 2019. Towards scalable and reli-able capsule networks for challenging NLP
appli-cations. InProceedings of the 57th Annual
Meet-ing of the Association for Computational LMeet-inguis- Linguis-tics, pages 1549–1559, Florence, Italy. Association for Computational Linguistics.
Wei Zhao, Jianbo Ye, Min Yang, Zeyang Lei, Suofei Zhang, and Zhou Zhao. 2018. Investigating cap-sule networks with dynamic routing for text
classifi-cation. InProceedings of the 2016 Conference on
A Supplemental Material
A.1 Proof of Prop.1
In this section, we prove Prop.1 in the paper about viewing BERTScore (precision/recall) as a (non-optimized) Mover Distance.
As a reminder, the WMD formulation is:
WMD(xn,yn) := min
F∈R|xn|×|yn| X
i,j
Cij ·Fij
s.t. 1|F|1= 1, 1|F1= 1.
whereF|1=fnx andF1=fyn. Here,fnxandfny denote vectors of weights for eachn-gram ofxnand yn.
BERTScore is defined as:
RBERT= P
y1
i∈y1idf(y
1
i) maxx1
j∈x1E(x
1
j)|E(y1i)
P
y1
i∈y1idf(y
1
i)
PBERT= P
x1
j∈x1idf(x
1
j) maxy1
i∈y1E(y
1
i)|E(x1j)
P
x1
j∈x1idf(x
1
j)
FBERT= 2
PBERT·RBERT
PBERT+RBERT
.
Then,RBERTcan be formulated in a “quasi” WMD form:
RBERT(x1,y1) := X
i,j
Cij ·Fij
Fij =
(1
M ifxj = arg maxxˆ1
j∈x1E(y
1
i)|E(ˆx1j)
0 otherwise
Cij =
(M
Zidf(y
1
i)E(x1j)|E(yi1) ifxj = arg maxxˆ1
j∈x1E(y
1
i)|E(ˆx1j)
0 otherwise
whereZ=P
yi1∈y1idf(yi1)andM is the size ofn-grams inx1. Similarly, we can havePBERTin a quasi
WMD form (omitted). Then,FBERTcan be formulated as harmonic-mean of two WMD forms ofPBERT
andRBERT.
A.2 Routing
In this section, we study the aggregation function φwith a routing scheme, which has achieved good results in other NLP tasks (Zhao et al.,2018,2019). Specifically, we introduce a nonparametric clustering with Kernel Density Estimation (KDE) for routing since KDE bridges a family of kernel functions with underlying empirical distributions, which often leads to computational efficiency (Zhang et al.,2018), defined as:
min
v,γ f(z) = L
X
i=1
T
X
j=1
γijk(d(vj−zi,j))
s.t. ∀i, j :γij >0, L
X
j=1
whered(·)is a distance function,γij denotes the underlying closeness between the aggregated vectorvj and vectorziin thei-th layer, andkis a kernel function. Some instantiations ofk(·)(Wand and Jones, 1994) are:
Gaussian :k(x),exp (−x
2), Epanechnikov :k(x),
(
1−x x∈[0,1) 0 x≥1.
One typical solution for KDE clustering to minimizef(z)is taking Mean Shift (Comaniciu and Meer, 2002), defined as:
∇f(z) =X
i,j
γijk0(d(vj,zi,j))
∂d(vj,zi,j)
∂v
Firstly,vτj+1can be updated whileγijτ+1is fixed:
vτj+1=
P
iγijτk 0(d(vτ
j,zi,j))zi,j
P
i,jk0(d(vτj,zi,j))
Intuitively, vj can be explained as a final aggregated vector fromL contextualized layers. Then, we adopt SGD to updateγijτ+1:
γijτ+1 =γijτ +α·k(d(vτj,zi,j))
whereαis a hyperparameter to control step size. The routing process is summarized in Algorithm1.
Algorithm 1Aggregation by Routing
1: procedureROUTING(zij,`)
2: Initialize∀i, j:γij= 0
3: whiletruedo
4: foreachrepresentationiandjin layer`and`+ 1doγij←softmax(γij)
5: foreachrepresentationjin layer`+ 1do
6: vj←Piγijk0(vj,zi)zi/Pik
0
(vi,zi)
7: foreachrepresentationiandjin layer`and`+ 1doγij←γij+α·k(vj,zi)
8: loss←log(P
i,jγijk(vj,zi))
9: if|loss−preloss|< then
10: break
11: else
12: preloss←loss
13: returnvj
Best Layer and Layer-wise Consolidation Table 6 compares our word mover based metric com-bining BERT representations on different layers with stronger BERT representations consolidated from these layers (usingp-means and routing). We often see that which layer has best performance is task-dependent, and our word mover based metrics (WMD) withp-means or routing schema come close to the oracle performance obtained from the best layers.
Direct Assessment
Metrics cs-en de-en fi-en lv-en ru-en tr-en zh-en
WMD-1 + BERT + LAYER8 .6361 .6755 .8134 .7033 .7273 .7233 .7175 WMD-1 + BERT + LAYER9 .6510 .6865 .8240 .7107 .7291 .7357 .7195
WMD-1 + BERT + LAYER10 .6605 .6948 .8231 .7158 .7363 .7317 .7168 WMD-1 + BERT + LAYER11 .6695 .6845 .8192 .7048 .7315 .7276 .7058 WMD-1 + BERT + LAYER12 .6677 .6825 .8194 .7188 .7326 .7291 .7064
[image:15.595.99.499.84.189.2]WMD-1 + BERT + ROUTING .6618 .6897 .8225 .7122 .7334 .7301 .7182 WMD-1 + BERT + PMEANS .6623 .6873 .8234 .7139 .7350 .7339 .7192
Table 6: Absolute Pearson correlations with segment-level human judgments on WMT17 to-English translations.
Direct Assessment
Setting Metrics cs-en de-en fi-en lv-en ru-en tr-en zh-en Average
BASELINES
BLEND 0.594 0.571 0.733 0.594 0.622 0.671 0.661 0.635 RUSE 0.624 0.644 0.750 0.697 0.673 0.716 0.691 0.685 SENTBLEU 0.435 0.432 0.571 0.393 0.484 0.538 0.512 0.481 CHRF++ 0.523 0.534 0.678 0.520 0.588 0.614 0.593 0.579 METEOR++ 0.552 0.538 0.720 0.563 0.627 0.626 0.646 0.610 BERTSCORE-F1 0.670 0.686 0.820 0.710 0.729 0.714 0.704 0.719
WORD-MOVER
WMD-1 + W2V 0.392 0.463 0.558 0.463 0.456 0.485 0.481 0.471 WMD-1 + BERT + ROUTING 0.658 0.689 0.823 0.712 0.733 0.730 0.718 0.723 WMD-1 + BERT + MNLI + ROUTING 0.665 0.705 0.834 0.744 0.735 0.752 0.736 0.739 WMD-2 + BERT + MNLI + ROUTING 0.676 0.706 0.831 0.743 0.734 0.755 0.732 0.740 WMD-1 + BERT + PMEANS 0.662 0.687 0.823 0.714 0.735 0.734 0.719 0.725 WMD-1 + BERT + MNLI + PMEANS 0.670 0.708 0.835 0.746 0.738 0.762 0.744 0.743
[image:15.595.80.549.256.421.2]WMD-2 + BERT + MNLI + PMEANS 0.679 0.710 0.832 0.745 0.736 0.763 0.740 0.743
Table 7: Absolute Pearson correlations with segment-level human judgments on WMT17 to-English translations.
TAC-2008 TAC-2009
Responsiveness Pyramid Responsiveness Pyramid
Setting Metrics r ρ r ρ r ρ r ρ
BASELINES
S3f ull 0.696 0.558 0.753 0.652 0.731 0.552 0.838 0.724
S3best 0.715 0.595 0.754 0.652 0.738 0.595 0.842 0.731
TF∗IDF-1 0.176 0.224 0.183 0.237 0.187 0.222 0.242 0.284 TF∗IDF-2 0.047 0.154 0.049 0.182 0.047 0.167 0.097 0.233 ROUGE-1 0.703 0.578 0.747 0.632 0.704 0.565 0.808 0.692 ROUGE-2 0.695 0.572 0.718 0.635 0.727 0.583 0.803 0.694 ROUGE-1-WE 0.571 0.450 0.579 0.458 0.586 0.437 0.653 0.516 ROUGE-2-WE 0.566 0.397 0.556 0.388 0.607 0.413 0.671 0.481 ROUGE-L 0.681 0.520 0.702 0.568 0.730 0.563 0.779 0.652 FRAME-1 0.658 0.508 0.686 0.529 0.678 0.527 0.762 0.628 FRAME-2 0.676 0.519 0.691 0.556 0.715 0.555 0.781 0.648 BERTSCORE-F1 0.724 0.594 0.750 0.649 0.739 0.580 0.823 0.703
WORD-MOVER
WMD-1 + W2V 0.669 0.559 0.665 0.611 0.698 0.520 0.740 0.647 WMD-1 + BERT + ROUTING 0.729 0.601 0.763 0.675 0.740 0.580 0.831 0.700 WMD-1 + BERT + MNLI + ROUTING 0.734 0.609 0.768 0.686 0.747 0.589 0.837 0.711 WMD-2 + BERT + MNLI + ROUTING 0.731 0.593 0.755 0.666 0.753 0.583 0.827 0.698 WMD-1 + BERT + PMEANS 0.729 0.595 0.755 0.660 0.742 0.581 0.825 0.690 WMD-1 + BERT + MNLI + PMEANS 0.736 0.604 0.760 0.672 0.754 0.594 0.831 0.701 WMD-2 + BERT + MNLI + PMEANS 0.734 0.601 0.752 0.663 0.753 0.586 0.825 0.694
[image:15.595.74.550.488.723.2]BAGEL SFHOTEL Setting Metrics Inf Nat Qual Inf Nat Qual
BASELINES
BLEU-1 0.225 0.141 0.113 0.107 0.175 0.069 BLEU-2 0.211 0.152 0.115 0.097 0.174 0.071 BLEU-3 0.191 0.150 0.109 0.089 0.161 0.070 BLEU-4 0.175 0.141 0.101 0.084 0.104 0.056 ROUGE-L 0.202 0.134 0.111 0.092 0.147 0.062 NIST 0.207 0.089 0.056 0.072 0.125 0.061 CIDER 0.205 0.162 0.119 0.095 0.155 0.052 METEOR 0.251 0.127 0.116 0.111 0.148 0.082 BERTSCORE-F1 0.267 0.210 0.178 0.163 0.193 0.118
WORD-MOVER
WMD-1 + W2V 0.222 0.079 0.123 0.074 0.095 0.021 WMD-1 + BERT + ROUTING 0.294 0.209 0.156 0.208 0.256 0.178 WMD-1 + BERT + MNLI + ROUTING 0.278 0.180 0.144 0.211 0.252 0.175 WMD-2 + BERT + MNLI + ROUTING 0.279 0.182 0.147 0.204 0.252 0.172 WMD-1 + BERT + PMEANS 0.298 0.212 0.163 0.203 0.261 0.182 WMD-1 + BERT + MNLI + PMEANS 0.285 0.195 0.158 0.207 0.270 0.183
[image:16.595.72.530.307.499.2]WMD-2 + BERT + MNLI + PMEANS 0.284 0.194 0.156 0.204 0.270 0.182