Reduction of Power Losses Using Phase Load
Balancing Method in Power Networks
Dickson K. Chembe, Member, IAENG
Abstract - Power losses in power networks are one of the
most important indicators of the economic operations of a power network company and also portray the condition of electric meter reading systems as well as effectiveness of the network. This indicator is the witness of the many problems which are being faced in many countries and requires urgent attention. In many countries it has been observed that there is a very big increase in the actual and relative power losses and at the same time, there is also a reduction of power output in networks. With the world economic crisis at hand, the problem of power loss reduction in power networks has become even more imperative and requires urgent attention of power network companies.
Reduction of power losses is a complex problem which needs enough expenditure and qualified personnel. My research therefore aimed at picking the most economical method of reduction of power losses with a short cost recovery period. After the analysis of planned methods in power loss reduction in Privolshki regional power distributor, it was found that phase load balancing method was given less attention. My main priority therefore was given to phase load balancing of distributive networks of 0.38 kV. In order to reduce technical power losses by load balancing, some calculations to find the unbalances of loads were executed. Beside that, our method proved that balancing of loads in phases is still necessary especially to distributive power networks.
Index Terms — method, phase-load balancing, power
losses, reduction.
I. ANALYSIS OF BALANCED AND UNBALANCED LOADS
The analysis of power loss reduction plan executed by Privolshki regional network company of 0.4 kV in Kazan, Russia showed that there was very little attention given to phase load balancing of 0.4 kV networks, besides the fact that the length of 0.4 kV is significant.
At present time, asymmetrical or unbalanced loads are experienced almost in all 0.4 kV distributive networks. The causes of load imbalances in city networks is usually domestic consumers; in industrial networks – welding units of different capacity; in power lines – large arc furnaces, electric locomotives of alternating current, etc.
A balanced three phase system is characterized by the same module and voltage in all the three phases. During unbalanced operation mode, voltage is not equally distributed in the phases. Unbalanced operation modes in electrical networks are caused by the following reasons:
1. Unequal loads in various phases,
2. Partial operation of lines and other elements in the network,
3. Different line parameters in different phases. The most common voltage unbalances occur due to
imbalance distribution of loads in the phases. In urban and rural networks of 0.38 kV, voltage imbalances are mainly caused by connections of domestic single phase lighting systems and single phase domestic electrical appliances of low power rating. The number of such single phase appliances is too big and it needs equal distribution in phases in order to reduce imbalances in loads [1].
In high voltage networks, load imbalances are caused by powerful single phase electrical equipments and in some cases even three phase electrical equipments with unequal load demands in phases. The main sources of load imbalances in industrial power networks of 0.38 kV are single phase thermal installations, ore – thermal furnaces, induction melting furnaces, resistance furnaces and various heating installations. Welding devices of various capacities are also a merger contributor to imbalances in loads. Traction substations of railway transport electrified on an alternating current are a powerful source of load imbalances as the electric locomotives are single – phase electrical equipments. The load demand of an independent single – phase electrical equipment may now reach several megawatts.
The inequality of parameters of overhead power lines in different phases occurs, for example, due to the absence of transposition supports on power lines or linear cycles. Transposition supports are unreliable and are sources of breakdowns and accidents. The reduction of the number of transposition support on power lines reduces damageability and increases the reliability of power lines.
The occurrence of zero – sequence voltage V0 and
current I0 as well as negative – sequence voltage V2 and
current I2 brings about additional losses in power
networks which worsens the operation mode and the performance characteristics of a network. Negative and zero – sequence currents (I2, I0) increases power losses
along the power network branches, while voltage of the same sequences – increases power losses in cross–section area of network branches.
Superposition of V2 and V0 leads to angle deviation of
voltage in various phases. As a result, the voltage angle may go out of its limits. Superposition of I2 and I0 leads to
an increase in total currents in different phases of network elements, disturbing heating conditions and reducing the current carrying capacity of wires, cables and other elements.
under loaded phases. Rational redistribution of power load does not always reduce the imbalances factor of voltage to a required level. In such cases, it is necessary to apply special balancing facilities. Common to us are many balancing circuits which largely depend on the load graph.
In order to balance single – phase power loads, circuits containing inductors and capacitors are adopted. To balance two and three – phases with imbalances in power loads, circuits with capacitive batteries of different power ratings and connected in star are applied. Some times special transformers and auto – transformers designed for load balancing are used. It is very important to apply circuits which do not only balance the loads, but also generate reactive power in order to compensate for its loss.
In order to reduce imbalances in four-line urban networks of 0.4 kV, zero-sequence current I0 and
zero-sequence resistance Z0 in network elements must be
reduced. The reduction of I0 is achieved by redistribution
of load. Balancing of loads is achieved by using networks in which all or a number of transformers working in parallel are connected on the lower voltage side of the windings. Reduction of Z0 is easily attained in overhead
lines of 0.38 kV, which are usually installed in areas with little load density. As for cables, Z0 is reduced by
increasing the cross section area of the zero line and should be based on standard technical-economic calculations [2].
II. LOAD BALANCING CALCULATION EXECUTED FOR TRANSFORMER SUBSTATION OF
PRIVOLSHKI POWER NETWORK COMPANY IN
KAZAN, RUSSIA
The analysis of power losses in distributive power networks of 10 – 0.4 kV together with the technical conditions of power equipments and network loads shows that there is need of the dependence of technical and reported power losses on load balancing of consumers.
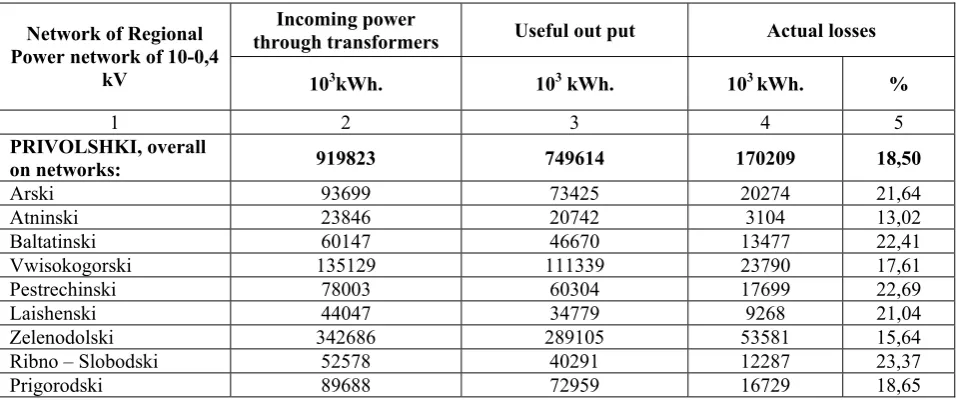
Due to the high levels of technical power losses in distributive power networks of Privolshki Power Network Company in Kazan, Russia, the question of implementing load balancing methods becomes a priority and required urgent attention. This statement is proven by the existing levels of power losses in distributive networks of 10 – 0.4 kV. In 2007, reported losses in regional distributive Network Companies like Privolshki alone were 170 million kWh or 18.50% of the output power from the network. The highest relative levels of reported power losses on Privolshki regional distributive network in 2007 for the year 2007 was recorded in Ribno – Slobodski regional substation. The recorded losses were 12.3 million kWh or 23.37% (Table 2)
During my research with the aim of defining the influences of non – linear and imbalances of loads on power networks, we picked five transformer substations in which we carried out measurements on energy parameters on the 0.4 kV side (power consumption read by measuring instruments of voltage and current in each overhead phase line of 0.4 kV). Ribno – Slobodski substation of 110/35/10 kV served as our feeder centre.
To define the power losses from unbalanced load distribution on phases, the method used is described below:
Method: The calculation was based on “The instruction on the reduction of technological consumption of power during transmission in power networks of energy systems of Russia [3].”
The power losses in power Transformers (∆WT)
consists of load losses (∆WL) and no-load run losses of
Transformers (∆WNL)
)
1
(
"
"
,
kWh
W
W
W
T=
Δ
NL+
Δ
LΔ
No-load run losses of power Transformers are calculated by:
)
2
(
"
"
,
10
3kWh
T
P
W
NL=
Δ
NL×
×
−Δ
Where
Δ
P
NL – idle run losses of power transformer obtained from the transformer passport “kW”.T – Transformer’s continuous running time, “h”.
Load power losses are calculated by the formula
)
3
(
"
"
,
)
(
2 2 2 2kWh
R
T
V
k
W
W
W
EQ EQ f Q P L×
×
+
=
Δ
Where
W
P - active energy passing through thetransformer windings, “kWh”
Q
W
– Reactive energy passing through the transformer windings, “103 kWh”EQ
V
- Equivalent voltage taken as equal to the nominal voltage VnomREQ – Equivalent resistance of winding, “Ohms”
kf – graph form factor
In many cases, consumers do not information on reactive energy and the graph form factor of load. With the absence of such information, follows the use of a simplified formula;
)
4
(
"
"
,
63
.
1
2 2kWh
R
T
V
W
W
EQ nom PL
=
×
×
Δ
The equivalent resistance of a power line is calculated by
)
5
(
"
"
,
1000
Ω
=
r
l
R
OEQ
Where r0 – the specific line resistance in Ω/km
Planned and actual power loss reduction by means of elimination of systematic imbalances (unequal distribution of current loads on phases) is calculated by the formula;
)
6
(
"
"
),
(
K
1K
2kWh
W
W
=
Δ
i−
iδ
Where ∆W – power loss in 0.4 kV network with balanced phase loads, calculated using the equation (4)
Ki1 and Ki2 – imbalance factors before and after
balancing which is found by;
)
7
(
,
5
.
1
)
5
.
1
1
(
3
2 2 2
PH O
PH O
C B A
C B A i
R
R
R
R
I
I
I
I
I
I
K
×
−
×
+
×
+
+
+
+
×
=
Where RO/RPH – is the relation between zero –
sequence and phase wire resistances.
IA, IB ,IC – medium phase current values between 17
hours up to 23 hours (not less than three measurements). When data about load currents is lacking, we consider: For lines with RO/RPH = 1 Ki = 1.13
For lines with RO/RPH = 2 Ki = 1.2
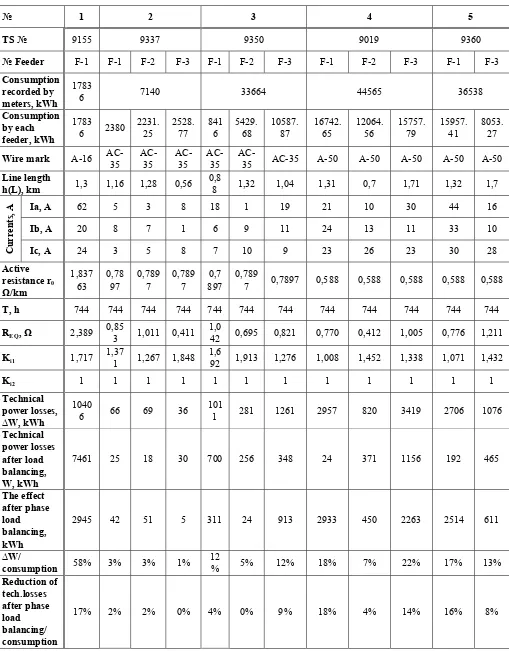
Calculated results are shown in the table (Table 3)
III. ECONOMIC EFFECTS
The economic effects from the realization of this method was USD 205.6 / month
E = (Technical losses before implementation – Technical losses after implementation) × T
E = (10406 kWh – 6597 kWh) ×0.0543 USD/kWh = 205.6 USD/ month
The economical effect of implementing this method in a year equals 2468.23 USD
T = 0.0543 USD/ kWh – tariffs on electric power for consumers.
The duration of cost recovery equals 8 years.
The calculation of cost recovery and economic effects from this method is composed in the table (Table 1)
IV. CONCLUSIONS
Based on the calculations executed, we can conclude that:
1. The value of technical power losses in transformer substations on the chosen 0.4 kV lines with imbalanced load distribution on phases was 2009 kWh. This value confirms that there are high levels of technical power losses in 0.4 kV power networks
2. Realization of this power loss reduction method on the chosen overhead power lines of 0.4 kV allows to reduce technical losses from 2009 kWh to 910 kWh. Implementation of load balancing permits to reduce technical power losses in a short period of time and with minimal costs. It is necessary to note that network companies do not per much attention to load balancing methods especially in 0.4 kV networks.
TABLE 1: ECONOMIC EFFECT RESULTS
The table shows the cost recovery period for each substation
№
Transfor mers sub
№
Number of consume
rs
Number of organizatio
ns
Medium consumption
on 1 client, kWh.
Reduction of technical power
losses after implementing load balancing method, kWh.
Technical losses after the implementation
of load balancing method * tariff.USD in a
year
Expe nditur
e. USD.
Cost recovery
period
[image:4.595.59.538.364.565.2]1 9155 69 2 117.29 2945 1920.14 1070 7 months 2 9337 27 0 150.2 98 63.896 10 years 3 9350 70 1 179.43 1248 813.669 2,5 years 4 9019 160 11 48.97 5646 3681.192 2140 7 months 5 9360 87 1 142.83 3125 2037.5 2044 1 year
TABLE 2: DATA ON REPORTED POWER LOSSES IN PRIVOLSHKI POWER NETWORK COMPANY FOR 2007
Incoming power
through transformers Useful out put Actual losses Network of Regional
Power network of 10-0,4
kV 103kWh. 103 kWh. 103 kWh. %
1 2 3 4 5
PRIVOLSHKI, overall
on networks: 919823 749614 170209 18,50
Arski 93699 73425 20274 21,64
Atninski 23846 20742 3104 13,02
Baltatinski 60147 46670 13477 22,41 Vwisokogorski 135129 111339 23790 17,61 Pestrechinski 78003 60304 17699 22,69 Laishenski 44047 34779 9268 21,04 Zelenodolski 342686 289105 53581 15,64 Ribno – Slobodski 52578 40291 12287 23,37
TABLE 3: PHASE LOAD BALANCING OF 0.4 kV NETWORK OF PRIVOLSHKI POWER NETWORK
№ 1 2 3 4 5
TS № 9155 9337 9350 9019 9360
№ Feeder F-1 F-1 F-2 F-3 F-1 F-2 F-3 F-1 F-2 F-3 F-1 F-3
Consumption recorded by meters, kWh
1783
6 7140 33664 44565 36538
Consumption by each feeder, kWh
1783
6 2380 2231.
25
2528. 77
841 6
5429. 68
10587. 87
16742. 65
12064. 56
15757. 79
15957. 41
8053. 27
Wire mark A-16 AC-35 AC-35 AC-35 AC-35 AC-35 AC-35 A-50 A-50 A-50 A-50 A-50
Line length
h(L), km 1,3 1,16 1,28 0,56
0,8
8 1,32 1,04 1,31 0,7 1,71 1,32 1,7
Ia, A 62 5 3 8 18 1 19 21 10 30 44 16
Ib, A 20 8 7 1 6 9 11 24 13 11 33 10
Currents, A Ic, A 24 3 5 8 7 10 9 23 26 23 30 28
Active resistance r0
Ω/km
1,837 63
0,78 97
0,789 7
0,789 7
0,7 897
0,789
7 0,7897 0,588 0,588 0,588 0,588 0,588
T, h 744 744 744 744 744 744 744 744 744 744 744 744
REQ, Ω 2,389 0,853 1,011 0,411 1,042 0,695 0,821 0,770 0,412 1,005 0,776 1,211 Ki1 1,717 1,371 1,267 1,848 1,692 1,913 1,276 1,008 1,452 1,338 1,071 1,432 Ki2 1 1 1 1 1 1 1 1 1 1 1 1 Technical
power losses,
∆W, kWh
1040
6 66 69 36 101
1 281 1261 2957 820 3419 2706 1076
Technical power losses after load balancing, W, kWh
7461 25 18 30 700 256 348 24 371 1156 192 465
The effect after phase load balancing, kWh
2945 42 51 5 311 24 913 2933 450 2263 2514 611
∆W/
consumption 58% 3% 3% 1%
12
% 5% 12% 18% 7% 22% 17% 13%
Reduction of tech.losses after phase load balancing/ consumption
REFERENCES
[1] Idelchik V. I. Power systems and networks. Moscow, Energy. 1989. 230p
[2] Menikov N. A. Power systems and networks. Moscow, Energy. 104p.1969.
[3] I 34-70-028-86. The instruction on the reduction of technological consumption of power during transmission in power networks and energy systems of Russia, 1987
[4] Costa P.M. and Matos M.A., "Loss allocation in distribution networks with embedded generation," IEEE Transactions on Power Systems, vol. 19, no. 1, pp. 384-389, 2004.
[5] Cardell, J. B. Improved Marginal Loss Calculations During Hours of Transmission Congestion. 2005. 38th Annual Hawaii International Conference on System Sciences.
[6] Vorotniski V. E. Power losses in power networks, analysis and experiences of power loss reduction. Moscow, energy progress.104p. 2006.
[7] Lund, T., Nielsen, J. E., Hylle, P., Sorensen, P., Nielsen, A. H., and Sorensen, G., "Reactive Power Balance in a Distribution Network with Wind Farms and CHPs," International Journal of Distributed Energy Resources, vol. 3, no. 2, pp. 113-138, 2007. [8] Courag Prabhu.Oman: Goal to halve power system