A Comparison of Windowless and Window-Based Computational
Association Measures as Predictors of Syntagmatic Human Associations
Justin Washtell School of Computing
University of Leeds
washtell@comp.leeds.ac.uk
Katja Markert School of Computing
University of Leeds
markert@comp.leeds.ac.uk
Abstract
Distance-based (windowless) word asso-cation measures have only very recently appeared in the NLP literature and their performance compared to existing win-dowed or frequency-based measures is largely unknown. We conduct a large-scale empirical comparison of a variety of distance-based and frequency-based mea-sures for the reproduction of syntagmatic human assocation norms. Overall, our results show an improvement in the pre-dictive power of windowless over win-dowed measures. This provides support to some of the previously published the-oretical advantages and makes window-less approaches a promising avenue to explore further. This study also serves as a first comparison of windowed meth-ods across numerous human association datasets. During this comparison we also introduce some novel variations of window-based measures which perform as well as or better in the human association norm task than established measures.
1 Introduction
Automatic discovery of semantically associated words has attracted a large amount of attention in the last decades and a host of computational asso-ciation measures have been proposed to deal with this task (see Section 2). These measures tradi-tionally rely on the co-ocurrence frequency of two words in a corpus to estimate a relatedness score. There has been a recent emergence of distance-based language modelling techiques in NLP (Sav-icki and Hlavacova, 2002; Terra and Clarke, 2004) in which the number of tokens separating words is the essential quantity. While some of this work has considered distance-based alternatives to con-ventional association measures (Hardcastle, 2005;
Washtell, 2009), there has been no principled em-pirical evaluation of these measures as predictors of human association. We remedy this by conduct-ing a thorough comparison of a wide variety of frequency-based and distance-based measures as predictors of human association scores as elicited in several differentfree word association tasks.
In this work we focus on first-order associ-ation measures as predictors of syntagmatic as-sociations. This is in contrast to second and higher-order measures which are better predictors of paradigmatic associations, or word similarity. The distinction between syntagmatic and paradig-matic relationship types is neither exact nor mu-tually exclusive, and many paradigmatic relation-ships can be observed syntagmatically in the text. Roughly in keeping with (Rapp, 2002), we hereby regard paradigmatic assocations as those based largely on word similarity (i.e. including those typically classed as synonyms, antonyms, hyper-nyms, hyponyms etc), whereas syntagmatic as-sociations are all those words which strongly in-voke one another yet which cannot readily be said to be similar. Typically these will have an identifiable semantic or grammatical relationship (meronym/holonym: stem – flower, verb/object: eat – foodetc), or may have harder-to-classify top-ical or idiomatic relationships (family – Christmas, rock – roll).
We will show in Section 3.2 that syntagmatic relations by themselves constitute a substantial 25-40% of the strongest human responses to cue words. Although the automatic detection of these assocations in text has received less attention than that of paradigmatic associations, they are nonetheless important in applications such as the resolution of bridging anaphora (Vieira and Poe-sio, 2000).1 Furthermore, first-order associations
1where for example resolvingmy house – the windowsto
the windows of my housecan be aided by the knowledge that windows are often (syntagmatically) associated with houses.
are often the basis of higher-order vector word-space models used for predicting paradigmatic relationships: i.e. through the observation of words which share similar sets of syntagmatic as-sociations. Therefore improvements made at the level we are concerned with may reasonably be expected to carry through to applications which hinge on the identification of paradigmatic rela-tionships.
After a discussion of previous work in Sec-tion 2, we formulate the exact associaSec-tion mea-sures and parameter settings which we compare in Section 3, where we also introduce the corpora and human association sets used. Then, by using evaluations similar to those described in (Baroni et al., 2008) and by Rapp (2002), we show that the best distance-based measures correlate better overall with human association scores than do the best window based configurations (see Section 4), and that they also serve as better predictors of the strongest human associations (see Section 5).
2 Related Work
Measures based on co-ocurrence frequency.
The standard way of estimating the syntagmatic association of word pairs in a corpus is to ex-amine the frequency of their co-occurence, and then usually to compare this to some expected fre-quency. There are a host of measures which ex-ist for this purpose. After raw co-occurrence fre-quency, the simplest and most prevalent in the literature is Pointwise Mutual Information, fa-mously used by Church (1989) (as the associa-tion ratio). This is defined as the log of the ra-tio of the observed co-occurrence frequency to the frequency expected under independence. More sophisticated and statistically-informed measures include t-Score, z-Score, Chi-Squared and Log-Likelihood (see Evert (2005) for a thorough re-view).
All of these measures have in common that they require co-occurrence frequency to be specified, and therefore require some definition of a region within which to count co-occurrences. This re-gion might be the entirety of a document at one extreme, or a bigram at the other. A versatile and hugely popular generalised approach is therefore to consider a ”‘window”’ ofwwords, wherewcan be varied to suit the application. Unsurprisingly, it has been found that this is a parameter which can have a significant impact upon performance
(Yarowsky and Florian, 2002; Lamjiri et al., 2004; Wang, 2005). While choosing an optimum win-dow size for an application is often subject to trial and error, there are some generally recog-nized trade-offs between small versus large win-dows, such as the impact of data-sparseness, and the nature of the associations retrieved (Church and Hanks, 1989; Church and Hanks, 1991; Rapp, 2002)
Measures based on distance between words in the text. The idea of using distance as an al-ternative to frequency for modelling language has been touched upon in recent literature (Savicki and Hlavacova, 2002; Terra and Clarke, 2004; Hard-castle, 2005). Washtell (2009) showed that it is possible to build distance-based analogues of ex-isting syntagmatic association measures, by using the notions of mean and expected distance rather than of frequency. These measures have certain theoretical qualities - notably scale-independence and relative resilience to data-sparseness - which might be expected to provide gains in tasks such as the reproduction of human association norms from corpus data. The specific measure introduced by Washtell, called Co-Dispersion, is based upon an established biogeographic dispersion measure (Clark and Evans, 1954). We provide a thor-ough empirical investigation of Co-Dispersion and some of its derivatives herein.
Measures based on syntactic relations. Sev-eral researchers (Lin, 1998; Curran, 2003; Pado and Lapata, 2007) have used word space models based on grammatical relationships for detecting and quantifying (mostly paradigmatic) word asso-ciations. In this paper, we will not use syntactic relation measures for two main reasons. Firstly these depend on the availability of parsers, which is not a given for many languages. Secondly, this may not be the most pertinent approach for pre-dicting human free associations, in which certain observed relationsips can be hard to express in terms of syntactic relationships.
3 Methodology
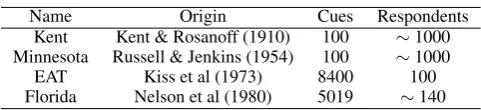
Table 1: Human association datasets
Name Origin Cues Respondents
Kent Kent & Rosanoff (1910) 100 ∼1000 Minnesota Russell & Jenkins (1954) 100 ∼1000
EAT Kiss et al (1973) 8400 100
Florida Nelson et al (1980) 5019 ∼140
However, relatedness measures for WordNet are many and varied and are themselves the subject of evaluation (Pedersen et al., 2004). Although hu-man association datasets have their own peculiari-ties, they do at least provide some kind of definite Gold Standard. Yet another alternative might be to incorporate our computational association scores into an application (such as anaphora resolution), and measure the performance of that, but noise from other submodules would complicate evalu-ation. We leave such extensions to possible future work.
We use evaluations similar to those used before (Rapp, 2002; Pado and Lapata, 2007; Baroni et al., 2008, among others). However, whereas most existing studies use only one dataset, or hand-selected parts thereof, we aim to evaluate mea-sures across four different human datasets. In this way we hope to get as unbiased a picture as possi-ble.
3.1 Association data
The datasets used are listed in Table 1. While the exact experimental conditions may differ, the datasets used were all elicited using the same ba-sic methodology: by presenting individual words (cues) to a number of healthy human subjects and asking in each case for the word that is most imme-diately or strongly evoked. An association score can then be derived for each cue/response pair in a dataset by dividing the number of participants pro-viding a given response by the number who were presented with the cue word. In Table 1, respon-dentsrefers to the number of people from whom a response was solicited for each cue word in a study (this is not to be confused with the number of unique responses).
Of these four datasets, one (Kent & Rosanoff) appears not to have been previously used in any peer-reviewed study of corpus-derived lexical as-sociation. It is worth noting that some of these datasets are quite dated, which might affect corre-lations with corpus-derived scores, as culture and contemporary language have a fundamental
im-pact upon the associations humans form (White and Abrams, 2004).
3.2 Frequency of Syntagmatic Associations
To verify that strong human associations do in-clude a large number of syntagmatic associations, we manually annotated all pairs consisting of a cue and its strongest human response in the
MinnesotaandKentdatasets as expressing ei-ther a syntagmatic or a paradigmatic relationship. The overall set to be annotated consisted of 200 pairs.
Annotators were given short (half-page) guide-lines on syntagmatic and paradigmatic assoca-tions, stating that very similar items (including hyponyms/hypernyms) as well as antonyms were to be judged as paradigmatic whereas words that do not fulfil this criterion are to be judged as syntagmatic. The two annotators were the au-thors of this paper (one native and one near-native speaker). After independent annotation, agree-ment was measured at a percentage agreeagree-ment of 91/93% and a kappa of 0.80/0.82 forMinnesota
andKent, respectively. Therefore, the distinction can be made with high reliability.
Overall, 27/39% of the human responses were syntagmatic in the Kent/Minnesota datasets, showing that syntagmatic relations make up a large proportion of even the strongest human as-sociations.
3.3 Corpora
ap-proximately the 24,000 most common word types in the BNC, with the remaining 9000 words types therefore comprising relatively uncommon words taken from the human associative responses.
The words included in the vocabulary ac-counted for over 94.5% of tokens in the corpus. Although statistics for the remaining word types in the BNC were not gathered, their correspond-ing tokens were left in the corpus so that these could be properly accounted for when calculating distances and window spans.
In order to maximize matching between word types in the corpus and association norms, all words in both were normalized by converting to lower-case and removing hyphens and periods. Words consisting entirely of numerals, or numer-als and punctuation, and all ”phrasal” associa-tive responses (those containing spaces) were dis-carded. The 33,000 word count was satisfied after making these normalizations.
In order to maximize the variety of the language in the samples, the subsets were built from ap-proximately the first 2000 words only of each ran-domly selected document from the BNC (a similar strategy to that used in constructing the 1 million word Brown Corpus). Both a 10 million word and a 1 million word sample were constructed in this fashion, allowing us to also examine the effects of varying corpus size and content.
3.4 Association measures used 3.4.1 Frequency-based measures
In the following,xis the cue word andya (possi-ble) response word. Thereforep(x) is the proba-bility of observingx, andp(¯x)refers to the prob-ability of not observingx.
Pointwise Mutual Information (hereonin PMI) was introduced in Section 2. For ranking word pairs, we can neglect the usual logarithm.
P MI=pp(x(x, y)p(y))
PMI is infamous for its tendency to attribute very high association scores to pairs involving low fre-quency words, as the denominator is small in such cases, even though theevidencefor association in such cases is also small. This can result in some unlikely associations. There exist a number of al-ternative measures which factor in the amount of evidence to give an estimate of thesignificance of
association. One popular and statistically appeal-ing such measure is Log-Likelihood (LL) (Dun-ning, 1993). LL works on a similar principle to PMI but considers the ratio of the observed to ex-pected co-occurrence frequencies for all contin-gencies(i.e. including those where the words do not co-occur). LL, as it most frequently appears in the literature, is not actually a measure of positive association: it also responds to significantnegative association. Therefore LL is arguably not suited to the task in hand. Krenn & Evert (2001) experiment with one-tailed variants of LL and Chi-Squared measures, although they do not define these vari-ants. Here, we construct a one-tailed variant of LL by simply reversing the signs of the terms which respond to negative association.
LL1tail = p(x, y) logpp((xx, y)p(y))−p(x,y¯) logpp(x(x,)py(¯¯y))
− p(¯x, y) logpp(¯(¯xx, y)p(y))+p(¯x,y¯) logpp(¯x(¯x,)py¯(¯y))
LL does not have a clear analogue amongst the distance-based measures (introduced in Sec-tion 3.4.2), whereas PMI for instance does. We therefore construct variants of PMI and other mea-sures which take theamount of evidence into ac-count in a way which can be directly reproduced in the distance domain. For this we borrow from Sackett (2001) who asserts that, all other things being equal, statistical significance is proportional to the square root of the sample size. There are a number of ways one might quantify sample size. We take a consistent approach across the various distance-based and frequency-based measures: we assume sample size to be equivalent to the lesser of the frequencies of the two words as this represents the total number of words available for pairing, with fewer observed pairs therefore being consid-ered to constitute negative evidence.
P MIsig=
p
min(p(x), p(y))pp(x(x, y)p(y))
All of the above measures are symmetric. Human associative responses however are not (Michel-bacher et al., 2007): a person’s tendency to give the responsebecauseto the cuewhydoes not nec-essarily reflect their tendency to give the response whyto the cuebecause.2A simple asymmetric as-sociation measure is conditional probability (CP)
- the probability of observing the response, given that the cue has already occurred.
CP=p(y|x) = p(px, y(x))
CP suffers from the fact that it does not account at all for the general frequency of the response word. It therefore tends to favour very frequent words, such as function words. An obvious so-lution would be to divide CP by the frequency of the response word, however this merely results in PMI which is symmetric. By multiplying CP with PMI (and taking the root, to simplify) we obtain a measure which is asymmetric yet does not overtly favour frequent response words.3 We refer to this herein as Semi-Conditional Information (SCI).
SCI= p(x, y)
p(x)pp(y)
We also explore variants of both CP and SCI with the additional significance correction presented for PMIsig. These can be easily inferred from the
for-mulae above.
3.4.2 Distance-based Measures
Co-Dispersion (herein CD), introduced by Washtell (2009), is defined as the ratio of the mean observed distance to the expected distance, where the expected distance is derived from the frequency of the more frequent word type. Distance refers to the number of tokens separat-ing an occurrence of one word and the nearest occurrence of another word. Pairs spanning an intervening occurrence of either word type or a document boundary are not considered. Note that here we specify only the generalised meanM, as we wish to keep the specific choice of mean as a parameter to be explored,
CD= 1M(/distmax(p(x), p(y)) xy1. . . distxyn)
that ofdirectionin the text. While the two may correlate, one can find ample counter-examples: jerkytriggersbeef more strongly thanbeeftriggersjerky.
3Note that Wettler & Rapp (1993) introduced a more
gen-eral asymmetric measure for predicting human associations, by employing an exponent parameter top(y). Our formuli-sation is equivalent to their measure with an exponent of 0.5, whereas they found an exponent of 0.66 to be most effective in their empirical study. Exponents of 0 and 1 result in CP and PMI respectively.
wheredistxyiisithobserved distance between
some occurrence of word type x and its nearest preceding or following occurrence of word type
y, andnis the total number of such distances ob-served (being at most equal to the frequency of the rarer word).
In cases where many occurrences of the less frequent word were not able to be paired, raw CD gives midleading results. This is because un-pairable words themselves provide useful nega-tive evidence which CD ignores. A more ap-propriate measure can be formed in which the mean distance is calculated using the frequency of the less frequent word, regardless of whether this many distances were actually observed. This gives us Neutrally-Weighted Co-Dispersion (NWCD). Note that for convenience, we keep the standard definition of the mean and introduce a correction factor instead.
NW CD=min(p(nx), p(y))M1(/distmax(p(x), p(y)) xy1. . . distxyn)
An asymmetric association measure can be formed in a similar manner. Instead of calculat-ing the mean uscalculat-ing the frequency of the less fre-quent word as described above, we explicitly use the frequency of the cue word (which in some cases may actually exceed the number of dis-tances observed). This gives us Cue-Weighted Co-Dispersion (CWCD).
CW CD= p(nx)M1(/distmax(p(x), p(y))
xy1. . . distxyn) (1)
In addition to these measures, we also ex-plore significance-corrected forms NWCDsig and
CWCDsig, by introducing the same sample size
term employed by PMIsig, CPsig and SCIsig.
Again, these can readily be inferred from the ex-isting formulae in the above two sections.
3.5 Co-occurrence Parameters
are w = 2, w = 10, w = 50, w = 250 and
w = 1250. We examine such large window sizes so as to give a fairer comparison with the distance approach which is not bounded by a window, and in acknowledgement of the fact that the entire doc-ument as context has been used with some success in other application areas (most notably informa-tion retrieval).
For distance-based statistics, the principle pa-rameter is the function via which the various ob-served distances between tokens are reduced to a single mean value. In this investigation we will ex-plore five means. These are the power means with exponents (which herein we refer to as m) rang-ing from -2 to +2. These give us the quadratic mean or RMS (m = 2), the arithmetic mean (m = 1), the geometric mean (m = 0), the har-monic mean (m=−1), and the inverse quadratic mean (m=−2).
4 Task I: Correlations on word pairs
One of the ESSLLI Workshop shared tasks (Ba-roni et al., 2008) required the evaluation of cor-relation between a small, manually selected sub-set of human cue-response scores from the EAT
dataset and automatic scores for the same word pairs. Here, tather than focusing on word pairs which meet certain grammatical and frequency criteria we test on all pairs. For the EAT and
Floridadatasets, this amounts to many tens of thousands of cue-response pairs. Although this makes the task of correlation harder, it means we can attribute a great deal of statistical significance to the results and make our observations as general as possible.
4.1 Evaluation Measures, Upper Bounds and Baselines
For evaluating agreement between corpus-derived associations and human associations, we use Spearman’s Rank correlation. This is appropri-ate because we are primarily interested in the rel-ative ranking of word pair associations (in order to predict particularly strong responses, for exam-ple). Although some studies have used Pearson’s correlation, the various association measures ex-plored here are not linear within each another and it would be inappropriate to evaluate them under the assumption of a linear relationship with the hu-man norms.
Two of the human datasets, Kent and
Minnesota, though collected independently, are based on the same set of 100 cue words established by Kent (1910). Therefore by performing a rank correlation of these two datasets with one another, (each of which was produced by pooling the re-sponses of some 1000 people) we can get a useful upper-bound for correlations: if a computer-based system were to exceed this upper-bound in corre-lations with either dataset, then we would need to suspect it of over-fitting.
As a baseline, we use the corpus frequency of the response word. The simple assumption is that the more frequent a word is, the more likely it is to appear as a human response independent of the cue given. This is also the simplest formulation which does not assign equal scores to the various possible responses, and which is therefore capable of producing a rank-list of predictions.
4.2 Task I Results
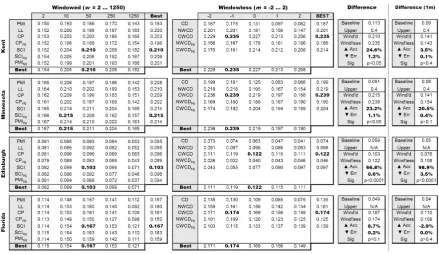
Figure 1 shows the Spearman’s rank correlation co-efficients across all paramaterisations of all as-sociation measures (frequency-based on the left, and distance-based on the right), with each human dataset, for the 10 million word corpus. Embold-ened are the best performing windowed and win-dowless configurations for each dataset. The dif-ference of these figures over the baseline is highly significant (p <0.0001in most cases). The panels to the right show summary statistics for these fig-ures, and for the 1 million word corpus (for which full figures are not included owing to space limita-tions). These statistics include the performance of the baseline, where relevant the estimated upbound (see Section 4.1), and the difference in per-formance of the distance-based method over the window-based. The accuracy and error figures are based on the co-efficients of determination (r2)
and are expressed both as a relative improvement in accuracy (how much closer (r2) is to 1 under the
distance-based approach) and reduction in error (how much furtherr2 is from zero). Also the
sig-nificance of the difference in the r values is given.
4.3 Discussion
Figure 1: Correlations for window-based and windowless measures on a 10 million word corpus
correlation seen here (for these datasetsr = 0.235
andr= 0.239respectively) seem very reasonable. What is immediately clear from Figure 1 is that, for the range of parameters tested here, we see a relatively small but statistically significant im-provement across four of the five datasets when adopting the distance-based approach.
The correlations are unsurprisingly lower across the board for the much smaller 1 million word cor-pus. Here, the best distance-based measure statis-tically significantly outperforms the best window-based one (with a significance level of p < 0.0001) on one out of four datasets, while the dif-ferences are not great enough to be considered sta-tistically significant on the other three datasets. There is therefore some evidence that the bene-fits observed with the larger corpus hold in the presence of limited data, which is in support of the general theory that distance-based methods capture more information from the corpus at the co-occurrence level (Washtell, 2009). It remains clear, however, that no method is presently a sub-stitute for using a larger corpus.
In terms of optimum configurations, we find that for the frequency-based approach with the larger corpus, a window size of around +/-10 to +/-50 words more or less consistently produces the best results, irrespective of association the mea-sure. Interestingly on the small corpus the ten-dency appears to be towards a somewhat larger
window size than with the larger corpus. This may be related to the larger windows’ increased resilience to data-sparseness. Somewhat surpris-ingly, we also see that our assymmetric associa-tion measuresSCI andSCIsig perform the best
overall amongst the windowed measures, largely irrespective of the window or corpus, size.
In the large corpus, the best distance-based measure is the asymmetricCW CD, with the sig-nificance corrected measure CW CDsig showing
greater strength in the small corpus: perhaps, again, for its improved reliability in the presence of very low-frequency data. The optimum mean for the distance-based parameterisations is some-where aroundm = −1(the harmonic) tom = 0
(the geometric). We find this unsurprising as the typical distribution of inter-word distances in a corpus is heavily skewed towards the smaller dis-tances - indeed even a random corpus exhibits this characteristic with the distances following a geo-metric distribution.
5 Task II: Agreement with strongest human associations
association measures to predict, and given that there is so little consensus amongst human respon-dents over these items, it is probably not partic-ularly useful to do so. Rather, it might be most useful to predict common or majority human re-sponses.
5.1 Evaluation measure and Upper Bound
For the strongest human response to each cue in the human datasets, its rank was calculated amongst all 33,000 possible responses to that cue, according to each association measure and parameterisation. Where there were tied scores for various responses, a median rank was assigned. As a rough upper bound, we would be impressed by a computer system which was able to predict the most popular human response as often as a randomly selected individual in the human exper-iments happened to chose the most popular re-sponse.
5.2 Task II Results
Figure 2 illustrates the range of computational as-sociation scores attributed to only the strongest human responses. The position of the strongest human response to each cue word, within the computationally-ranked lists of all possible re-sponses, is plotted on the y-axis. For each asso-ciation measure the points are ordered from best to worst along the x-axis. In the ideal case there-fore, the most popular human response for ev-ery cue word would appear at rank 1 amongst the computer-generated responses, resulting in a hori-zonal line at y=1. Generally speaking therefore, the smaller the area above a line the better the per-formance of a measure.
[image:8.595.310.524.171.369.2]Three summary statistics can be derived from Figure 2:
1) The number of most popular human re-sponses that are correctly predicted by a measure is indicated by the x-position at which its line de-parts from y=1. This can be seen to be around 11% for CWCDsig and is zero for the two best PMI
parameterizations, with other illustrated measures performing intermediately.
2) The width of the flat horizontal tails at the op-posite corner of the figure indicate the proportion of the cue words for which a measure was unable to differentiate the strongest human response from the large contingent of zero association scores re-sulting from unobservable co-occurrences. This tail is non-existent for CWCDsig, but afflicts some
25% and 62% of cue words under the two best PMI parameterizations, again with other illus-trated measures performing intermediately.
3) The median rank of the most popular human response for each measure can be read of on the y-axis at the horizontal mid-point (indicated by a feint vertical line).
[image:8.595.308.526.432.645.2]Figure 2: Agreement of computational measures with strongest human responses
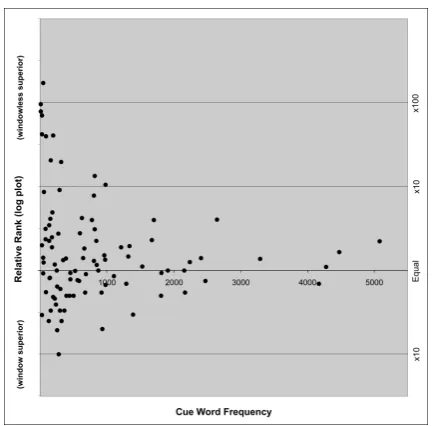
Figure 3: Relative agreement of computational measures with strongest human responses
The results shown are for the Kent dataset, and are highly typical. Included in the figure are the three frequency-based configurations with the highest median rank: SCIsigat window sizesw=
other frequency-based configurations are included for contrast. Also included is the single windowless configuration with the highest median rank -in this case CWCDsig using the harmonic mean.
Several other windowless configurations (notably CWCD and the nearby means) and had very simi-lar profiles.
Figure 3 shows the magnitude of the difference in the ranking of each of the same 100 strong hu-man cue/response pairs, between the best window-less versus best windowed method. Points above the axis represent those cue/response pairs which the windowless method ranked more highly, and vice-versa. The points have been ordered on the x-axis according the the cue word frequency.
5.3 Discussion
Noteworthy, studying Figure 2, is the great sen-sitivity of the frequency-based measures to the window size parameter. There exists a cut-off point, linked to window size, beyond which the frequency-based measures are unable to make any differentiation between the desired human re-sponse and a large portion of the33,000candidate responses. This is almost certainly due to a lack of evidence in the presence of very low frequency words. Log-Likelihood performs somewhat better in this respect, as it takes negative information into account.
Although the distance-based approach follows the same general trend as the other measures, it is nonetheless able to generate a distinct non-zero association score foreverystrong human response and overall it aptly ranks them more highly. A larger number these responses are actually ranked first (i.e. successfully predicted) by the distance-based approach. In fact this number is compara-ble to, and sometimes exceeds, the upper-bound of 10% implied by taking the average proportion of human respondents who give the most popular response to a given cue.
Whilst Figure 2 showed that overall the win-dowless method fairs better, on a per-cue basis (Figure 3) things are a little more interesting: For a little over a third of cue-words the windowed method actually appears to perform somewhat bet-ter. For the majority however, the windowless ap-proach performsconsiderably better(note that the y-axis scale is logarithmic). It can also be seen that the difference between the methods is most pronounced for low frequency cue words, with
re-sponses to some cues exhibiting a relative ranking of around one-hundred times lower for the win-dowed method. This further supports the theory that the windowless methods are better able to ex-ploit sparse data.
6 Conclusions and Future work
This paper presented the first empirical compar-ison of window-based and the relatively recently introduced windowless association measures, us-ing their ability to reproduce human association scores as a testbed. We show that the best win-dowless measures are always at least as good as the best window-based measures, both when it comes to overall correlation with human associ-ation scores and predicting the strongest human response. In addition, for several human associ-ation sets, they perform significantly better. Al-though not all parameter settings and corpus sizes could be explored, we conclude that it is worth-while investigating windowless association mea-sures further. As a side-benefit, we have also in-troduced new variants of existing frequency-based association measures and shown them to perform as well as or better than their existing counterparts. Although these measures were semi-principled in their construction, a deeper understanding of why they work so well is needed. This may in turn lead to the construction of superior windowless mea-sures.
In our own future work, we are especially in-terested in using higher-order windowless associa-tion measures for retrieving paradigmatic relaassocia-tions as well as exploring their use in various NLP ap-plications.
7 Acknowledgements
We would like to extend sincere thanks to Rein-hard Rapp for providing us with the Minnesota dataset in digital form, and additional thanks to Eric Atwell for his support.
References
M. Baroni, S. Evert, and A. Lenci, editors. 2008.Esslli Workshop on Distributional Lexical Semantics. L. Burnard, 1995.Users’ Reference Guide, British
Na-tional Corpus. British National Corpus Consortium, Oxford, England.
K. Church and P. Hanks. 1991. Word association norms, mutual information and lexicography. Com-putational Linguistics, 16(1):22–29.
P. Clark and F.C. Evans. 1954. Distance to near-est neighbor as a measure of spatial relationships in populations. Ecology, 35:445–453.
J. Curran. 2003. From distributional to semantic simi-larity. Ph.D. thesis, University of Edinburgh. Ted Dunning. 1993. Accurate methods for the
statis-tics of surprise and coincidence. Computational Linguistics, 19:61–74.
S. Evert. 2005. The Statistics of Word Cooccurrences: Word Pairs and Collocations. Ph.D. thesis, Insti-tut fr maschinelle Sprachverarbeitung, University of Stuttgart.
D. Hardcastle. 2005. Using the distributional hypothe-sis to derive coocurrence scores from the British Na-tional Corpus. InProc. of Corpus Linguistics. J. Jenkins. 1970. The 1952 Minnesota word
associa-tion norms. In L. Postman and G. Keppel, editors, Norms of word associations, pages 1–38. Academic press.
G. Kent and A. Rosanoff. 1910. A study of association in insanity. Amer. J. of Insanity, pages 317–390. G. Kiss, C. Armstrong, R. Milroy, and J. Piper. 1973.
An associative thesaurus of English and its computer analysis. In A. Aitken, R. Bailey, and N. Hamilton-Smith, editors,The Computer and Literary Studies. Edinburgh University Press.
B. Krenn and S. Evert. 2001. Cam we do better than frequency? a case study on extracting pp-verb collo-cations. InProc. of the ACL Workshop on Colloca-tions.
A. Lamjiri, O. El Demerdash, and L. Kosseim. 2004. Simple features for statistical word sense disam-biguation. InProc. of SENSEVAL-2004.
D. Lin. 1998. Automatic retrieval and clustering of similar words. InProc. of COLING-ACL-98. Lukas Michelbacher, Stefan Evert, and Hinrich
Sch¨utze. 2007. Asymmetric association measures. InProc. of RANLP-2007.
D. Nelson, C. McEvoy, J. Walling, and J. Wheeler. 1980. The University of South Florida homograph norms. Behaviour Research Methods and Instru-mentation, 12:16–37.
S. Pado and M. Lapata. 2007. Dependency-based con-struction of semantic space models. Computational Linguistics, 33(2):161–199.
T. Pedersen, S. Patwardhan, and J. Michelizzi. 2004. Wordnet::similarity - measuring the relatedness of concepts. InProc. of the 21stNational Conference
on Artificial Intelligence; 2004.
R. Rapp. 2002. The computation of word associa-tions: comparing syntagmatic and paradigmatic ap-proaches. InProc of COLING 2002.
D.L. Sackett. 2001. Why randomized controlled tri-als fail but needn’t: 2. failure to employ physiolog-ical statistics, or the only formula a clinician-trialist is every likely to need (or understand). Canadian Medical Association Journal, 165(9):1226–1237. P. Savicki and J. Hlavacova. 2002. Measures of word
commonness. Journal of Quantitative Linguistcs, 9(3):215–231.
E. Terra and C. Clarke. 2004. Fast computation of lexical affinity models. InProc of COLING 2004. Renata Vieira and Massimo Poesio. 2000. An
empirically-based system for processing definite de-scriptions. Computational Linguistics, 26(4), De-cember.
X. Wang, 2005. Robust Utilization of Context in Word Sense Disambiguation, chapter Modeling and Using Context, pages 529–541. Springer Lecture Notes in Computer Science.
J. Washtell. 2009. Co-dispersion: A windowless ap-proach to lexical association. In Proc. of EACL-2009.
M. Wettler and R. Rapp. 1993. Computation of word associations based on the co-ocurrences of words in large corpora. InProc. of the First Workshop on Very Large Corpora.
K. White and L. Abrams. 2004. Free associations and dominance ratings of homophones for young and older adults. Behaviour Research Methods, Instru-ments and Computers, 36:408–420.