Original Article
Pax2 expression correlates with EMT markers in an
experimental model of obstructive nephropathy
Li Li1, Hai-Sheng Xu1, Yu-Bin Wu2, Xiao-Ming Kang1, Jun Yang3, Xian-He Wang1, Qing-Yun Meng1,
Chang-Shan Wang4
1Department of Pediatrics, First Affiliated Hospital of Jiamusi University, Jiamusi 154002, China; 2Department of Pediatric Nephrology, Shengjing Hospital, China Medical University, Shenyang 110004, China; 3Department of Cardiovascular Medicine, First Affiliated Hospital of Jiamusi University, Jiamusi 154002, China; 4College of Basic Medicine, Jiamusi University, Jiamusi 154007, Heilongjiang, China
Received October 7, 2017; Accepted May 16, 2018;Epub July 15, 2018; Published July 30, 2018
Abstract: Introduction: This study investigated the role of PAX2 reexpression during tubular epithelial-mesenchymal transition (EMT) in a unilateral ureteral obstruction (UUO) rat model. Methods: Wistar rats were randomly desig-nated into the sham group and UUO model group, and their kidneys were removed for histological evaluation of
renal damage. The mRNA and protein levels of PAX2, E-cadherin and α-SMA were then quantified. In addition, the expression of PAX2, E-cadherin and α-SMA protein was detected by immunohistochemical analysis. Results: The kidneys of rats from the UUO group revealed significantly higher histological injury scores (6.17 ± 0.86) and larger areas of renal interstitial collagen deposition (33.75 ± 2.37%) compared with the sham group at 14 days (0.15 ± 0.10 and 1.78 ± 0.37%, respectively, both P < 0.05). UUO led to a rapid increase in PAX2 mRNA and protein expres -sion, accompanied with a down-regulation of the epithelial marker E-cadherin and an up-regulation of the mesen-chymal marker α-SMA (P < 0.05). Immunohistochemical double staining of these samples revealed enlarged areas
that stained positively for both PAX2 and α-SMA, but showed decreased E-cadherin expression. The protein levels of PAX2 in renal tubules was positively associated with α-SMA expression (r = 0.977, P < 0.05) and negatively as
-sociated with E-cadherin (r = -0.984, P < 0.05). Conclusion: PAX2 is re-expressed in the renal tubular epithelial cells following obstructive nephropathy, and may participate in EMT during renal interstitial fibrosis.
Keywords: Unilateral ureteral obstruction, epithelial-mesenchymal transition, renal interstitial fibrosis, paired box
2 gene
Introduction
Renal interstitial fibrosis (RIF) is the final mani -festation of chronic kidney disease (CKD),
which leads to renal failure [1, 2]. RIF is charac
-terized by inflammatory cell infiltration, the
ac-cumulation of extracellular matrix (ECM)
com-pounds, as well as fibroblast activation and
proliferation [3, 4]. Renal interstitial cells are a
heterogeneous population that contains fibro -blasts, dendritic cells, and lymphocytes, in addition to other cell types. Long-term
activa-tion of renal interstitial fibroblasts results in
excessive ECM accumulation, ultimately
caus-ing chronic renal fibrosis, perturbed parenchy -mal tissue structure, and impaired organ function.
Tubular epithelial-mesenchymal transition (E-
process in which renal tubular cells lose their epithelial phenotype, involving downregulation
of E-cadherin, and instead acquire phenotypic
characteristics of mesenchymal cells, such as
expression of α-smooth muscle actin (α-SMA)
[6, 8]. During EMT, tubular epithelial cells lose their contact with neighboring cells and under-lying basement membrane, migrate and invade the interstitium where they ultimately turned
into activated fibroblasts [9].
Although EMT contributes to renal fibrosis and
causes a reduction in renal parenchyma, the cellular mechanisms that regulate tubular EMT have yet to be fully elucidated.
Pax2 is upregulated in obstructive nephropathy
tion (MET) conversion or transition. This
earli-est MET follows a structurally well-defined
morphogenetic pathway to generate most of the nephron. The transcription factor paired box 2 (PAX2), plays a crucial role in induc- ing MET in renal tubular cells during embryo- nic kidney development [10]. Normal PAX2
expression is required for regular kidney devel -opment. Nevertheless, overexpression of PAX2
has been associated with RIF in renal tissue, thus suggesting that PAX2 contributes to RIF
onset and progression [11].
In this study, we established a unilateral ure-teral obstruction (UUO) rat model to simula-
te the pathophysiological features of RIF. We
tested whether re-expression of PAX2 pl-
ays a role in RIF by promoting EMT in a UUO rat model. Furthermore, we investigate
whether the correlation between the levels
of PAX2 expression with those of both
α-SMA and E-cadherin has any physiological relevance.
Methods and materials
Experimental animals
A total of 64 male Wistar rats (specific patho
-gen-free (SPF) level, weight range between
120-150 g, 4-6 weeks old) were provided by the Animal Experimental Center of Jiamusi University. The rats were randomly divided in-
to either the sham group (n = 32) or the UUO group (n = 32) using a random numbers table.
This study was carried out in strict accordance with the National Institutes of Health (NIH) Guide for the Care and Use of Laboratory Animals. The protocol was approved by the Committee on the Ethics of Animal Experiments of the Jiamusi University (Permit Number: JMSU-186).
group excluded the ureteral ligation and cutting steps. At day 3, 5, 7 and 14 following operation,
eight rats were sacrificed per group with an
overdose of pentobarbital sodium, and their
left kidneys were subsequently harvested.
Histological analysis
Sections of left kidney tissue were stained with haematoxylin and eosin (H&E) for
subse-quent imaging using a light microscope
(Ol-ympus, Tokyo, Japan). Images were used to evaluate the severity of renal interstitial injury according to the following three parameters: tubule proteinaceous casts and dilation,
inter-stitial inflammation, and interinter-stitial fibrosis.
Each parameter was assigned a score from 0
to 3 according to severity (0 = none, 1 = mild, 2 = moderate, 3 = severe), and these scores were
added together to yield an overall tubulointer-stitial score between 0 and 9. To determine the degree of collagen accumulation, kidney sec-tions were stained with Masson’s trichrome (Zhongshan Biochemical, Beijing, China) and
quantitatively measured using NIS-Elements
BR 2.10 software (Nikon, Tokyo, Japan). Ten in-
dependent images (400× magnification) were
randomly selected from each sample. The ra- tio of the interstitial collagen deposit area (col-ored in blue) to the total renal interstitial area was determined, and the mean values of these
estimates were then used in subsequent
analyses.
Immunohistochemical analysis
The following primary antibodies were utilized throughout these studies: rabbit anti-rats PAX2 monoclonal antibody (dilution 1:100, Zymed
Laboratories, San Francisco, CA, USA); mouse
anti-rat E-cadherin (dilution 1:100, Santa Cruz,
CA, USA) and α-SMA monoclonal antibody (dilu
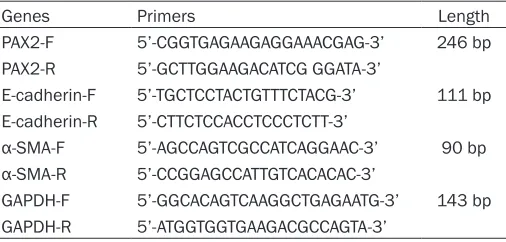
-Table 1. Real-time PCR primers
Genes Primers Length
PAX2-F 5’-CGGTGAGAAGAGGAAACGAG-3’ 246 bp PAX2-R 5’-GCTTGGAAGACATCG GGATA-3’
E-cadherin-F 5’-TGCTCCTACTGTTTCTACG-3’ 111 bp E-cadherin-R 5’-CTTCTCCACCTCCCTCTT-3’
α-SMA-F 5’-AGCCAGTCGCCATCAGGAAC-3’ 90 bp
α-SMA-R 5’-CCGGAGCCATTGTCACACAC-3’
GAPDH-F 5’-GGCACAGTCAAGGCTGAGAATG-3’ 143 bp GAPDH-R 5’-ATGGTGGTGAAGACGCCAGTA-3’
Surgical procedures and sample
preparation
All surgery was performed under so- dium pentobarbital anesthesia, and all efforts were made to minimize suf-fering. After anaesthetized, the left
ureter was identified through a small
[image:2.612.92.345.84.205.2]tion 1:100, Santa Cruz, CA, USA). Immunohis- tochemical staining was performed according to the manufacturer’s instructions (Zhongshan Golden Bridge Biotechnology, Beijing, China).
Briefly, following antigen retrieval, the sections
were incubated with PAX2 and either E-cadherin
or α-SMA primary antibodies at 4°C overnight. Then the sections were incubated with both biotinylated goat rabbit secondary anti-body and alkaline phosphatase (AP)-conjugated goat anti-mouse secondary antibody (1:1 vol-ume) for 30 min. The reaction was then visual-ized using 3, 3’-Diaminobenzidine (DAB) and AP red. The sections were rinsed with water and counterstained with Mayer’s hematoxylin. Western blotting
Samples of renal cortex isolated from rats (100 mg per sample) were lysed, and total protein
was quantified using the bicinchonic acid (BCA)
method. Protein samples (50 g) were loaded onto a polyacrylamide gel and subjected to sodium dodecyl sulfate polyacrylamide gel electrophoresis (SDS-PAGE). Proteins were
then electroblotted onto a polyvinylidene difluo
-ride (PVDF) membrane. The membrane was
blocked with 5% fat-free milk at 4°C overnight, followed by incubation with PAX2, α-SMA, E-cadherin and β-actin (control) primary anti -bodies (all diluted at 1:1000) at 37°C for 2 h. Membranes were then washed three times and incubated at room temperature for 1 h with horseradish peroxidase-conjugated secondary antibodies (1:500 dilution, Santa Cruz, CA, USA). The density of the corresponding bands was measured using image analysis software (Quantity One-4.4.0, Bio-Rad Laboratories, Hercules, CA, USA) and corrected according to
the value of the β-actin control.
Real-time polymerase chain reaction (PCR)
Total RNA (500 ng) was extracted, and was reverse-transcribed into complementary DNA (cDNA) using the PrimeScriptTM RT Reagent KIT (Takara, Otsu, Shiga, Japan). The primer
sequences that were used for RT-PCR
analys-es are shown in Table 1. Real-Time PCR was performed using the ABI 7500 real-time PCR
system (Applied Biosystems, Foster City, CA,
[image:3.612.91.526.71.289.2]USA). Thermal cycling conditions included: 40 cycles of 95°C for 10 sec, 95°C for 5 sec and 60°C for 34 sec. Melt Curve: 95°C for 15 sec, Figure 1. Histological analysis of kidney tissue by haematoxylin and eosin (A1-A4) and Masson’s trichrome staining
(B1-B4). Magnification, 400×. A1. Normal morphology of tubule structures in the sham group; A2. Day 3 following UUO, tubulointerstitial inflammatory cell infiltration; A3. Day 7 following UUO, tubular dilation and interstitial edema;
A4. Day 14 following UUO, severe damage of tubule structure, tubular atrophy, collapse of tubular lumen, massive
necrosis of epithelial cells, infiltration of macrophages and lymphocytes, and fibroblast proliferation. B1. Renal
section from sham-operated rats; B2. Day 3 following UUO, a small amount of interstitial collagen accumulation in kidney tissue; B3. Day 7 following UUO, increased interstitial collagen accumulation; B4. Day 14 following UUO,
Pax2 is upregulated in obstructive nephropathy
60°C for 1 min, and 95°C for 15 sec. A stan-dard curve was generated by using serial dilu-tions of an established template. The relative mRNA concentration in each sample was calcu-lated using the 2-ΔΔCT method.
Statistical analysis
Statistical analyses were performed using the SPSS software package (version 17.0; SPSS Inc, USA). Data were analyzed using t tests and one-way analyses of variance (ANOVA) to evalu-ate inter-group and intra-group differences, respectively. Correlations between data were
analyzed using the Pearson test. P < 0.05 was
used as the threshold for determining
statisti-cal significance.
Results
Histologically abnormalities in UUO-treated kidneys
The kidneys of rats in the control group showed a normal shape with a notably smooth surface. This was in stark contrast to the appearance of kidneys from the UUO-treated rats, which were dilated and showed dramatic thinning of the renal parenchyma and hydronephrosis.
In the H&E-stained sections, the sham group exhibited normal tubules with proper morphol-ogy and organization (Figure 1A). However, at day 3 following the operation, the UUO group showed signatures of tubular dilation in addi-tion to tubulointerstitial lymphocyte and
mono-cyte infiltration. At day 14, UUO group tubule
rounding capillaries, but rarely visible in the interstitium surrounding the tubules (Figure 1B). We found that interstitial collagen
accumu-lation in the rat kidney tissue significantly
increased following UUO, which persisted with prolonged obstruction. UUO also caused a dra-matic widening of the renal interstitium as well as an increase in stromal cell number and ECM
components. The UUO group also had a signifi -cantly larger area of renal interstitial collagen deposition when compared with the sham
group (P < 0.05 at each time point after UUO,
Table 3).
mRNA levels of PAX2, α-SMA and E-cadherin
As shown in Figure 2, PAX2 mRNA expression was up-regulated at day 3 following UUO when
compared with the sham group (P < 0.05).
Notably, this increase in mRNA expression became more pronounced with extended
obstruction time (P < 0.05, at each time point). Furthermore, a similar increase in α-SMA mRNA
expression was also detected. Conversely, whereas E-cadherin was highly expressed in the renal cortex of rats in the sham group, its expression was remarkably downregulated
fol-lowing UUO treatment (P < 0.05 at all time
points).
Protein levels of PAX2, α-SMA and E-cadherin
Upon ligation of the left ureter at day 3, PAX2 protein levels rose rapidly in the affected kid-ney. By 14 days following UUO, renal PAX2
[image:4.612.90.362.97.137.2]expression was significantly elevated compar-
Table 2. Renal tubular injury score in each group (0-9, mean ± SEM, n = 8)
3 d 5 d 7 d 14 d
Sham 0.12 ± 0.03 0.13 ± 0.05 0.11 ± 0.02 0.15 ± 0.10
UUO 2.53 ± 0.26* 3.75 ± 0.65** 4.61 ± 0.73** 6.17 ± 0.86** *P < 0.05, compared to the sham group; **P < 0.05, intra-group comparison in
UUO group.
Table 3. Relative area of renal interstitium in each group (%, mean ± SEM, n = 8)
3 d 5 d 7 d 14 d
Sham 1.70 ± 0.21 1.51 ± 0.33 1.55 ± 0.72 1.78 ± 0.37
UUO 7.57 ± 1.01* 15.28 ± 1.76** 23.67 ± 2.11** 33.75 ± 2.37** *P < 0.05, compared to the sham group; **P < 0.05, intra-group comparison in
UUO group.
structures were severely dam-aged, showing signs of tubular atrophy, collapse of tubular lumen, massive necrosis of
epi-thelial cells, infiltration of macro
-phages and lymphocytes, fibro -blast proliferation and excessive collagen deposit. The UUO group
had a significantly higher histo -logical injury score compared
with the control sham group (P <
0.05 at each time point after UUO, Table 2).
sur-Figure 2. The mRNA expression of PAX2, E-cadherin and α-SMA detected by real time-PCR. Amplification curves of PAX2 (A1), E-cadherin (A2), α-SMA (A3) and GAPDH (A4). Melting curves of PAX2 (B1, 87°C), E-cadherin (B2, 83.5°C), α-SMA (B3, 83.5°C) and GAPDH (B4, 84°C). Quantification of the mRNA levels of PAX2
(C), E-cadherin (D) and α-SMA (E), and corrected by reference to the value of GAPDH. aP < 0.05 compared to the sham group; bP < 0.05, intra-group comparison (vs.
[image:5.792.94.704.77.437.2]Pax2 is upregulated in obstructive nephropathy
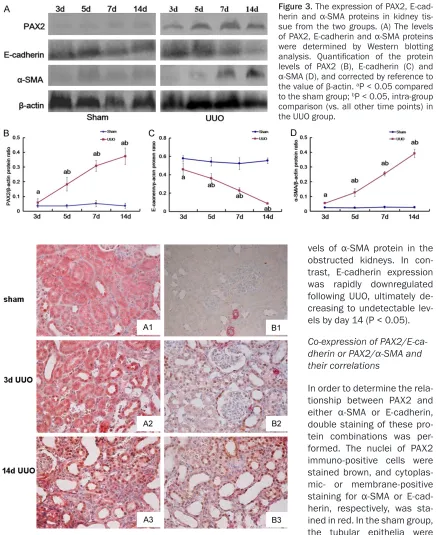
[image:6.612.89.525.69.604.2]ed with the sham group (Figure 3, P < 0.05). no co-expression between PAX2 and E-cad- Figure 3. The expression of PAX2,
E-cad-herin and α-SMA proteins in kidney tis -sue from the two groups. (A) The levels
of PAX2, E-cadherin and α-SMA proteins
were determined by Western blotting
analysis. Quantification of the protein
levels of PAX2 (B), E-cadherin (C) and
α-SMA (D), and corrected by reference to the value of β-actin. aP < 0.05 compared
to the sham group; bP < 0.05, intra-group
comparison (vs. all other time points) in the UUO group.
Figure 4. Immunohistochemical double staining for PAX2 and E-cadherin (or
α-SMA) was performed. The nuclei of PAX2 immuno-positive cells is stained
brown, and membrane- or cytoplasmic-positive staining for E-cadherin or
α-SMA, respectively, is stained in red. The co-expression of PAX2/E-cadherin or PAX2/α-SMA is indicated with arrows. Magnification, 200×. PAX2/E-cad
-herin-positive cells were identified in rats from the sham group (A1), UUO group at day 3 (A2), and UUO group at day 14 (A3). PAX2/α-SMA-positive cells were identified in rats from the sham group (B1), UUO group at day 3 (B2),
and UUO group at day 14 (B3).
vels of α-SMA protein in the
obstructed kidneys. In con-trast, E-cadherin expression was rapidly downregulated following UUO, ultimately de- creasing to undetectable
lev-els by day 14 (P < 0.05).
Co-expression of PAX2/E-ca
-dherin or PAX2/α-SMA and their correlations
In order to determine the rela-tionship between PAX2 and
either α-SMA or E-cadherin,
double staining of these pro-tein combinations was per-formed. The nuclei of PAX2 immuno-positive cells were stained brown, and cytoplas-mic- or membrane-positive
staining for α-SMA or
E-cad-herin, respectively, was sta- ined in red. In the sham group, the tubular epithelia were completely devoid of PAX2 staining, but showed exten-sive staining of E-cadherin. Similar to PAX2, expression
of α-SMA was also rarely
Three days after the UUO operation, positive staining for PAX2 was detected in the tubular epithelia, while E-cadherin staining was notably decreased. The continuous enhancement of PAX2 expression and simultaneous decrease in E-cadherin expression were observed until
day 14. Similar to PAX2, α-SMA expression was significantly enhanced in tubular epithelia and
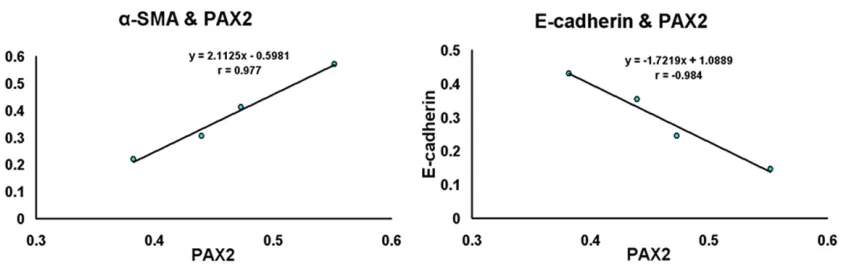
the interstitial area at day 3 following UUO, and its expression consistently increased with prolonged obstruction (Figure 4). To determine
the significance of this observed correlation,
we evaluated the association of PAX2 levels
with α-SMA or E-cadherin levels using the
Pe-arson correlation test. These analyses revealed that PAX2 protein expression in renal tubules was positively-associated with α-SMA protein
levels (r = 0.977, P < 0.05), and negatively-associated with E-cadherin protein levels (r = -0.984, P < 0.05; Figure 5).
Discussion
Epithelial cell-cell junctions are important for maintaining both cell polarity and tissue integ-rity. E-cadherin is encoded by the tumor sup-pressor gene CDH1, and is a homophilic adhe-sion molecule that localizes to epithelial adherens junctions [12]. In addition, E-cadherin is known to play a key role in maintaining ma- ture epithelial cells in a differentiated state [13]. It was previously reported that E-cadhe- rin suppresses EMT by down-regulating
lym-phocyteenhancer factor-1 (LEF-1), which pre
-vents β-catenin nuclear localization. This in turn inhibits Wnt/β-catenin pathway
activa-tion that is typically associated with promoting EMT [14, 15]. Therefore, down-regulation of
E-cadherin is considered to be one of the key events that driving early EMT initiation. In this study, we revealed that E-cadherin was highly expressed in the renal cortex of control rats. Remarkably, UUO led to a rapid down-regula-tion in E-cadherin mRNA and protein expres-sion, suggesting that renal epithelial cells ulti-mately lose their epithelial characteristics following UUO.
RIF is characterized by the accumulation of
ECM components and the loss of proper tubu-lar architecture. Excessive production and deposition of interstitial ECM has been
attrib-uted to the hyperproliferation of myofibroblasts
that results from de novo activation of α-SMA. α-SMA is an actin isoform that predominates
in vascular and visceral smooth muscle [16].
α-SMA-positive fibroblasts and myofibroblasts
have been found in both acute and chronic renal injury [17]. In obstructive nephropathy,
activated myofibroblasts stop proliferating and
instead produce large amounts of ECM,
ulti-mately resulting in interstitial fibrosis.In this study, α-SMA expression increased rapidly and
persistently in obstructed kidneys following UUO, and these changes were consistent with the dramatic ECM accumulation observed. Taken together, the simultaneous decrease in
E-cadherin and increase in α-SMA expression
[image:7.612.99.521.70.203.2]observed in these studies further reinforces the conclusion that UUO in renal tissue pro-motes EMT. The PAX2 genes encode a family of developmentally-controlled proteins that have fundamental roles in kidney development [18]. During embryonic kidney development, PAX2 helps to initiate a genetic cascade, which con-trols a complex series of events that ultimately Figure 5. Correlations between data were analyzed using the Pearson test. These analyses revealed that PAX2
Pax2 is upregulated in obstructive nephropathy
leads to a mesenchymal-to-epithelial conver-sion [19]. When nephrogenesis is complete, PAX2 is down-regulated and thereafter sus-tained at very low levels in mature kidneys [20, 21]. In addition, PAX2 was reported to have an anti-apoptotic function, and is likely to be reac-tivated after renal injury to limit apoptotic
dam-age [22-24]. Following acute tubular necrosis,
transient expression of PAX2 was detected in proximal tubular epithelial cells during the pro-cess of regeneration [24]. Cohen et al. report- ed that reactivation of PAX2 protects renal col-lecting duct cells against apoptosis that would typically be induced by obstructive injury [22]. Our previous studies demonstrated that re-expression of PAX2 in a UUO rat model occurs primarily in the renal tubular epithelial cells. Additionally, we showed that PAX2 protein lev-els positively correlated with both the severity of renal tubular damage and the levels of renal
interstitial fibrosis, thus indicating that PAX2 might participate in RIF pathogenesis [25, 26].
To date, however, there has been little evidence of PAX2’s direct involvement in renal tubular EMT. In this study, double staining of PAX2/α -SMA and PAX2/E-cadherin was performed to determine whether there was a notable
rela-tionship between their expression profiles. In
the sham group, tubular epithelia were mostly
PAX2- and α-SMA negative, but showed dra -matic E-cadherin staining. Interestingly, PAX2 and α-SMA expression gradually increased following UUO and the positively-stained PAX2/
α-SMA areas were significantly enhanced by
day 14. Contrastingly, E-cadherin expression decreased over the time following obstruction. Pearson correlation analyses further reveal- ed that PAX2 protein levels in renal tubules were positively associated with α-SMA (r = 0.977, P < 0.05), but not E-cadherin protein lev
-els (r = -0.984, P < 0.05). These findings sug -gest that PAX2 re-expression is accompanied by the down-regulation of the epithelial marker E-cadherin and up-regulation of the mesenchy-mal marker α-SMA. Therefore, PAX2 is likely involved in the process of EMT during renal
fibrosis. Furthermore, EMT is generally consid -ered as a reverse process of MET, which occurs during the embryonic development of the mam-malian kidney [27]. Given the powerful anti-apoptotic role of PAX2, we hypothesize that PAX2 is re-activated during the early stages of obstructive nephropathy due to a
compensato-ry mechanism. Following obstruction,
over-expression of PAX2 not only activates renal tubular epithelial cell transdifferentiation, but also promotes EMT by stimulating complex signaling pathways [9, 28]. Thus, re-expres- sion of PAX2 initially serves as a protective response against renal damage, but ultimately
leads to EMT and renal interstitial fibrosis. The
molecular mechanism by which PAX2 induces
EMT is still unknown and will require further
investigation.
Conclusions
In conclusion, the embryonic developmental gene PAX2 is re-expressed in the renal tubular epithelial cells following obstructive nephropa-thy. PAX2 re-expression is accompanied by
up-regulation of the mesenchymal marker α-SMA
and down-regulation of the epithelial marker E-cadherin. Therefore, PAX2 likely participates in EMT during the process of renal interstitial
fibrosis. Gaining additional insight into PAX2’s
role in driving EMT would provide ideas for ther-apeutic approaches to retarding the pathologi-cal progression of obstructive nephropathy.
Acknowledgements
Thanks to Professor Yubin Wu at the China Medical University for his assistance with this study. This work was supported by funding from
the Youth Science Foundation Projects of
Heilongjiang Province (No. QC2012C119), the Key Science and Technology Project of Jiamusi University (No. Sz2014-011), the National Cultivating Project of Jiamusi University (No. JMSUJCGP2016-005) and the Youth academic backbone support project of Heilongjiang Province (No. 1253G057).
Disclosure of conflict of interest
None.
Address correspondence to: Chang-Shan Wang, College of Basic Medicine, Jiamusi University, No. 148 Xuefu St, Jiamusi 154007, Heilongjiang, China.
Tel: +88613945470064; Fax: +88613945470064;
E-mail: [email protected]
References
[1] Kushiyama T, Oda T, Yamada M, Higashi K, Ya-mamoto K, Sakurai Y, Miura S and Kumagai H. Alteration in the phenotype of macrophages in
the repair of renal interstitial fibrosis in mice.
[2] Xie XS, Liu HC, Wang FP, Zhang CL, Zuo C, Deng Y and Fan JM. Ginsenoside Rg1 modula -tion on thrombospondin-1 and vascular endo-thelial growth factor expression in early renal
fibrogenesis in unilateral obstruction. Phytoth -er Res 2010; 24: 1581-1587.
[3] Bascands JL and Schanstra JP. Obstructive ne-phropathy: insights from genetically engi-neered animals. Kidney Int 2005; 68: 925-937.
[4] Razzaque MS and Taguchi T. Cellular and mo -lecular events leading to renal
tubulointersti-tial fibrosis. Med Electron Microsc 2002; 35:
68-80.
[5] Chevalier RL. Chronic partial ureteral obstruc-tion and the developing kidney. Pediatr Radiol 2008; 38 Suppl 1: S35-40.
[6] Liu Y. Epithelial to mesenchymal transition in
renal fibrogenesis: pathologic significance, mo -lecular mechanism, and therapeutic interven-tion. J Am Soc Nephrol 2004; 15: 1-12. [7] Wynn TA. Cellular and molecular mechanisms
of fibrosis. J Pathol 2008; 214: 199-210.
[8] Kalluri R and Weinberg RA. The basics of epi-thelial-mesenchymal transition. J Clin Invest 2009; 119: 1420-1428.
[9] Li L, Wu Y and Yang Y. Paired box 2 induces epithelial-mesenchymal transition in normal renal tubular epithelial cells of rats. Mol Med Rep 2013; 7: 1549-1554.
[10] Zhou TB. Signaling pathways of PAX2 and its
role in renal interstitial fibrosis and glomerulo -sclerosis. J Recept Signal Transduct Res 2012; 32: 298-303.
[11] Murer L, Caridi G, Della Vella M, Montini G, Carasi C, Ghiggeri G and Zacchello G. Expres-sion of nuclear transcription factor PAX2 in re-nal biopsies of juvenile nephronophthisis. Nephron 2002; 91: 588-593.
[12] Taso CJ, Lin HS, Lin WL, Chen SM, Huang WT and Chen SW. The effect of yoga exercise on improving depression, anxiety, and fatigue in women with breast cancer: a randomized con-trolled trial. J Nurs Res 2014; 22: 155-164. [13] Sun S, Sun W, Xia L, Liu L, Du R, He L, Li R,
Wang H and Huang C. The T-box transcription
factor brachyury promotes renal interstitial fi -brosis by repressing E-cadherin expression. Cell Commun Signal 2014; 12: 76.
[14] Orsulic S, Huber O, Aberle H, Arnold S and Ke-mler R. E-cadherin binding prevents beta-catenin nuclear localization and beta-beta-catenin/
LEF-1-mediated transactivation. J Cell Sci
1999; 112: 1237-1245.
[15] Zhao JH, Luo Y, Jiang YG, He DL and Wu CT. Knockdown of beta-catenin through shRNA cause a reversal of EMT and metastatic
pheno-types induced by HIF-1alpha. Cancer Invest
2011; 29: 377-382.
[16] Arnoldi R, Hiltbrunner A, Dugina V, Tille JC and Chaponnier C. Smooth muscle actin isoforms: a tug of war between contraction and compli-ance. Eur J Cell Biol 2013; 92: 187-200. [17] Strutz F and Zeisberg M. Renal fibroblasts and
myofibroblasts in chronic kidney disease. J Am
Soc Nephrol 2006; 17: 2992-2998.
[18] Narlis M, Grote D, Gaitan Y, Boualia SK and Bouchard M. Pax2 and pax8 regulate branch-ing morphogenesis and nephron differentia-tion in the developing kidney. J Am Soc Nephrol 2007; 18: 1121-1129.
[19] Rothenpieler UW and Dressler GR. Pax-2 is
re-quired for mesenchyme-to-epithelium conver -sion during kidney development. Development 1993; 119: 711-720.
[20] Luu VD, Boysen G, Struckmann K, Casagrande S, von Teichman A, Wild PJ, Sulser T, Schraml P and Moch H. Loss of VHL and hypoxia provokes PAX2 up-regulation in clear cell renal cell carci-noma. Clin Cancer Res 2009; 15: 3297-3304. [21] Zhou TB, Qin YH, Zhou C, Lei FY, Zhao YJ, Chen
J, Su LN and Huang WF. Less expression of pro -hibitin is associated with increased caspase-3 expression and cell apoptosis in renal
intersti-tial fibrosis rats. Nephrology (Carlton) 2012;
17: 189-196.
[22] Cohen T, Loutochin O, Amin M, Capolicchio JP, Goodyer P and Jednak R. PAX2 is reactivated in urinary tract obstruction and partially protects collecting duct cells from programmed cell death. Am J Physiol Renal Physiol 2007; 292:
F1267-1273.
[23] Dziarmaga A, Hueber PA, Iglesias D, Hache N, Jeffs A, Gendron N, Mackenzie A, Eccles M and Goodyer P. Neuronal apoptosis inhibitory pro-tein is expressed in developing kidney and is regulated by PAX2. Am J Physiol Renal Physiol
2006; 291: F913-920.
[24] Imgrund M, Grone E, Grone HJ, Kretzler M, Hol-zman L, Schlondorff D and Rothenpieler UW. Re-expression of the developmental gene Pax-2 during experimental acute tubular necrosis in mice 1. Kidney Int 1999; 56: 1423-1431. [25] Li L, Wu Y, Wang C and Zhang W. Inhibition of
PAX2 gene expression by siRNA (polyethyleni-mine) in experimental model of obstructive
ne-phropathy. Ren Fail 2012; 34: 1288-1296.
[26] Li L, Wu Y and Zhang W. PAX2 re-expression in renal tubular epithelial cells and correlation
with renal interstitial fibrosis of rats with ob
-structive nephropathy. Ren Fail 2010; 32:
603-611.
[27] Horster MF, Braun GS and Huber SM. Embry -onic renal epithelia: induction, nephrogenesis, and cell differentiation. Physiol Rev 1999; 79: 1157-1191.