Abstract—During operation, outdoor insulators may severe a certain degree of pollution which may reduce their performances such as surface resistance and flash over voltages. Under these conditions a large leakage current (LC) may flow on the surface and degradation may take place. Leakage current on 20 kV post-pin ceramic insulators were investigated under several artificial pollution levels. An AC voltage up to 60 kV was applied to the insulator samples under clean and salt fog conditions. The LC waveforms were measured using a digital storage oscilloscope and the digital data was transferred to a personal computer for further analysis. The experimental results indicated that in general the LC waveforms were distorted from sinusoidal. The distortion strongly correlated with the pollution levels, fog conditions and applied voltage. At particular condition, asymmetrical behavior of the LC waveform between positive and negative half cycles was observed. In order to get a better understanding of the insulator behaviors, electrical circuit model is proposed. The insulator is represented by an electrical circuit that produces LC waveform when a sinusoidal voltage is applied. In general, electrical circuit consists of capacitor(s), nonlinear resistor(s), and arc model(s). Using the proposed electrical circuit, computer simulation of the leakage current was done by using ATP/EMTP. The simulated leakage current waveforms were compared to those obtained from experiment. The similarity of the simulated and experimental leakage currents was assessed by using their magnitude, dominant harmonic components, total harmonic distortion (THD) and asymmetry of the LC. The results showed good similarity between measured and simulated leakage current waveforms which indicated the validity of the proposed model.
Index Terms—Outdoor insulator, leakage current, electrical equivalent circuit, computer simulation.
I. INTRODUCTION
Due to large demand on electric power, the electric power generation, transmission and distribution in the world has been steadily increased. For transmitting and distributing the electric power, insulators is one of the most important parts. Outdoor insulator are commonly used in an electric power system to isolate among live parts and between live part and ground and as mechanical protector. The insulators are widely used at substations, transmission as well as distribution networks.
Authors are with the School of Electrical Engineering and Informatics, Bandung Institute of technology, Bandung 40132, INDONESIA. (e-mail: [email protected]).
Ceramic insulators are widely used in power system since long time ago. At present time the insulators are still widely being used. Ceramic insulator has good mechanical and electrical properties and less expensive. As outdoor insulator it may severe a certain degree of pollution and other environmental factors which may reduce their surface resistance. The reduction of surface resistance may enhance the leakage current to flow on the surface[1]. Leakage current (LC) with large magnitude and contains harmonic components flow on the surface for long period may cause degradation of the insulator surface[2-4]. In long term the degradation may lead to the flashover of the insulators and it is necessary to diagnosed [5]. Therefore, investigation on the leakage current on the ceramic insulators under polluted condition is important. The flashover of the insulator is also necessary to be investigated. This paper reports the experimental results on the investigation on leakage current, and flash over characteristics of ceramic insulators.
II. EXPERIMENT AND TYPICAL LEAKAGE CURRENT WAVEFORM
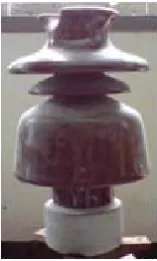
[image:1.595.387.466.558.689.2]The samples used in this experimet were ceramic 20 kV insulators which are widely used in Indonesian power system as shown in figure 1. A test hamber made from aluminium panel with dimension of 900 x 900 x 1200 mm3 was used to simulate pollution exposed to the samples. The front opening of the test chamber was made from acrylic to facilitate the observation of arcing on the sample surface.
Fig. 1. 20 kV insulator sample
AC high voltage with frequency of 50 Hz was applied to the insulators. The leakage current flowed on the insulator surface was measured by measuring the voltage across a series resistance using a Digital Oscilloscope TDS 220 with digitizer of 8 bit, bandwidth of 100 MHz, and the maximum
Properties of Leakage Current on 20 kV
Ceramic Insulators and Computer Simulation
Based on Electrical Equivalent Circuit
sampling rate of 1 GS/s. The measurement system was able to record the waveforms of leakage currents. The digital data was transferred to a personal computer trough a GPIB for further analysis. Harmonic content of LC was analyzed using FFT (Fast Fourier Transform).
Figure 2 shows typical leakage current waveform (a) and harmonics components (b) of clean insulator under clean fog at 60 kV. Figure 2 (a) clearly shows that the waveform is distorted from its sinusoidal form. The distortion was caused by the non linearity voltage-current behavior of the insulator surface and possible appearance of surface discharges. The distorted leakage current waveform contained harmonics components with frequency of higher than 50 Hz as shown in figure 1(b). The dominant harmonics are 3rd (150 Hz), 5th (250 Hz) and 7th (350 Hz)
(a)
[image:2.595.314.549.99.188.2](b)
Fig 2 Typical leakage current waveform (a) and harmonic components (b) of clean insulator under clean fog
at applied voltage of 60 kV
III. EQUIVALENT CIRCUIT MODEL AND SIMULATION OF LEAKAGE CURRENT
A. Equivalent circuit of insulator
The general equivalent circuit model for insulator is shown in figure 3[6]. It consists of capacitor(s), nonlinear resistor(s), and arcing circuit(s). The capacitor and nonlinear resistor connected in parallel, while the arcing circuit connected series with the nonlinear resistor. The 2 diodes were introduced to simulate the asymmetrical behavior of positive and negative half cycle leakage current waveforms. By using the equivalent circuit leakage current waveforms were simulated using ATP program. Validation of the proposed equivalent circuit model and its parameters is done by analyzing and comparing experimental results and the simulation results. Validity of the simulated results were
assessed using the comparison in amplitude, dominant harmonics and the total harmonic distortion with the LC waveform obtained from experiment.
Fig. 3 general equivalent circuit model of insulator
B. Leakage current for clean insulator under clean fog
(a)
[image:2.595.62.277.243.537.2](b)
Fig. 4 typical simulated LC waveforms for clean sample under clean fog at applied voltages of (a) 20 kV,(b) 40 kV and (c) 60 kV
‐0.8
‐0.6
‐0.4
‐0.2 0 0.2 0.4 0.6 0.8
0 500 1000 1500 2000 2500 3000
m A
t
Leakage Current (40kV)
(a)
‐1.5
‐1
‐0.5 0 0.5 1 1.5
0 500 1000 1500 2000 2500 3000
m A
t
Leakage Current (60kV)
(b)
Fig. 5 Typical experimental LC waveforms for clean sample under clean fog at applied voltages of (a) 40 kV and (b) 60
[image:2.595.339.508.248.482.2] [image:2.595.329.521.516.746.2]Fig. 4 shows simulated leakage current waveforms for clean sample under clean fog at applied voltages of 40 and 60 kV. The results are similar with LC waveforms obtained from experiment as shown in figure 5. The similarity of the simulated and experimental LC waveforms are indicated by their amplitude, dominant harmonics, total harmonic distortion (THD) and symmetry. They are presented in table 1. In general LC magnitude and THD increased with applied voltage. At low voltage dominant harmonic was 5th while under higher voltage 3rd and 7th harmonics also appeared. All LC waveforms are symmetrical.
Table 1
Comparison between measured and simulated LC waveforms for clean sample under clean fog
Measured LC Simulated LC
40 kV
- Amplitude of LC -Dominant harmonic - THD
- Positive & negative symmetry
- 0.6 mA - 5, 7, 3
- 22.03 % - symmetrical
- 0.6 mA - 5, 7, 3
- 21.25%
- symmetrical
60 kV
- Amplitude of LC - Dominant harmonic - THD
- Positive & negative symmetry
- 1 mA - 5, 7, 3
- 23.1% - symmetrical
- 1 mA - 5, 7, 3
- 22.988 %
- symmetrical
C. Leakage current for kaolin-salt polluted insulator with conductivity of 3.6 mS under clean fog
(a)
(b)
[image:3.595.329.523.316.748.2](c)
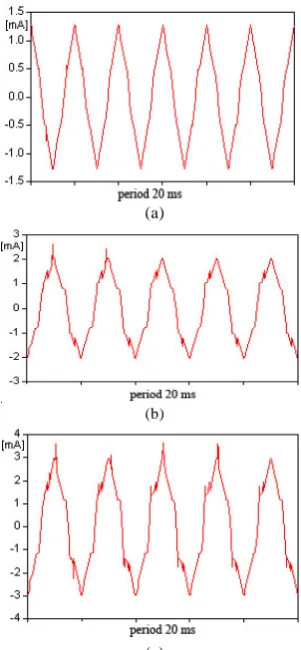
Fig. 6 Typical simulated LC waveforms for kaolin-salt polluted insulator of 3.6 mS in clean fog at applied voltage of
(a) 20 kV,(b) 40 kV and (c) 60 kV
Fig. 6 shows simulated leakage current waveforms for kaolin-salt polluted sample with conductivity of 3.6 mS under clean fog at applied voltages of 20, 40 and 60 kV. The results are similar with LC waveforms obtained from experiment as shown in figure 7. The comparison of the simulated and experimental LC waveforms in term of amplitude, dominant harmonics, total harmonic distortion (THD) and symmetry are shown in table 2.
In general LC magnitude and THD increased with applied voltage. At applied voltage of 20 kV the LC waveform was slightly distorted from sinusoidal, the dominant harmonic component was 5th. The LC waveform is symmetrical between positive and negative half cycles. However, when applied voltage was increased from 20 kV to 40 kV, the LC magnitude increased fr4om 1.3 mA to 2 mA. The 2nd, 3rd and 7th harmonic components became dominant. The LC waveform was asymmetrical. The appearance of 2nd harmonics indicated the asymmetrical behavior.
Similar results were observed under applied voltage of 60 kV. In general, leakage current magnitude, the waveform distortion and THD increased with applied voltage.
‐1.5
‐1
‐0.5 0 0.5 1 1.5
0 500 1000 1500 2000 2500 3000
m A
t
Leakage Current (20kV)
(a)
‐3
‐2
‐1 0 1 2 3
0 500 1000 1500 2000 2500 3000
m A
t
Leakage Current (40kV)
(b)
‐4
‐3
‐2
‐1 0 1 2 3 4
0 500 1000 1500 2000 2500 3000
m A
t
Leakage Current (60kV)
(c)
Fig. 7 Typical experimental LC waveforms for kaolin-salt polluted insulator with conductivity of 3.6 mS in clean fog at applied voltage
[image:3.595.91.242.433.759.2]Table 2
Comparison between measured and simulated LC waveforms for kaolin-salt polluted sample under clean fog
Measured LC Simulated LC
20 kV
- Amplitude of LC - Dominant harmonic - THD - Positive & negative symmetry
- 1.3 mA - 5
- 9.81 %
- symmetrical
- 1.3 mA - 5
- 9.83 %
- symmetrical
40 kV
- Amplitude of LC - Dominant harmonic
- THD - Positive & negative symmetry
- 2 mA - 5, 3, 7,2
- 13.75 % - asymmetrical
- 2 mA - 5, 3, 7,2
- 13.712 % - asymmetrical
60 kV
- Amplitude of LC - Dominant harmonic
- THD - Positive & negative symmetry
- 3 mA - 5, 3, 7, 2
- 15.59% - asymmetrical
- 3 mA - 5, 3, 7, 2
- 15.7 % - asymmetrical
D. Leakage current for kaolin-salt polluted insulator under salt fog with conductivity of 3.6 mS
(file 20kv-r2.pl4; x-var t) c:XX0016-XX0233
0.01 0.03 0.05 0.07 0.09 [s] 0.11 -0.5
-0.3 -0.1 0.1 0.3 0.5 [mA]
(a)
(f ile 40kv-r1.pl4; x-var t) c:XX0018-XX0233
0.01 0.03 0.05 0.07 0.09 [s] 0.11 -1.0
-0.6 -0.2 0.2 0.6 1.0 [mA]
(b)
[image:4.595.324.527.340.730.2](c)
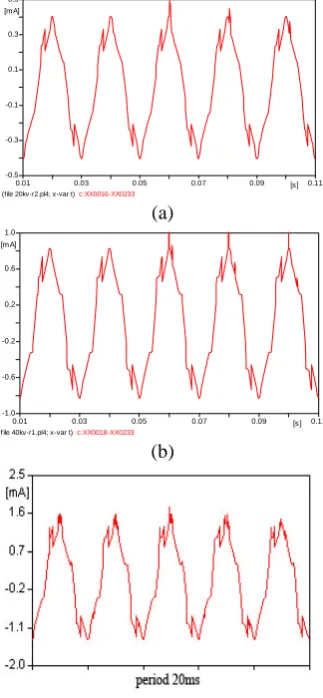
Fig. 8 Simulated LC waveforms for kaolin polluted sample under salt fog at 3.6 mS and applied voltage of
(a) 20 kV,(b) 40 kV and (c) 60 kV
Fig. 8 shows typical simulated leakage current waveforms for kaolin- polluted sample under salt fog with conductivity of 3.6 mS at applied voltages of 20, 40 and 60 kV. Figure 8(a) shows that under applied voltage of 20 kV the simulated LC waveforms is symmetrical with amplitude of 0.4 mA. Under applied voltage of 40 and 60 kV the simulated LC becomes unsymmetrical with amplitude of 0.83 and 1.5 mA. The simulated LC waveforms shown in figure 8 are similar with LC waveforms obtained from experiment as shown in figure 9.
The comparison of the simulated and experimental LC waveforms in term of amplitude, dominant harmonics, total harmonic distortion (THD) and symmetrical behavior are shown in table 3. As indicated by table 3, in general LC magnitude and THD increased with applied voltage. At applied voltage of 20 kV the LC waveform was distorted from sinusoidal, the dominant harmonic component was 3rd, 5th and 7th. However, when applied voltage was increased to 40 kV, the LC magnitude and THD increased, the LC waveform became unsymmetrical and more distorted. The dominant harmonic components were the 2nd, 3rd , 5th and 7th. Similar behavior was observed under 60 kV. LC magnitude and THD increased with applied voltage.
(a)
(b)
(c)
Fig. 9 Experimental LC waveforms for kaolin polluted sample under salt fog at 3.6 mS and applied voltage of
[image:4.595.87.249.394.744.2]Table 3
Comparison between measured and simulated LC waveforms for kaolin- polluted sample under salt fog
Measured LC Simulated LC
20 kV
- Amplitude of
LC - Dominant harmonic - THD - Positive & negative symmetry
- 0.4 mA - 5, 7, 3
- 15.8%
- symmetrical
- 0.4 mA - 5, 7, 3
- 15.71%
- symmetrical
40 kV
- Amplitude of
LC
- Dominant harmonic
- THD - Positive & negative symmetry
- 0.83 mA - 5,2, 3, 7
- 18.2%
- symmetrical
- 0.83 mA - 5, 3, 7
- 18.6%
- symmetrical
60 kV
- Amplitude of
LC
- Dominant harmonic
- THD - Positive & negative symmetry
- 1.5 mA - 5, 2, 3, 7
- 19.5 %
- asymmetrical
- 1.5 mA - 5, 3, 7
- 19.7 %
- asymmetrical
IV. CONCLUSIONS
Leakage current on 20 kV post-pin ceramic insulators were investigated. The experimental results indicated that in general the LC waveforms were distorted from sinusoidal. In order to understand better the behavior of the insulator, an electrical circuit model is proposed. The electrical circuit consists of capacitor(s), nonlinear resistor(s), and arc model(s). By utilizing the proposed electrical circuit, computer simulation of the leakage current was done using ATP/EMTP. The simulated leakage current waveforms were compared to those obtained from experiment. The similarity of the simulated and experimental leakage currents was indicated by their magnitude, dominant harmonic components, total harmonic distortion (THD) and asymmetry of the LC. The simulation results showed good similarity between leakage current waveforms obtained from experiment and simulation indicated the validity of the proposed model.
REFERENCES
[1] Siderakis, K, D Agoris, P Eleftheria, and E Thalassinakis. "Investigation of Leakage Current on High Voltage Insulators-Field Measurments." WSEAS Transaction on Circuits and System , 2004: 1188-1191.
[2] Suda, T., “Frequency Characteristics of Leakage Current Waveforms of a String of Suspension Insulators”. IEEE Transactions on Power
Delivery, Vol. 20, No. 1, 2005, pp 481-487
[3] Suwarno, J. Parhusip, “Effects of Humidity and Fog Conductivity on the Leakage Current Waveforms of Ceramics for Outdoor Insulators”, WSEAS Trans. On Systems, Vol. 9, Issue 4, 2010, pp. 442-452 [4] AH El Hag , S.H. Jayaram, E.A. Cherney, Fundamental and low Freq.
components of LC as a diagnostic Tool to Study Aging of RTV and HTV SIR in Salt-Fog , IEEE Trans. on Dielectrics and Electrical
Insulation, Vol. 10, No. 1, 2003, pp. 128- 136, Feb. 2003.
[5] Suwarno, “Leakage Current on outdoor Insulators under tropical
Conditions”, Int Symp. Electrical Insul. Mats. 2003, Himeji, Japan,
November 2003 pp.111-114
[6] Suwarno, Fari Pratomosiwi, “Electrical Equivalent Circuit of Ceramic Insulators with RTV Silicone Rubber Coating and Computer
Simulation of Leakage Currents”,WSEAS Trans. on Circuits and