Factorization of Latent Variables in Distributional Semantic Models
Arvid ¨Osterlund and David ¨Odling KTH Royal Institute of Technology, Sweden
arvidos|dodling@kth.se
Magnus Sahlgren Gavagai, Sweden mange@gavagai.se
Abstract
This paper discusses the use of factoriza-tion techniques in distribufactoriza-tional semantic models. We focus on a method for re-distributing the weight of latent variables, which has previously been shown to im-prove the performance of distributional se-mantic models. However, this result has not been replicated and remains poorly un-derstood. We refine the method, and pro-vide additional theoretical justification, as well as empirical results that demonstrate the viability of the proposed approach.
1 Introduction
Distributional Semantic Models (DSMs) have be-come standard paraphernalia in the natural lan-guage processing toolbox, and even though there is a wide variety of models available, the basic parameters of DSMs (context type and size, fre-quency weighting, and dimension reduction) are now well understood. This is demonstrated by the recent convergence of state-of-the-art results (Ba-roni et al., 2014; Levy and Goldberg, 2014).
However, there are a few notable exceptions. One is the performance improvements demon-strated in two different papers using a method for redistributing the weight of principal components (PCs) in factorized DSMs (Caron, 2001; Bulli-naria and Levy, 2012). In the latter of these pa-pers, the factorization of latent variables in DSMs is used to reach a perfect score of 100% correct answers on the TOEFL synonym test. This re-sult is somewhat surprising, since the factorization method isthe inverse of what is normally used.
Neither the result nor the method has been repli-cated, and therefore remains poorly understood. The goal of this paper is to replicate and explain the result. In the following sections, we first pro-vide a brief review of DSMs and factorization, and
review the method for redistributing the weight of latent variables. We then replicate the 100% score on the TOEFL test and provide additional state-of-the-art scores for the BLESS test. We also provide a more principled reformulation of the factoriza-tion method that is better suited for practical ap-plications.
2 Distributional Semantics
Consider a set of wordsW ={w1, . . . , wn}and a
set of context wordsC ={c1, . . . , cm}. The DSM
representation is created by registering an occur-rence of a word wi with a set of context words cj, . . . , ck with a corresponding increment of the
projection ofwi on thecj, . . . , ck bases. In other
words, each cellfijin the matrix representationF
represents a co-occurrence count between a word
wi and a context cj. In the following, we use W = C, making the co-occurrence matrix sym-metricFn×n. We also adhere to standard practice
of weighting the co-occurrence counts with Posi-tive Pointwise Mutual Information (PPMI) (Niwa and Nitta, 1994), which is a variation of the stan-dard PMI weighting,1which simply discards
non-positive PMI values.
3 Singular Value Decomposition
The high dimensionality of the co-occurrence ma-trix makes it necessary in most practical applica-tions to apply some form of dimensionality re-duction to F, with the goal of finding a ba-sis {xˆj, ...,xˆk} that restates the original basis
{xk, ...} in a lower-dimensional space Fˆ, where ˆ
F denotes the rank-kapproximation ofF:
min ˆ
F∈Rn×Rk|F −
ˆ
F| (1)
1PMI(f
ij) = log fij( P
ijfij)2
P
ifijPjfijP
ijfij.
Assuming Gaussian-like distributions,2 a
canoni-cal way of achieving this is to maximize the vari-ance of the data in the new basis. This enables or-dering of the new basis according to how much of the variance in the original data each component describes.
A standard co-occurrence matrix is positive and symmetric and thus has, by the spectral theorem, a spectral decomposition of an ordered set of posi-tive eigenvalues and an orthogonal set of eigenval-ues:
F =UΣVT (2) whereU holds the eigenvectors ofF,Σholds the eigenvalues, and V ∈ U(w) is a unitary matrix mapping the original basis ofF into its eigenba-sis. Hence, by simply choosing the firstk eigen-values and their respective eigenvectors we have the central result:
min
k |F −Fˆ| →Fˆ ≈UkΣkV T
k (3)
where Fˆ is the best rank-k approximation in the Frobenius-norm. This is commonly referred to as
truncatedSingular Value Decomposition (SVD). Finally, using cosine similarity,3V is redundant
due to invariance under unitary transformations, which means we can represent the principal com-ponents ofFˆ in its most compact form Fˆ ≡ UΣ
without any further comment.
This projection onto the eigenbasis does not only provide an efficient compression of the sparse co-occurrence data, but has also been shown to improve the performance and noise tolerance of DSMs (Sch¨utze, 1992; Landauer and Dumais, 1997; Bullinaria and Levy, 2012).
4 The Caronp-transform
Caron (2001) introduce a method for renormaliza-tion of the latent variables through an exponent factorp∈R:
UΣ→UΣp (4)
which is shown to improve the results of factorized models using both information retrieval and ques-tion answering test collecques-tions. We refer to this renormalization as theCaronp-transform. Bulli-naria and Levy (2012) further corroborate Caron’s 2It is well known that the Gaussian assumption does not hold in reality, and consequently there are also other ap-proaches to dimensionality reduction based on multinomial distributions, which we will not consider in this paper.
3cos(w
i, wj) =|wwii||·wwjj|
result, and show that the optimum exponent pa-rameterpfor DSMs is with strong statistical sig-nificance p < 1. Moreover, due to the redistri-bution of weight to the lower variance PCs, Bul-linaria and Levy (2012) show that similar perfor-mance improvements can be achieved by simply
removing the first PCs. We refer to this as PC-removal. A highlight of their results is a perfect score of 100% on the TOEFL synonym test.
Apart form the perfect score on the TOEFL test, it is noteworthy that the PC-removal scheme is the inverse of how SVD is normally used in DSMs; in-stead of retaining only the first PCs – which is the standard way of using the SVD in DSMs – the PC-removal schemedeletesthem, and instead retains all the rest.
5 Experiments
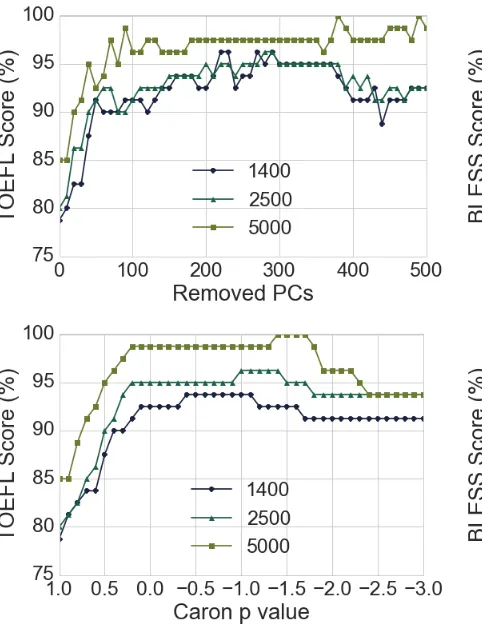
We replicate the experiment setup of Bullinaria and Levy (2012) by removing punctuation and decapitalizing the ukWaC corpus (Baroni et al., 2009). The DSM includes the 50,000 most fre-quent words along with the remaining 23 TOEFL words and is populated using a±2-sized context window. Co-occurrence counts are weighted with PPMI, and SVD is applied to the resulting ma-trix, reducing the dimensionality to 5,000. The results of removing the first PCs versus apply-ing the Caronp-transform are shown in Figure 1, which replicates the results from Bullinaria and Levy (2012).
Figure 1: TOEFL score for the PC-removal scheme and the Caronp-transform for the span of PCs.
Figure 2 shows the BLESS results for both the PC removal scheme and the Caronp-transform for different sizes of the corpus. The best score is 92.96% for the PC removal, and 92.46% for the Caron p-transform, both using the full data set. Similarly to the TOEFL results, we see better re-sults for a larger number of removed PCs. Inter-estingly, there is clearly a larger improvement in performance of the Caronp-transform than for the PC removal scheme.
Figure 3 shows how the redistribution affects the different relations in the BLESS test. The vi-olin plots are based on the maximum values of each relation, and the width of the violin repre-sents the normalized probability density of cosine measures. The cosine distributions,Θi, are based on the best matches for each categoryi, and nor-malized by the total mean and variance amongst all categories ˆΘi = Θiσ−µ. Thus, the figure
illus-trates how well each category is separated from each other, the larger separation the better.
The results in Figure 3 indicate that the top 120 PCs contain a higher level of co-hyponymy
rela-Figure 2: BLESS score for the PC-removal scheme and the Caronp-transform for the span of PCs.
Figure 3: BLESS targets versus categories from 1,400 PCs representation of the entire corpus.
[image:3.595.290.529.65.378.2] [image:3.595.308.530.445.622.2]and especially amongst the coord-category. This is an interesting result, since it seems to contra-dict the hypothesis that removing the first PCs im-proves the semantic quality of the representations – there is obviously valuable semantic information in the first PCs.
Table 1 summarizes our top results on the TOEFL, BLESS, and also the SimLex-999 simi-larity test (Hill et al., 2014), and compares them to a baseline score from the Skipgram model (Mikolov et al., 2013a), trained on the same data using a window size of 2, negative samples, and 400-dimensional vectors.
TOEFL BLESS SimLex-999
PC removal 100 92.96 46.52
Caronp 100 92.46 46.66
Skipgram 83.75 83.00 39.91
Table 1: Top results for the PC removal and Caron
pon each test compared to the Skipgram model.
Unfortunately, the optimal redistribution of weight on the PCs for the respective top scores differ between the experiments. For the PC re-moval the optimal number of removed PCs is 379 for TOEFL, 15 for BLESS and 128 for SimLex-999, while the optimal number for the Caron p -transform is -1.4 for TOEFL, 0.5 for BLESS and -0.40 for SimLex-999. Hence, there is likely no easy way to find a general expression of the opti-mal redistribution of weight on the PCs for a given application.
6 The Pareto Principle
It is common practice to reduce the dimensional-ity of ann-dimensional space to as many PCs as it takes to cover 80% of the total eigenvalue mass. This convention is known as the Pareto principle
(or 80/20-rule), and generally gives a good trade-off between compression and precision. The re-sults presented in the previous section suggest a type of inversion of this principle in the case of DSMs.
Given a computational and practical limit of the number of PCsmwith weightsΣ ={σ1, ..., σm},
the optimal redistribution of weight on these com-ponents is such that the first l −m components
σ1, ..., σm−l is transformed such that they
consti-tute 20% of the new total mass. Wherel−mis the number of components representing the last 20 % of the original mass. In other words, the function
f : Σ → ˆΣperforming this redistribution is such
that: P
m−l i=1 σˆi Pm
i=1σˆi ≈20% (5)
In this formulation, we can consider the Caronp -transform and the PC-removal scheme as special cases, where the Caronp-transform is given by:
f(σi) =σpi ∀i, p∈R (6)
and the PC-removal scheme by:
f(σi) = (1−δ(F))σi ∀i, F ={1....l} (7)
where δ(F) denotes the generalized Kronecker delta function.
To test this claim, we form this quotient for the distributions of weights at the optimal parame-ters for the Caronp-transform and the PC-removal scheme for both the BLESS and TOEFL tests for each of the 40 sub-corpora.
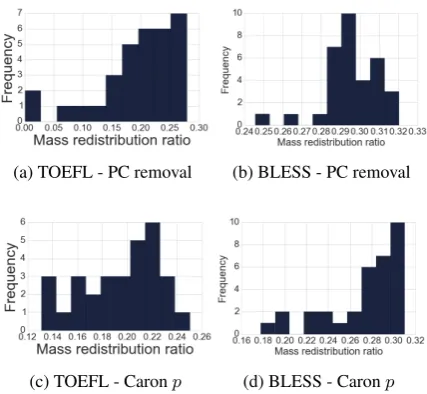
[image:4.595.309.523.405.602.2]Even though the results are not as optimal for the BLESS test as for the TOEFL, the results in Figure 4 point in favor of this measure. The opti-mal mass distributions for the Caronp-transform and the PC removal are all around 20 %.
(a) TOEFL - PC removal (b) BLESS - PC removal
(c) TOEFL - Caronp (d) BLESS - Caronp
Figure 4: The mass redistribution ratio for the best results on the 1,400 PC models.
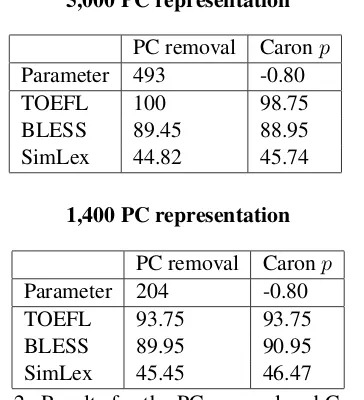
5,000 PC representation
PC removal Caronp
Parameter 493 -0.80
TOEFL 100 98.75
BLESS 89.45 88.95
SimLex 44.82 45.74
1,400 PC representation
PC removal Caronp
Parameter 204 -0.80
TOEFL 93.75 93.75
BLESS 89.95 90.95
[image:5.595.92.274.69.269.2]SimLex 45.45 46.47
Table 2: Results for the PC removal and Caronp
using the 80/20 rule
7 Conclusions and future work
This paper has discussed the method of redistribut-ing the weight of the first PCs in factorized DSMs. We have replicated previously published results, and provided additional empirical justification for the method. The method significantly outperforms the baseline Skipgram model on all tests used in the experiments. Our results also suggest a slight refinement of the method, for which we have pro-vided both theoretical and empirical justification. The resulting rule of thumb method leads to stable results that may be useful in practice.
Although the experiments in this paper has pro-vided further evidence for the usefulness of re-distributing the weight in factorized models, it also raises additional interesting research ques-tions. For example, does the method also im-prove models that have been trained on smaller data sets? Does it also hold for non-Gaussian factorization like Non-negative Matrix Factoriza-tion? How does the method affect the (local) struc-tural properties of the representations; do factor-ized models display the same type of structural regularities as has been observed in word embed-dings (Mikolov et al., 2013b), and would it be pos-sible to use methods such as relative neighborhood graphs (Gyllensten and Sahlgren, 2015) to explore the local effects of the transformation?
References
Marco Baroni and Alessandro Lenci. 2011. How we blessed distributional semantic evaluation. In Pro-ceedings of GEMS, pages 1–10.
Marco Baroni, Silvia Bernardini, Adriano Ferraresi, and Eros Zanchetta. 2009. The wacky wide web: a collection of very large linguistically pro-cessed web-crawled corpora. Language resources and evaluation, 43(3):209–226.
Marco Baroni, Georgiana Dinu, and Germ´an Kruszewski. 2014. Don’t count, predict! a systematic comparison of context-counting vs. context-predicting semantic vectors. InProceedings of ACL, pages 238–247.
John Bullinaria and Joseph Levy. 2012. Extracting semantic representations from word co-occurrence statistics: stop-lists, stemming, and SVD. Behavior Research Methods, 44(3):890–907.
John Caron. 2001. Experiments with LSA scoring: Optimal rank and basis. In Michael Berry, editor,
Computational Information Retrieval, pages 157– 169.
Amaru Cuba Gyllensten and Magnus Sahlgren. 2015. Navigating the semantic horizon using relative neighborhood graph. InProceedings of EMNLP. Felix Hill, Roi Reichart, and Anna Korhonen. 2014.
Simlex-999: Evaluating semantic models with (gen-uine) similarity estimation. CoRR, abs/1408.3456. Thomas Landauer and Susan Dumais. 1997. A
solu-tion to Plato’s problem: The latent semantic analysis theory of acquisition, induction, and representation of knowledge. Psychological review, 104(2):211. Omer Levy and Yoav Goldberg. 2014. Neural word
embedding as implicit matrix factorization. In Pro-ceedings of NIPS, pages 2177–2185.
Tomas Mikolov, Ilya Sutskever, Kai Chen, Greg S. Cor-rado, and Jeff Dean. 2013a. Distributed representa-tions of words and phrases and their compositional-ity. InProceedings of NIPS, pages 3111–3119. Tomas Mikolov, Wen tau Yih, and Geoffrey Zweig.
2013b. Linguistic regularities in continuous space word representations. InProceedings NAACL-HLT, pages 746–751.
Yoshiki Niwa and Yoshihiko Nitta. 1994. Co-occurrence vectors from corpora vs. distance vec-tors from dictionaries. InProceedings of COLING, pages 304–309.
Hinrich Sch¨utze. 1992. Dimensions of meaning. In