WOTTGE, M, MAK, D and RUSSELL, JM
Available from Sheffield Hallam University Research Archive (SHURA) at:
http://shura.shu.ac.uk/21911/
This document is the author deposited version. You are advised to consult the
publisher's version if you wish to cite from it.
Published version
BARKER, Margo, HALLIDAY, V, WOTTGE, M, MAK, D and RUSSELL, JM (2018).
Food security, nutrition and health of food bank attendees in an English city: A
cross-sectional study. Journal of hunger and environmental nutrition, 14 (1-2), 155-167.
Copyright and re-use policy
See
http://shura.shu.ac.uk/information.html
Sheffield Hallam University Research Archive
1
Food security, nutrition and health of food
1
bank attendees in an English city: A
cross-2
sectional study.
3
Margo E Barker
1, Vanessa Halliday
2, Daniel Mak
3Madeline Wottge
3and Jean M
4Russell
45
1Food and Nutrition Group, Business School, Sheffield Hallam University 6
2ScHARR The University of Sheffield 7
3 Human Nutrition Unit, Department of Oncology and Metabolism, The University of Sheffield 8
4 Central Information and Computing Services, The University of Sheffield 9
Correspondence to: Margo Barker, Business School, Sheffield Hallam University, Charles Street, 10
Sheffield S1 1WB 11
Margo.barker@shu.ac.uk 12
Key words: vulnerable adults, diet, nutrient analysis, food poverty, charitable food aid
13
Abstract
14
Food banks in contemporary Britain are feeding record numbers of people. Little is known about 15
attendees’ level of food insecurity, background diet quality or health. We surveyed 112 food bank 16
attendees. Over 50% had experienced food shortage with hunger on a weekly basis or more often. 17
Obesity and mental health problems were prevalent in women. Diet quality was poor, with energy, 18
protein, fibre, iron and calcium intakes inadequate, while saturated fat and sugars intake were 19
disproportionate. Women had poorer diet quality than men. Such patterns may lead to ill health. 20
2
Introduction
22
Growing numbers of people in contemporary Britain obtain emergency food aid through food 23
banks 1. Food banks are often run by charities and provide people with non-perishable food parcels 24
designed to provide sustenance for a 3-day period. Eligibility is usually pre-established by the 25
statutory care agencies (general practitioners, health visitors and social workers); these groups 26
refer people to a local food bank using a voucher system. Users of food banks encompass a wide 27
range of vulnerable people many of whom are of working age, including the newly unemployed and 28
people with benefit sanctions and delays, and destitute asylum seekers 2. 29
In 2013 some 500,000 people were reliant on this form of emergency food aid 2, while 2014 figures 30
from The Trussell Trust, which is the biggest food bank provider operating across the United 31
Kingdom (UK), estimated that figure was 900,000 1. This spiralling level of food poverty has 32
prompted an all-party parliamentary committee enquiry 3 . 33
The rise in British food banking is underpinned by ill-health, debt, low-pay, a failing benefit system 34
and high food and utility prices 4,5, but little primary study has measured household food insecurity 35
6. Food insecurity can embrace a gamut of circumstances from worrying about food, scrimping on 36
food purchases, compromising quality and variety of food, experiencing hunger, missing meals to 37
entire days without food. Studies of North American and Dutch food bank recipients have revealed 38
high levels of food insecurity 7,8. A recent analysis of European survey data 9 suggests that food 39
insecurity has risen after the financial crisis of 2008, and particularly so in the UK. 40
Paradoxically food insecurity has been associated with high body mass; North American studies of 41
3
10,11. Studies of people using food pantries and studies of homeless people have also noted a 43
substantial prevalence of overweight and obesity 12,13. These studies have not assessed dietary 44
energy intake, but there are indications of reliance on palatable, energy-dense foods. North 45
American studies have noted minimal fruit and vegetable consumption 14, as well as low wholegrain 46
and milk intakes, within an overall unhealthy dietary pattern 7. Such dietary patterns may increase 47
risk of chronic disease, and are congruent with the greater prevalence of diabetes and obesity in 48
people who are food insecure 10. 49
We are not aware of studies that have scrutinised the background diet of British food bank 50
recipients. The aim of this study was to systematically assess this group’s household food security 51
status and measure nutrient intake during food crisis. 52
Methods
53The design was a researcher-administered, cross-sectional survey. The survey had ethical approval 54
from the University School of Medicine. A purposive sample of food bank attendees was recruited 55
between May and August 2014 from three food banks in an English city. Inclusion criteria were 56
adults above the age of 18 years who had spoken English language conducive to participation. 57
Participant approach and recruitment varied slightly at each food bank. Generally, food bank staff 58
members greeted attendees and discussed their voucher and food parcel with them. One of the 59
research team then informally approached attendees and introduced the study. People who 60
showed interest were given a participant information sheet to read or the researcher explained the 61
information sheet. People willing to participate gave written consent. A £10 supermarket voucher 62
4
The multiple-pass 24-hour recall technique was used to estimate the dietary intake of participants. 64
Each participant was interviewed at the food bank on one occasion. The participant was asked to 65
recall their previous day’s food and drink consumption, using standardised multiple-pass 24-hour 66
recall interview methods; a photographic food portion atlas was used for estimations of portion 67
size 15. 68
Participants were then asked to respond to a set of 23 interviewer-administered short-answer 69
questions, which were of both open and closed format (see appendix 1). These questions covered 70
general demographic information, self-reported body weight and height, factors affecting food 71
access, desired changes in diet, and food insecurity. Food insecurity was measured as in the 72
National Low Income Diet and Nutrtion Survey 16. 73
Food consumption data from the 24-hour recall interviews were inputted to a nutrient software 74
package (NETWISP 4.0; Tinuviel Software, England). Daily intake of energy, macronutrients, iron, 75
calcium and sodium were calculated for each participant. These data along with questionnaire 76
information were entered into SPSS (version 22.0). Body Mass Index (BMI) was calculated from 77
weight and height. Descriptive statistics were used to describe the study sample. Difference 78
between median intakes of energy and nutrients were compared with the UK recommendations 17 79
using the One-Sample Wilcoxon Signed Rank test. The proportion of participants meeting 80
recommendations was also calculated. Chi-squared tests were employed to test for association. 81
Results
82In total, 112 people participated in the 24-hour recall and survey. This sample had a greater 83
5
to 72 years, with a mean age of 40.2 (sd=13.6) years. The ethnic composition of the sample was 85
predominantly White British (83.9%, n=94), with small numbers of other ethnicities: 4.5% (n=5)
86
African, 8.1% (n=9) Asian, 1.8% (n=2) European, and 1.8% (n=2) Caribbean. Asylum seekers 87
comprised 9.0% (n=10) of the sample. The majority of people were single (63.4%, n=71), with the 88
remainder married or co-habiting (23.2%, n=26), widowed (0.9%, n=1) and separated or divorce 89
(11.6%, n=13). Overall, 45.5% (n=51) participants lived in a single-person household. Most 90
participants (90%, n=101) reported that they were unemployed. Of those that reported working
91
(5.4%, n=6), one respondent said that they had a full-time job, three respondents were working 92
part-time and two respondents worked occasionally or seasonally. The remaining participants 93
were retired (2.7%, n=3) or did not give a response (1.8%, n=2). 94
The numbers of participants reporting various health conditions and BMI distributions are 95
provided in Table 1. There were gender differences in the proportions classified in categories of 96
relative body weight (P<0.001): 41.0% (n=16) of women were categorised as obese or morbidly 97
obese compared to only 9.4% (n=6) of men. Women were significantly (P=0.030) more likely to 98
report a mental health problem (37.0%, n=17) than men (18.2%, n=12). Women also reported a 99
greater prevalence of respiratory problems (19.6%, n=9) than men (6.1%, n=4). A total of 106 100
people responded to a question on body weight change over the previous year: 18.8% (n=21)
101
reported a weight increase, while 46.4% (n=52) reported weight loss. The majority of the sample 102
reported a chronic health condition (61.6%, n=69), with the most common report being related to 103
mental health (25.9%, n=29). Other chronic health conditions reported were diabetes (7.1%, n=8)
104
6
systems (8.0%, n=9). There was no evidence of a relationship between BMI and reported mental 106
health problems (M-W=943.5, P=0.536).
107
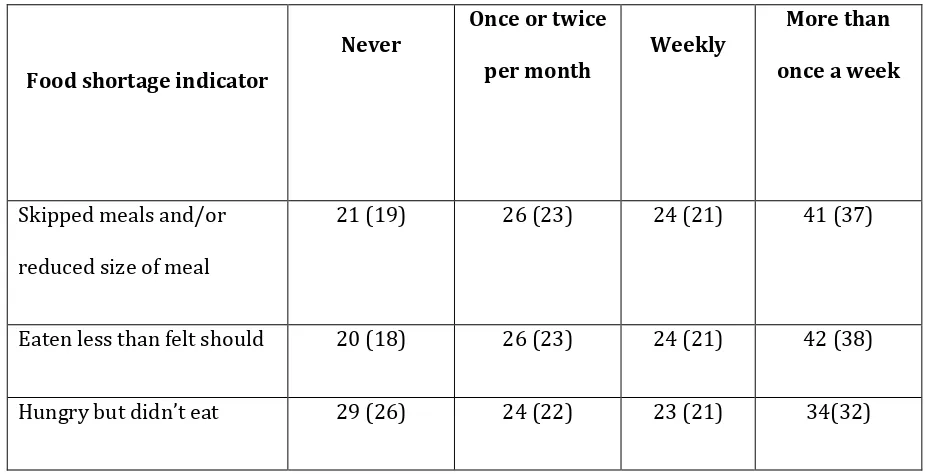
The figures for food security are shown in Table 2. Over half of participants reported a high level of 108
food insecurity due to lack of money on at least a weekly basis: skipping meals or reducing portion 109
sizes (58%, n=65), eating less than they felt they should (58.9%, n=66), and feeling hungry but not 110
eating (50.9%, n=57). The corresponding figures for never having experienced these levels of food 111
insecurity were 18.8% (n=21), 17.9% (n=20) and 25.9% (n=29). Less than a quarter of the sample 112
24.1% (n=27) reported that this was their first visit to a food bank. A total of 80 participants further 113
responded to the question on frequency of use of a food bank in the last month: 6.3% (n=5) of the 114
sample reported no previous use, 20.0% (n=16) reported using the food bank once, 20% (n=16) 115
reported using the food bank twice, while 53.8% (n=43) reported food bank usage of three times or 116
more often. 117
Around half of participants reported that attendance at a food bank was due to problems with 118
benefits (48.2%, n=54) or low income (41.1%, n=46). Information on barriers to consuming good 119
quality food or having a variety of food was also gathered. The most frequent response was 120
shortage of money (92.0%, n=103) followed by transport problems (24.1%, n=27). Participants 121
were also asked about changes they would like to make to their diet. A substantial minority of 122
people (24.1%, n=27) did not wish to make any dietary change. The two most common aspirations 123
were to eat more fruit and vegetables (28.6%, n=32) and to eat healthier in general (26.8%, n=30). 124
A minority of people (13.4%, n=15) reported a desire to eat more overall, while only 5.4% (n=6)
125
7
Nutrient intakes of participants are given in Table 3. Both men (71.2%, n=47) and women (81.9%,
127
n=41) had a significantly lower energy intake (P<0.001) than the theoretical requirement. 128
Saturated fat and free sugars made significantly greater contributions to total energy intake 129
(P<0.001) than recommended with a sizeable majority having intakes greater than 130
recommendations (71.2%, n=79 for saturated fat and 86.6%, n=85 for free sugars). Dietary fibre 131
intake was significantly lower than recommended (83.0%, n=93, P<0.001), as were calcium (61.6%,
132
n=69, P=0.049) and iron intakes in both men (39.4%, n=26, P=0.007) and women (93.5%, n=43,
133
P<0.001). Only 3.4% (n=4) participants recorded alcohol consumption. It should be noted that one 134
participant reported no food consumption (water only). Recorded sodium intakes were excessive 135
in just over half of men (56.1%, n=37). 136
Discussion
137This study set out to address the gap in the evidence as to food bank users’ experience of food 138
insecurity and background dietary quality. It has unveiled that food bank users have a nutritionally 139
inadequate diet while in food crisis (the day prior to accessing emergency food aid), and missing 140
meals and experiencing hunger happens weekly or more for most. The severe level of food 141
insecurity is confirmed by the pattern of food bank use – over 50% of participants had visited a 142
food bank 3 or more times in the past month. Acute food shortage was most marked for dietary 143
adequacy of fibre, calcium and iron. Importantly, intake of protein was also low, with over 40% of 144
people falling below the threshold for adequacy. These nutrient shortfalls are unsurprising in the 145
face of a marked dietary energy deficit – energy intake was 800 Kcal below theoretical energy 146
requirements. At this level of energy restriction achieving adequate micronutrient intake is 147
8
and sugars as energy sources, albeit under the umbrella of energy restriction. Nevertheless food 149
bank users had aspirations to eat healthier food, primarily through greater consumption of fruit 150
and vegetables. 151
While the acute effect of food shortage may be a diminished intake of energy and nutrients, 152
predisposing towards malnutrition, dietary overconsumption was in evidence in our dataset with 153
substantial numbers of women classified as overweight and obese. Clearly the negative energy 154
balance we documented during a period of food shortage had been offset by overconsumption at 155
other times. However, compensatory overeating was not universal, as 7% of participants were 156
classified as underweight and recent weight loss was reported by nearly 50%. Other health 157
problems were also prevalent, with over a third of women reporting poor mental health. 158
Finally, less than a quarter of food bank users in this study reported they were accessing the food 159
bank for the first time. There seems to be a large cohort of users who habitually endure food 160
shortage, for whom access to emergency food aid is both routine and critical. Such dependence 161
arose from straitened financial circumstances, particularly because of issues with social security 162
benefits. 163
Like most dietary studies, nutrient intake estimates were reliant on self-reporting of food 164
consumption, which is open to underreporting. This bias may be exacerbated in this population, as 165
low food consumption may be perceived to vindicate receipt of charitable food, albeit participants 166
were advised that participation had no bearing on entitlement. Other social response biases may be 167
acting, not least an influence of high relative body weight. Furthermore, a single day of recall does 168
9
trough of dire food shortage. That said, the high frequency rate of severe food insecurity 170
(encompassing both food shortage and hunger) indicates that such troughs are customary. 171
Interpretation of the prevalence figures for BMI must consider that these were based on self-report 172
of weight and height. In food insecure populations such measures are known to be biased towards 173
under-reporting of weight for height 18. It is likely that prevalence of overweight and obesity 174
exceeds 40%. The sample was a small, convenience sample comprising largely of single, White, 175
British city-dwellers and having a high proportion of men. These results must be interpreted in the 176
context of a preliminary study and extrapolation to the wider national context has to be tentative. 177
Even with this caveat, the study provides valuable primary data on the level of food insecurity 178
experienced by people turning to food banks, and its acute and negative impact on dietary quality. 179
Comparative British literature on the extent of under-nutrition among vulnerable people is scarce, 180
but nutrient intakes parallel those of a 2012 study of homeless people, which described low intakes 181
of energy, protein and iron, and a reliance on fat and sugar as energy sources 15. A qualitative study 182
of Scottish food bank users noted that meat consumption was compromised during food crisis 5. 183
The current study used three questionnaire items to assess food insecurity experience. These were 184
derived from a 10-item food security screening scale used in a 2003-2005 British government 185
survey of low-income families 16. Abbreviation of the original scale was necessary in order to 186
minimise survey time. The original questionnaire items were also rephrased in order to assess 187
recent food insecurity experience (over the previous month as opposed to over the previous year). 188
The items used to measure food insecurity in the current study closely match items in the UN Food 189
and Agriculture Organisation’s 8-item Food Insecurity Experience Scale 19, which has recently been 190
10
Nearly 60% of participants surveyed were experiencing severe food insecurity (being hungry and 192
not being able to eat) on a weekly basis or more often. These figures are set against a 33% rise in 193
hospital admissions for malnutrition in England between 2010/11 and 2014/2015, while local 194
hospitals record a doubling of cases in a similar time period; there were 92 cases in 2014, which is 195
the year this study was conducted 20. The convergence of food insecurity with obesity in women, as 196
opposed to men, has been shown in North American surveys 21,22 and resonate with a secondary 197
analysis of Health Survey of England data 23 that revealed a relationship between low household 198
income and obesity in women, but not men. The obesity issue has not surfaced in the UK food bank 199
literature, but our data indicate a substantially greater prevalence of obesity in women than the 200
English national average of 24% (2013 figures) 24. Furthermore, it is likely our obesity prevalence 201
rate estimates are conservative. 202
The high prevalence of mental health problems concurs with case studies of UK food bank users 4,25 203
and North American surveys of food pantry users 12. Depression and poor mental health have been 204
linked to risk of obesity 26 in cross-sectional study designs, although the relationship may be bi-205
directional. This relationship was not corroborated in this study, but sample size was limited. 206
Cycles of ‘plenty and want’ are a feature of poverty-driven food insecurity. Such cycles are known 207
to lead to dependence on energy-dense foods of low nutritional quality that are affordable, 208
appetising and ubiquitous 27. Although some food bank users recognised that their diets lacked 209
fruit and vegetables, the rise in British food prices since 2008 have been marked for these 210
foodstuffs, while in contrast foods and drinks high in fat and sugar have been price resilient 28. The 211
economic vulnerability of food insecure populations means that provision of culinary complex 212
11
impossible. Food policy measures using economic instruments to regulate food prices and 214
encourage a shift in eating pattern may be necessary 29. 215
Fluctuation in the household food supply seems to result in a psychological drive to overeat in 216
women; emotional and binge eating after periods of food deprivation has been documented 30 and 217
women with children and those experiencing depression seem to more susceptible to such 218
behavioural patterns 22. A desire for food calories in the face of financial insecurity seems to 219
overwhelm other aspects of food choice. Healthy eating campaigns are likely to be seen as 220
peripheral by people who are focused on getting enough food energy to survive. 221
With the growing reliance on food banks, and if these results are substantiated, health professionals 222
can expect to see an increase in the number of patients presenting with ill health related to 223
malnutrition. These may include iron deficiency anaemia, uncontrolled diabetes, and hypertension, 224
as well as excess weight. There is also potential to improve dietary adequacy through 225
improvements in the food distributed at food banks. Clearly, provision of foods rich in protein, iron, 226
calcium and fibre is necessary, and procurement policies could be more prescriptive. Some North 227
American and Canadian food banks have introduced policies to address poor dietary patterns of 228
their clients 27,31. There is some evidence that recipients of charitable food are open to dietary 229
change and value such initiatives 32,33. 230
Further research to confirm these findings is needed. Ideally it would incorporate a less subjective 231
method of dietary assessment, such as a photographic record, have physical and biochemical 232
12
People using food banks experience substantial and recurring food insecurity. This insecurity 234
impacts negatively on diet quality with compromised intakes of energy, protein, fibre, calcium and 235
iron and a reliance on fat and sugars. Such patterns may lead to ill health. Women using food banks 236
have a high prevalence of obesity and mental health problems. 237
References
2381. Loopstra R, Reeves A, Taylor-Robinson D, Barr B, McKee M, Stuckler D. Austerity, sanctions, 239
and the rise of food banks in the UK. BMJ Br Med J. 2015;350(apr08 9):h1775-h1775. 240
doi:10.1136/bmj.h1775. 241
2. Cooper N, Dumpleton S. Walking the Breadline the Scandal of Food Poverty in 21st Century
242
Britain.; 2013. www.oxfam.org.uk/ policyandpractice. 243
3. All-Party Parliamentary Inquiry. Feeding Britain. A Strategy for Zero Hunger in England,
244
Wales, Scotland and Northern Ireland. The Report of the All-Party Parliamentary Inquiry into
245
Hunger in the United Kingdom.; 2014. doi:10.1136/bmj.1.4348.621-a. 246
4. Garthwaite KA, Collins PJ, Bambra C. Food for thought: an ethnographic study of negotiating 247
ill health and food insecurity in a UK foodbank. Soc Sci Med. 2015;132:38-44. 248
doi:10.1016/j.socscimed.2015.03.019. 249
5. Douglas F, Sapko J, Kiezebrink K, Kyle J. Resourcefulness, desperation, shame, gratitude and 250
powerlessness : Common themes emerging from a study of food bank use in Northeast 251
Scotland. Public Health. 2015;2(October):297-317. doi:10.3934/publichealth.2015.3.296. 252
6. Dowler E, Lambie-Mumford H. Introduction: Hunger, food and social policy in austerity. Soc
13
Policy Soc. 2015;14(03):411-415. doi:10.1017/S1474746415000159. 254
7. Duffy P, Zizza C, Jacoby J, Tayie FA. Diet quality is low among female food pantry clients in 255
eastern Alabama. J Nutr Educ Behav. 2009;41(6):414-419. doi:10.1016/j.jneb.2008.09.002. 256
8. Neter JE, Dijkstra SC, Visser M, Brouwer IA. Food insecurity among Dutch food bank 257
recipients: a cross-sectional study. BMJ Open. 2014;4(5):e004657-e004657. 258
doi:10.1136/bmjopen-2013-004657. 259
9. Davis O, Baumberg Geiger B. Did food insecurity rise across Europe after the 2008 crisis? An 260
analysis across welfare regimes. Soc Policy Soc. 2016:1-18. 261
doi:10.1017/S1474746416000166. 262
10. Laraia BA. Food insecurity and chronic disease. Adv Nutr. 2012;4:203-212. 263
doi:10.3945/an.112.003277. 264
11. Larson NI, Story MT. Food insecurity and weight status among U.S. children and families: A 265
review of the literature. Am J Prev Med. 2011;40(2):166-173. 266
doi:10.1016/j.amepre.2010.10.028. 267
12. Vivian EM, Le J, Ikem P, Tolson Y. Health needs and neighbourhood concerns of low income 268
households vulnerable to food insecurity. Public Health. 2014;128:743-745. 269
doi:10.1016/j.puhe.2014.05.005. 270
13. Koh KA, Hoy JS, O’Connell JJ, Montgomery P. The hunger-obesity paradox: obesity in the 271
14
14. Robaina KA, Martin KS. Food insecurity, poor diet quality, and obesity among food pantry 273
participants in Hartford, CT. J Nutr Educ Behav. 2013;45(2):159-164. 274
doi:10.1016/j.jneb.2012.07.001. 275
15. Sprake E, Russell JM, Barker ME. Food choice and nutrient intake amongst homeless people. J
276
Hum Nutr Diet. 2013;27(3):242-250. doi:10.1111/jhn.12130. 277
16. Nelson M, Erens B, Bates B, Church S, Boshier T. Low Income Diet and Nutrition Survey. Vol 278
Vol. 3. London: HMSO; 2007. doi:10.1016/j.ijthermalsci.2004.09.006. 279
17. British Nutrition Foundation. Nutrient Requirements. London; 2016. 280
https://www.nutrition.org.uk/attachments/article/907/Nutrition Requirements_Revised 281
June 2016.pdf. 282
18. Lyons AA, Park J, Nelson CH. Food insecurity and obesity: A comparison of self-reported and 283
measured height and weight. Am J Public Health. 2008;98(4):751-757. 284
doi:10.2105/AJPH.2006.093211. 285
19. Food and Agriculture Organization of the United Nations F. Methods for Estimating
286
Comparable Prevalence Rates of Food Insecurity Experience by Adults throughout the World -
287
Technical Report (Revised). Rome, FAO; 2016. 288
20. BBC News. Malnutrition causing thousands of hospital admissions. 289
http://www.bbc.co.uk/news/uk-england-34777348. Published 2015. Accessed May 6, 2016. 290
21. Gooding HC, Walls CE, Richmond TK. Food insecurity and increased BMI in young adult 291
15
22. Martin MA, Lippert AM. Feeding her children, but risking her health: The intersection of 293
gender, household food insecurity and obesity. Soc Sci Med. 2012;74(11):1754-1764. 294
doi:10.1016/j.socscimed.2011.11.013. 295
23. Aitsi-Selmi A, Bobak M, Marmot MG. Global challenges in addressing the social determinants 296
of smoking and obesity: comparison of England with six emerging economies. Lancet. 297
2013;382:S23. doi:10.1016/S0140-6736(13)62448-4. 298
24. Health and Social Care Information Centre. Statistics on Obesity, Physical Activity and Diet: 299
England 2015. Heal Soc Care Inf Cent. 2015;(March):103.
300
http://www.hscic.gov.uk/catalogue/PUB16988/obes-phys-acti-diet-eng-2015.pdf. 301
25. Perry J, Williams M, Sefton T, Haddad M. Emergency Use Only: Understanding and reducing 302
the use of food banks in the UK. Child Poverty Action Group, Church England, Oxfam andThe
303
Trussell Trust. 2014:1-8. http://www.cpag.org.uk/sites/default/files/Foodbank 304
Report_web.pdf. 305
26. Davillas A, Benzeval M, Kumari M. Association of Adiposity and Mental Health Functioning 306
across the Lifespan: Findings from Understanding Society (The UK Household Longitudinal 307
Study). PLoS One. 2016;11(2):e0148561. doi:10.1371/journal.pone.0148561. 308
27. Crawford PB, Webb KL. Unraveling the paradox of concurrent food insecurity and obesity. 309
Am J Prev Med. 2011;40(2):274-275. doi:10.1016/j.amepre.2010.11.003. 310
28. Jones NR V., Conklin AI, Suhrcke M, Monsivais P. The Growing Price Gap between More and 311
16
2014;9(10):e109343. doi:10.1371/journal.pone.0109343. 313
29. Hawkes C, Smith TG, Jewell J, et al. Smart food policies for obesity prevention. Lancet. 314
2015;385(9985):2410-2421. doi:10.1016/S0140-6736(14)61745-1. 315
30. Ivers LC, Cullen KA. Food insecurity : special considerations for women. Am J Clin Nutr. 316
2011;94:1740-1744. doi:10.3945/ajcn.111.012617.1. 317
31. Campbell EC, Ross M, Webb KL. Improving the nutritional quality of emergency food: A study 318
of food bank organizational culture, capacity and practices. J Hunger Environ Nutr. 319
2013;8(3):261-280. doi:10.1080/19320248.2013.816991. 320
32. Pelham-Burn SE, Frost CJ, Russell JM, Barker ME. Improving the nutritional quality of 321
charitable meals for homeless and vulnerable adults. A case study of food provision by a food 322
aid organisation in the UK. Appetite. 2014;82:131-137. doi:10.1016/j.appet.2014.07.011. 323
33. Seidel M, Laquatra I, Woods M, Sharrard J. Applying a nutrient-rich foods index algorithm to 324
address nutrient content of food bank food. J Acad Nutr Diet. 2015;115(5):695-700. 325
doi:10.1016/j.jand.2014.11.009. 326
327
17
Table 1: Relative body weight and chronic illness profile of sample (n; percentage in parentheses; base
329
= 103)
330
Characteristic Men Women Total Tests
BMI category*
(kg/m2)
Underweight (<18.5) 3 (4.7%) 4 (10.3%) 7 (6.8)
χ2(4)=22.0 p<0.001 Healthy weight
(18.5-24.9)
37 (57.8%) 17 (43.6%) 54 (52.4)
Overweight (25-29.9) 18 (28.1%) 2 (5.1%) 20 (19.4)
Obese (30-39.9) 6 (9.4%) 11 (28.2%) 17 (16.5)
Morbidly obese (>40) 0 (0.0%) 5 (12.8%) 5 (4.9)
Chronic illness
or disability**
None 29
(43.9%)
14
(30.4)
41 (38.4) Χ2(1)=2.1,
p=0.171
Mental health 12 (18.2%) 17 (37.0%) 29 (25.9) Χ2(1)=5.0,
p=0.030
Diabetes 5 (7.6%) 3 (6.5%) 8 (7.1) Χ2(1)=0.05,
18
Cardiovascular 6 (9.1%) 3 (6.5%) 9 (8) Χ2(1)=0.2,
p=0.735
Musculoskeletal 10 (15.2%) 6 (13.0%) 18 (14.3) Χ2(1)=0.1,
p=0.792
Respiratory 4 (6.1%) 9 (19.6%) 13 (11.6) Χ2(1)=4.8,
p=0.037
Other 5 (7.6%) 5 (10.9%) 10 (8.9) Χ2(1)=0.4,
p=0.738
19
Table 2: Frequency of food shortage experiences (n; percentage in parentheses; base = 112)
332
333
Food shortage indicator
Never
Once or twice
per month Weekly
More than
once a week
Skipped meals and/or
reduced size of meal
21 (19) 26 (23) 24 (21) 41 (37)
Eaten less than felt should 20 (18) 26 (23) 24 (21) 42 (38)
Hungry but didn’t eat 29 (26) 24 (22) 23 (21) 34(32)
334
20
Table 3: Median nutrient intakes (Inter-Quartile Range) compared to UK Dietary Reference Values
336
(base = 112)
337
338
339
Nutrient DRV Median intake (IQR) Median difference from DRV
p-value ‡ % outside DRV
Energy (kcal/d) Men 26031 1775 (1235-2723) -996 <0.001 71.2
Women 20781 1201 (719-1801) -972 <0.001 89.1
Protein (g/day) Men 552 69 (38 - 113) 13 0.003 40.9
Women 452 36 (18-65) -9 0.650 54.3
Carbohydrate (% total energy) 503 53 (43-60) 3 0.135 44.1
Total fat (% total energy) <333 35 (28-41) 2 0.092 56.8
Saturated fat (% total energy) <103 13 (9-18) 3 <0.001 71.2
Free Sugars (% energy) <5%4 12 (15-17) 7 <0.001 86.6
Alcohol (% energy) <53 0 (0-0) -5 <0.001 0
Fibre (g/day) 305 13 (7-24) -17 <0.001 83.0
Sodium (mg/day) <24003 2151 (1307-3747) -249 0.567 43.8
Calcium (mg/day) 7002 553 (314-875) -148 0.049 61.6
Iron (mg/day) Men 8.72 10.7 (6.3-15.4) 2.0 0.007 39.4
Women 14.82 5.8 (2.8-8.5) -9.0 <0.001 93.5
1 Estimated Average Requirement 17 ; 2 Reference Nutrient Intake 17; 3 Population Average 17; 4 Reference
340
Value 17; 5Association of Official Agricultural Chemists analysis; reference value 17‡ One-sample Ranked
341
Wilcoxon Test
21 343
Appendix
344
345
Questionnaire for Participants
346
The food experiences and nutrient intake of people that use food banks in Sheffield
347
348
349
350
1. How many people do you live with? ______________________
351 352
2. How many are Adults ______________ Children______________
353
How old is(are) the child(ren)?________________________________ 354
355
3. What is your relationship status?
356
Single □ Married □ Separated □
357
Male □ Female □ Date of Birth:___/___/___
22
Divorced □ Widowed □ Cohabiting □
358
In a relationship but living separately □
359
360
4. Are you:
361
Working full-time □ Occasional/seasonal work □
362
Working part-time □ Not Working □
363
Self-employed □ Working a 0-hour contract □
364
Retired □
365
366
5. Do you have any long-standing illness, disability or infirmity? (By long-standing I mean an
367
illness that you have had over a period of time or that is likely to affect you over a period of 368
time.) 369
370
Yes □ No □
371
372
If Yes, can you describe this _______________________________________
373
374
6. What is your approximate
375 376
Weight _______________ Height________________
377
23
7. Over the last year has your weight
379 380
Stayed the same □ Increased □ Decreased □
381
382
8. How often do you usually have an alcoholic drink?
383 384
Daily □ Almost every day □
385
Once or twice a week □ Once or twice a month □
386
Once every couple of months □ Once or twice a year □
387
Not at all in the last 12 months □
388
389
9. How many days a week do you do light physical activity? (e.g a continuous gentle walk or
390
housework that lasts at least 30 minutes) 391
392
Daily □ Every 2-3 days □ Every 4-5 days □
393
Weekly □ Occasionally □ Never □
394
395
10. How many days a week do you do more strenuous physical activity? (e.g. a sport or jog that
396
lasts at least 30 minutes) 397
398
Daily □ Every 2-3 days □ Every 4-5 days □
399
Weekly □ Occasionally □ Never □
400
24
11. How often in the last month have you eaten fresh fruit or vegetables?
402 403
Daily □
404
More than once a week □
405
Weekly □
406
More than once a month □
407
Monthly □
408
Not at all □
409
410
12. Is this your first visit to a Food Bank? (if Yes, go to 14)
411 412
Yes □ No □
413
414
13. How many times have you used a food bank in the last month?
415 416
Once □ Twice □ Three times or more □
417
418
14. How many times have you used a food bank in the last 6 months?
419 420
Once □ Twice □ Three times or more □
25 422
15. What is the main reason for you coming to the food bank today?
423 424
Benefit Delays □ Delayed Wages □ Benefit Changes □
425
Low income □ Unemployed □ Sickness □
426
Debt □ Homeless □ Refused STBA □
427
Unexpected Expenditure □
428
Other □ __________________________________
429
430
16. Did you have unexpected expenses last month?
431 432
Yes □ No □
433
434
If yes, did you cut back onfood to meet these expenses?
435
436
Yes □ No □
437
438
17. In the last month have you ever had to reduce the size of your meals or skip meals
439
because there wasn't enough money for food? 440
441
Yes □ No □
26 443
If Yes, how many times has this happened?
444
445
Once or Twice □ Weekly □ More than once a week □
446
447
448
18. In the last month have you ever eaten less than you felt you should because there wasn't
449
enough money to buy food? 450
451
Yes □ No □
452
453
If Yes, how many times has this happened?
454
455
Once or Twice □ Weekly □ More than once a week □
456
457
458
19. In the last month have you ever been hungry but didn't eat because you couldn't afford
459
enough food? 460
27
Yes □ No □
462
463
If Yes, how many times has this happened?
464
465
Once or Twice □ Weekly □ More than once a week □
466
467
20. Here are some reasons why people don't always have the quality or variety of food they
468
want. As I list them, tell me if any of these reasons apply to you? 469
470
Not enough money □
471
Not available in local shops □
472
Not enough time for cooking/shopping □
473
Poor cooking/storage facilities □
474
Transport problems □
475
Not available in the work place □
476
Shopping is difficult with children □
477
Lack of cooking skills □
478
No particular reason □
28
Other □
480
481
22. Are there any things you would like to change about your current diet? (e.g. make it
482
healthier/ improve it/eat more or less) 483
484
Yes □ No □
485
486
23. What would you like to change?
487
488
________________________________________________________________________ 489
490
491
492
493
494
495
29 497
498
499
500
501