Transcriptome analysis suggests a role for the differential
expression of cerebral aquaporins and the MAPK
signalling pathway in human temporal lobe epilepsy
SALMAN, Mootaz, SHEILABI, Mariam A., BHATTACHARYYA, Dev, KITCHEN,
Philip, CONNER, Alex C., BILL, Roslyn M., WOODROOFE, Nicola
<http://orcid.org/0000-0002-8818-331X>, CONNER, Matthew
<http://orcid.org/0000-0001-5662-9121> and PRINCIVALLE, Alessandra
<http://orcid.org/0000-0001-5375-0604>
Available from Sheffield Hallam University Research Archive (SHURA) at:
http://shura.shu.ac.uk/16281/
This document is the author deposited version. You are advised to consult the
publisher's version if you wish to cite from it.
Published version
SALMAN, Mootaz, SHEILABI, Mariam A., BHATTACHARYYA, Dev, KITCHEN,
Philip, CONNER, Alex C., BILL, Roslyn M., WOODROOFE, Nicola, CONNER,
Matthew and PRINCIVALLE, Alessandra (2017). Transcriptome analysis suggests a
role for the differential expression of cerebral aquaporins and the MAPK signalling
pathway in human temporal lobe epilepsy. The European Journal of Neuroscience,
46 (5), 2121-2132.
Copyright and re-use policy
See
http://shura.shu.ac.uk/information.html
1
Transcriptome analysis suggests a role for the differential expression of cerebral
aquaporins and the MAPK signalling pathway in human temporal lobe epilepsy
Mootaz M. Salman1, Mariam A. Sheilabi1, Dev Bhattacharyya2, Philip Kitchen3, Alex C.
Conner3, Roslyn M. Bill4, M. Nicola Woodroofe1, Matthew T. Conner1,5 and Alessandra P.
Princivalle1*
1Biomolecular Sciences Research Centre (BMRC), Sheffield Hallam University, Howard
Street, Sheffield, S1 1WB.
2Neurosurgery Department, Royal Hallamshire Hospital, Sheffield, UK.
3School of Clinical and Experimental Medicine, University of Birmingham, Edgbaston,
Birmingham B15 2TT, UK.
4School of Life and Health Sciences, Aston University, Aston Triangle, Birmingham B4 7ET,
UK.
5School of Biology, Chemistry and Forensic Science, University of Wolverhampton, Wulfruna
St, Wolverhampton WV1 1LY
*Corresponding Author:
A.P. Princivalle
1
Biomolecular Research Centre (BMRC),
Sheffield Hallam University,
Howard Street, Sheffield, S1 1WB.
Email: [email protected]
Running title: The role of AQPs and MAPK in TLE pathogenesis.
The total number of pages 38, figures 6, tables 2. Supplementary 1 figure and 1 table.
The total number of words in: (5323) the whole manuscript; (250) the Abstract.
2
Abstract
Epilepsies are common disorders of the central nervous system (CNS), affecting up to 2% of
the global population. Pharmaco-resistance is a major clinical challenge affecting about 30%
of temporal lobe epilepsy (TLE) patients. Water homeostasis has been shown crucial for
regulation of neuronal excitability. The control of water movement is achieved through a
family of small integral membrane channel proteins called aquaporins (AQPs). Despite the
fact that changes in water homeostasis occur in sclerotic hippocampi of people with TLE, the
expression of AQPs in the epileptic brain is not fully characterised. This study uses
microarray and ELISA methods to analyse the mRNA and protein expression of the human
cerebral AQPs in sclerotic hippocampi (TLE-HS) and adjacent neocortex tissue (TLE-NC) of
TLE patients.
The expression of AQP1 and AQP4 transcripts was significantly increased, while that of the
AQP9 transcript was significantly reduced in TLE-HS compared to TLE-NC. AQP4 protein
expression was also increased while expression of AQP1 protein remained unchanged, and
AQP9 was undetected.
Microarray data analysis identified 3,333 differentially regulated genes and suggested the
involvement of the MAPK signalling pathway in TLE pathogenesis. Proteome array data
validated the translational profile for 26 genes and within the MAPK pathway (e.g. p38, JNK)
that were identified as differentially expressed from microarray analysis. ELISA data showed
that p38 and JNK inhibitors decrease AQP4 protein levels in cultured human primary cortical
astrocytes. Elucidating the mechanism of selective regulation of different AQPs and
associated regulatory proteins may provide a new therapeutic approach to epilepsy
3
Introduction
Epilepsies are among the most common disorders of the central nervous system (CNS). It is
estimated that over 65 million people worldwide suffer from these debilitating conditions
(Ngugi et al., 2010; Moshé et al., 2015). Temporal lobe epilepsy (TLE) accounts for about
one-third of all patients with epilepsy (Heuser et al., 2012). The majority of current
anti-epileptic drugs (AEDs) target the ion channels that mediate neuronal excitability (Rogawski
& Löscher, 2004; Landmark, 2006), however about 30% of patients become medically
refractory to AEDs (Löscher, 2011; Löscher et al., 2013). Pharmaco-resistance in TLE is
often associated with hippocampal sclerosis (HS). The sclerotic hippocampus is
characterized by neuronal loss, astrogliosis and increased microvascular density (Blümcke
et al., 2012; Alonso-Nanclares & DeFelipe, 2014), particularly at the perivascular end-feet of
astrocytes (Eid et al., 2005).
Astrocytes play a major role in regulating water and ion (particularly K+) homeostasis in the
brain. The association of K+ homeostasis and water transport is known to mediate synaptic
transmission by modulating the extracellular environment around neurons (Simard &
Nedergaard, 2004); additionally astrocytes can be depolarized and produce an action
potential exhibiting neuronal-like characteristics (Bordey & Sontheimer, 1998). Water
homeostasis is an important factor in modulating seizure susceptibility (Andrew, 1991;
Schwartzkroin et al., 1998; Lee et al., 2012). Magnetic resonance imaging (MRI) of sclerotic
hippocampi from TLE sufferers (TLE-HS) showed an increase in T2-weighted signal (Bronen
et al., 1991; Dawe et al., 2014) and diffusion-weighted imaging demonstrated higher
diffusion coefficient in TLE-HS patients compared to controls (Wieshmann et al., 1999). All
these data indicated higher free water content in sclerotic hippocampi tissue (Lee et al.,
2004; Heuser et al., 2010).
The control of water movement into and out of cells is achieved via a family of small integral
4
been identified and characterised (Day et al., 2014). AQP4 is the predominant AQP in the
CNS and it has been identified and characterised in both neurons (Binder et al., 2006) and
glia (Nielsen et al., 1997). In the human hippocampus, AQP4 has been found in the Cornu
Ammonis (CA) and dentate gyrus (DG) areas. At the cellular and subcellular level, AQP4 is
abundantly expressed in the plasma membrane of the astrocytes that sheathe the
glutamatergic synapses, and shows the highest expression in perivascular astrocytes, where
it is localised to the plasma membrane of astrocytic end-feet at the glia limitans (Lee et al.,
2004; Gleiser et al., 2016). AQP4 is co-localized with inwardly-rectifying K+ channels (Kir4.1)
and glial K+ uptake is attenuated in AQP4 knockout mice compared to wild-type, indicating a
functional interaction (Padmawar et al., 2005; Binder et al., 2006; Binder et al., 2012). In the
sclerotic hippocampus, astrocytes have fewer Kir4.1 channels and immunohistological
studies have indicated that Kir4.1 is lost from perivascular end-feet in sclerotic hippocampi of
TLE patients (Heuser et al., 2012). It is not known if this change in expression is due to; or
driven by, changes at the transcript level or changes in protein stability/degradation. There is
also some controversy in the literature concerning the exact nature of the relationship
between AQP4 and Kir4.1 in astrocytes, with one study suggesting that glial AQP4 and
Kir4.1 do not interact functionally (Zhang & Verkman, 2008).
Other AQPs have been identified in the CNS: AQP1 in the dorsal-root ganglia (Shields et al.
2007) and in the epithelium of the choroid plexus, where cerebrospinal fluid (CSF) is
produced (Oshio et al., 2005) and AQP9 in the substantia nigra (Badaut et al., 2004). AQP1,
3, 4, 5, 8, 9 and 11 have been shown to be expressed at gene and protein levels in the
rodent brain, principally in astrocytes (Gorelick et al., 2006; Yang et al., 2009; Badaut et al.,
2014). Moreover, AQPs 3, 5 and 8 are expressed in the DG area in both astrocytes and
neurons (Yang et al., 2009). However, there is still little known about the expression profile
of human cerebral AQPs, particularly in TLE patients. For example, there is contradictory
evidence describing the expression of AQPs in sclerotic and non-sclerotic hippocampi: Lee
et al showed AQP1 and AQP4 protein expression in astrocytes located in the hippocampal
5
astrocytes in the sclerotic hippocampi tissue of TLE patients (n=4) compared to non-sclerotic
hippocampi (n=5). Both Lee et al, and .Eid et al. reported an increase in AQP4 protein in
mesial temporal lobe epilepsy (MTLE) hippocampi compared to non-MTLE, however a
simultaneous loss of perivascular AQP4 localization was seen and attributed to loss of
dystrophin localization. Bebek et al. reported that there was neither difference in the
expression of AQP1 and AQP4 transcripts nor the AQP4 protein in 23 patients. Jamali et al.
showed an increase in AQP1 transcript following a microarray study on hippocampal tissues
from 15 TLE patients; however, their findings were not consistent following RT-PCR
validation and therefore the gene was discounted from further analysis.
A number of studies have investigated the possible mechanisms involved in AQP regulation;
these studies identified the p38 Mitogen-activated Protein Kinase-dependent (MAPK)
pathway as the possible primary mechanism controlling the altered expression of some
AQPs (Fujita et al., 2003; Yang et al., 2013b). The MAPK family consists of three major
pathways, the extracellular signal regulated kinase (ERK) pathway, the p38 pathway and
C-Jun N-terminal kinases (JNK) pathway. The MAPK pathway has been implicated in
increased epileptic seizures due to hippocampal sclerosis (Pernice et al., 2016). The
purpose of this current study was to analyse gene expression and protein profiling in
TLE-HS and the non-sclerotic temporal lobe that had no ictal or inter-ictal activity (TLE-NC;
neocortex). Gene network analysis using Database for Annotation, Visualization, and
Integrated Discovery (DAVID) and the Kyoto Encyclopedia of Genes and Genomes (KEGG)
analysis identified the MAPK pathway as the most likely pathway affected in TLE identified in
the microarray. ELISA was conducted to investigate the involvement of p38, ERK1/2 and
JNK MAPKs in regulating AQP4 protein expression in primary human astrocytes using the
specific inhibitors: SB203580, PD98059 and SP600125, respectively (Wang et al., 2007).
Direct targeting of AQPs and/or the molecular mechanisms of their regulation via the MAPK
signalling pathways could open new horizons for more specific and targeted treatments for
6
Materials and methods:
Sample collection and patients' clinical information:
This research was approved by South Yorkshire research ethics committee (08/H1310/49)
and it followed the code of ethics of the World Medical Association (2001). The samples
were obtained from the Royal Hallamshire Hospital (R&D approval STH15210). All samples
were obtained with the understanding and the written consent of each patient. The sample
collection procedure fully conformed to the Code of Ethics of the World Medical Association
(Declaration of Helsinki), British Medical Journal (1964).
Patients with pharmaco-resistant TLE associated with unilateral hippocampal sclerosis were
recruited. The diagnosis of TLE-HS was made by the treating clinician based on MRI brain
scan and inter-ictal and ictal EEG characteristics, being consistent with a seizure focus in the
hippocampus within the temporal lobe. The total numbers of patients used for this study
were ten TLE patients (6 females and 4 males), their age at surgery was 38.2 ± 10.2 years,
the average age at onset of first non-febrile seizure was 11.6 ± 9.9 years and the average
duration of epilepsy was 26.6 ± 15.8 years.These patients underwent a therapeutic selective
amygdalohippocampectomy. After surgery, two samples were obtained: sclerotic
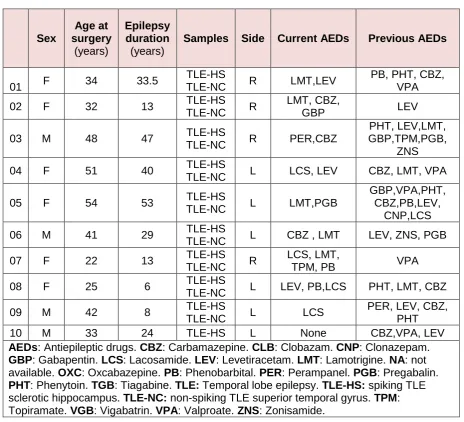
hippocampus (TLE-HS), and non-spiking neocortex (TLE-NC). Full clinical information for
the patients is shown in Table 1.
Microarray analysis (MA)
Total RNA was extracted using SV Total RNA Isolation System (Promega, Z3100) according
to the manufacturer's instructions. The quality and purity of the prepared RNA was assayed
using a NanoDrop-1000 spectrophotometer and Agilent Bioanalyser-2100, to ensure only
high-quality RNA samples with A260/A280 ratio of 1.8 to 2.0 and an A260/A230 ratio of > 2.0 were
used for the microarray study. Starting from 100 ng of RNA, cRNA samples were
synthesized and labelled with Cy3 or Cy5 using the Two-colour Low Input Quick Amp
labelling kit (Agilent Technologies, 5190-2306). TLE-HS hippocampi were labelled with Cy5
7
TLE-NC samples were co-hybridized onto SurePrint G3 Human Gene Expression 8x60K
Microarrays (Agilent Technologies, G4851A). The microarray array was scanned on Agilent
Technologies SureScan scanner. Raw data was extracted using Agilent feature extraction
software (version 10.7.1) and was then normalized by the locally weighted scatter plot
smoothing (LOWESS) normalization method. The Rank Product (RP) test was used to
identify the differentially expressed genes (P < 0.05) using Multi-Experiment Viewer (MeV)
software, version 4.9 (Saeed et al., 2003; Breitling et al., 2004; Koziol, 2010). The list of up-
and down-regulated genes was submitted to the bioinformatics and functional annotation
tool provided by DAVID, version 6.7 (Huang et al., 2009a; b). Then KEGG pathway
enrichment analysis was done to identify potential pathways that are possibly associated
with TLE-HS pathophysiology (http://david.abcc.ncifcrf.gov/).
In order to obtain biological information underpinning the molecular mechanisms and
regulatory networks associated with TLE pathogenesis, microarray data was further
assessed using the “TargetMine” (http://targetmine.mizuguchilab.org/) and the Gene
Ontology Consortium (http://geneontology.org/) bioinformatics tools to obtain functional
annotation clustering and gene ontology (GO) terms for the differentially-regulated genes
(DEGs). Key results are summarised along with gene count, p value and fold enrichment in
supplementary Table 1.
Sandwich enzyme-linked immunosorbent assay (ELISA)
A 96-well microtiter flat-bottomed polystyrene plate (Nunc, Wiesbaden, Germany) was
coated by overnight incubation at 4°C with 5 µl/well of either rabbit polyclonal
anti-AQP4 (Abcam, ab46182) diluted 1:500, rabbit polyclonal anti-AQP1 (Santa Cruz, sc-208110)
diluted 1:400 or rabbit polyclonal anti-AQP9 (LS-C20770) diluted 1:500; all antibodies were
diluted in carbonate/bicarbonate buffer (pH 9.6). The plates were washed twice for 5 minutes
with Phosphate Buffered Saline and 0.05% Tween 20 (PBS-T) (pH 7.5). The remaining
unsaturated protein-binding sites in the coated wells were blocked by adding blocking buffer
8
were washed twice for 5 minutes with PBS-T. Hippocampal proteins were extracted using
CelLyticTM (Sigma, Cat. No. C2978) supplemented with protease inhibitor cocktail (Sigma,
Cat. No. P2714, 1:100). The total protein concentration was determined using Pierce™ BCA
Protein Assay Kit (Thermofisher Scientific, Cat. No. 23225) following the manufacturer’s
procedure. 100 μl equally diluted samples at a concentration of 600 mg/ml were added to
each well and incubated for 90-120 minutes at 37°C. Samples were then aspirated and the
plates were washed twice with PBS-T. 100 μl of either the 1:1 diluted mouse monoclonal
anti-AQP4 antibody (Abcam, ab9512), mouse monoclonal anti-AQP1 (Abcam, ab11025), or
goat polyclonal anti-AQP9 (Santa Cruz F-17; sc-14988) were added to each well. The plates
were covered with adhesive plastic and incubated for 2 h at 37°C and then washed twice for
5 minutes with PBS-T. Then 100 μl of horseradish peroxidase (HRP)-conjugated secondary
antibody, either chicken anti-mouse (Santa Cruz, sc-2954) for AQP4 and AQP1 or chicken
anti-goat (c-2953) for AQP9, diluted at 1: 5,000 in freshly-prepared blocking buffer, was
added to each well and incubated for 30 minutes at 37°C. The plates were washed (with
gentle shaking) four times for 5 minutes with 200 µl PBS-T, followed by a single wash with
PBS. The plates were incubated with 100 μl/well of RayBioTM TMB One-Step Substrate
Reagent (Raybiotech; Cat. No. J120215098), at room temperature for 30 minutes, under
light-protected conditions After the colour was developed, the reaction was stopped by
adding 50 μl of 2 M H2SO4. The absorbance values were then immediately measured at 450
nm using a Perkin Elmer Wallac 1420 Victor2 microplate reader.
Proteome Profiling
Proteome Profiler™ Human MAPK array (R&D Systems, ARY002B) was used to investigate
the possible role of signaling molecules of all three major families of MAPKs, the
extracellular signal-regulated kinases (ERK1/2), c-Jun N-terminal kinases (JNK1-3), and
different p38 isoforms (α/β/δ/γ) in TLE-HS. Protein from 3 matching pairs of TLE-HS and
TLE-NC patient samples were extracted using CelLyticTM 10ml per gram of tissue (Sigma,
C2978) supplemented with protease inhibitor cocktail 1:100 (Sigma, P2714). The total
9
following the manufacturer's procedure. Each proteome profiler membrane was then
incubated with 300 μg of protein lysate, according to the manufacturer's instructions. The
HRP-conjugated streptavidin provided in the kit was replaced with IRDye® 800CW
Streptavidin (LI-COR, 926-32230) and it was diluted at1:2000 using the array buffer 5 (R&D
Systems, ARY002B). All of the following steps were performed according to the
manufacturer’s recommendation. The arrays were scanned with LI-COR Odyssey® Infrared
Imaging System and quantified with Image Studio™ software (LI-COR) to determine the
relative amount of the specific MAPK proteins.
Cell Culture
Primary human cortical astrocytes (Sciencell, Cat. No. 1800) were plated into 75 cm2 culture
flasks (Thermo Scientific Nunc Cell Culture Treated EasyFlasks) and cultured routinely in
Astrocyte Medium (Sciencell; 1801) containing 1% fetal bovine serum (FBS, Sciencell Cat.
No. 0010), 5 ml astrocyte growth supplement (AGS, Sciencell Cat. No. 1852), and 5 ml 1%
penicillin/streptomycin solution (P/S, Sciencell Cat. No. 0503). Cultures were maintained at
37°C and 5% air in a humidified environment.
Treatment with p38, ERK1/2 and JNK inhibitors
In order to investigate the possible role of p38, ERK1/2 and JNK in the differential regulation
of AQP4 expression in astrocytes, the effects of SB20358010 µM a p38 inhibitor (Hua et
al., 2002), PD98059 10 µM a ERK1/2 inhibitor (Hua et al., 2002) and SP600125 40 µM a
JNK inhibitor (Wallace et al., 2012) were examined in human primary cortical astrocytes for
6h. Data are presented as a fold-change normalised to the experimental control (n=4). In all
cases, cells were at least 92% viable.
Statistical analysis
Microarray analysis, ELISA and proteome profiling data were found not to be normally
10
analysis tests were used to identify significant differences between samples (P ≤ 0.05 was
taken as significant).
Results
Microarray (MA) gene expression analysis
In the MA analysis on the SurePrint G3 human gene expression 60K microarrays (Agilent
Technologies, G4851A), a total number of 34,197 uniquely-annotated probes were present
and significant differences in the expression levels of 3,333 genes were identified. In the
TLE-HS tissue, 1,821 genes (5% of all detected genes) were significantly up regulated and
1,511 genes (4%) were significantly down regulated compared to TLE-NC tissue from seven
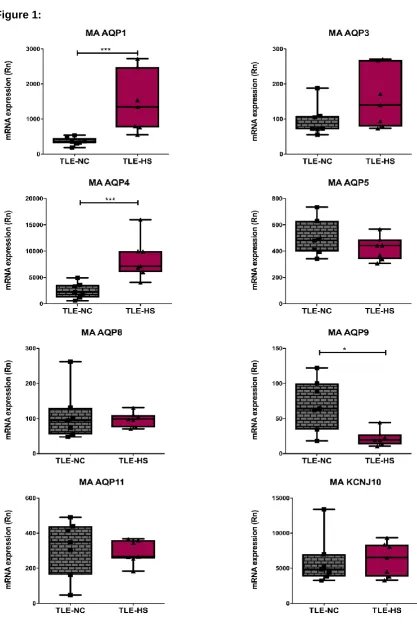
patients. Figure 1 shows the data for all investigated cerebral AQPs and their associated
Kir4.1 channel. Fold change (FC) was calculated by dividing the value representing the gene
expression in TLE-HS by the corresponding TLE-NC value. AQP1 and AQP4 mRNA levels
were both significantly increased (4.03-fold ± 0.89-, p<0.0001 (n= 7) and 3.42-fold ±0.58,
p<0.0001 (n= 7); respectively). AQP9 mRNA levels were significantly reduced to 0.31-fold
±0.06, p=0.01 (n= 7). There was no significant difference in mRNA levels for AQP3, AQP5,
AQP8, AQP11 or Kir4.1.
Protein expression levels of AQP4 and AQP1
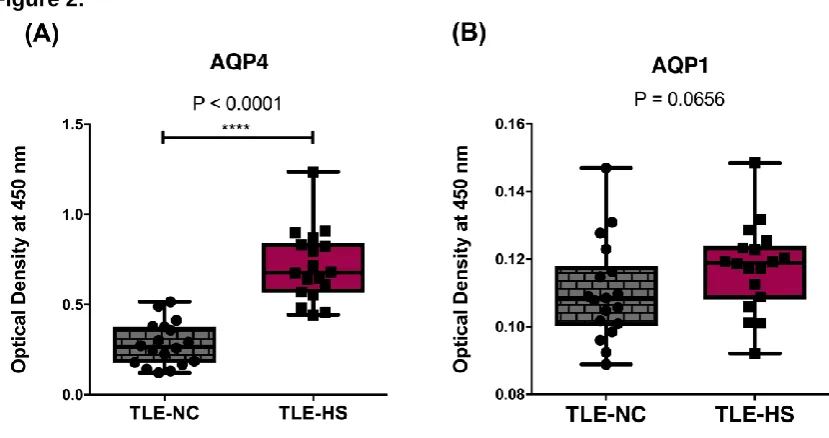
The AQP ELISA data demonstrated a significant increase in AQP4 protein expression in
TLE-HS samples (2.53-fold ± 0.1-fold, p<0.0001 n= 3) compared to TLE-NC samples from
the same set of patients (Figure 2A). AQP1 protein was measurable in both samples,
however there was no detectable significant difference (p=0.065) in AQP1 protein levels in
the sclerotic TLE-HS samples compared to non-sclerotic TLE-NC samples (Figure 2B). The
expression of AQP9 protein could not be detected using our custom-made ELISA system
with the combination of antibodies used.
11
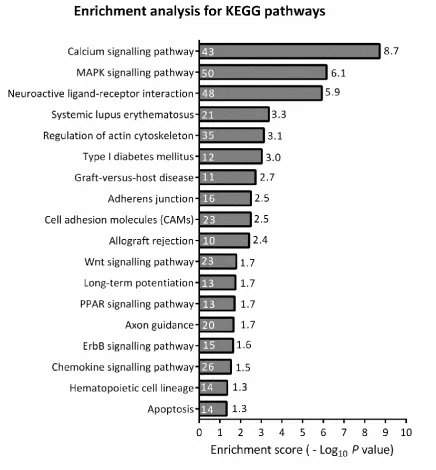
The 3,333 differently-regulated genes from the MA analysis were submitted to the
bioinformatics database, DAVID, using KEGG database for pathway enrichment analysis. To
minimize false positives among significantly-enriched functions, a false discovery rate (FDR)
≤0.05 (-log P-value = 1.33) was used to determine the probability that each biological
function assigned to that data set was due to chance alone. The calcium signalling pathway,
MAPK signalling pathway and neuroactive ligand-receptor interaction pathway showed the
highest enrichment scores in the sclerotic TLE-HS tissue compared to TLE-NC (Figure 3).
The MAPK signalling pathway was the second most highly-represented pathway with an
enrichment score of 6.1 (after the Ca2+ signalling pathway with an enrichment score of 8.7)
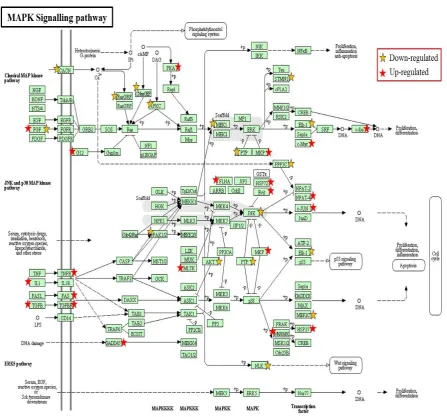
and the one with the highest number of significantly-regulated genes. The expression of 50
MAPK genes was altered: 27 genes had a higher expression and 23 genes had a lower
expression in TLE-HS compared to the TLE-NC tissue. Their distribution profile within the
MAPK pathway is illustrated in Figure 4.
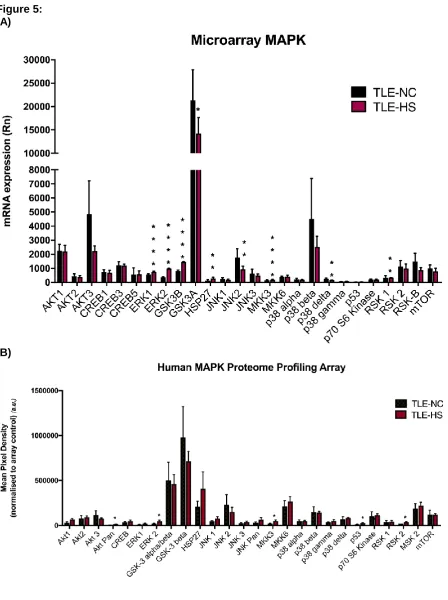
MAPK signalling profile in TLE-NC and TLE-HS samples
Since analysis of the MA data demonstrated the involvement of the MAPK signalling
pathway in TLE pathophysiology (Figures 3 and 4), 26 of the significantly-enriched MAPK
related genes (Figure 5a) were investigated at the protein level using a Proteome Profiler
Human MAPK Array Kit (Figure 5b). Transcription levels were determined by reanalysing the
MA data for each of these 26 individual genes to determine the protein expression level in
TLE compared to TLE-NC. In addition, the transcriptional and translational expression FC of
a number of significant MAPKs was calculated by dividing the gene or protein expression
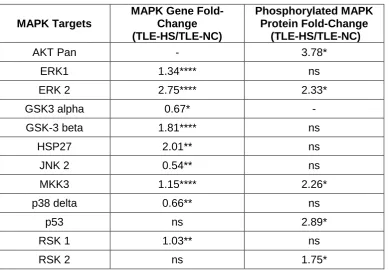
level in TLE-HS by its corresponding TLE-NC value as shown in Table 2.
The results show significant up-regulation of ERK2 and MMK3 at both the gene (2.75-fold
±0.02; p<0.0001; 1.15-fold ±0.09; p<0.0001) and protein level (2.33-fold ±0.65; p=0.02;
2.26-fold ±0.53; p=0.02). There were also significant increases in protein levels of AKT Pan
12
although there were no significant differences at the mRNA level. Several genes showed
significant expression changes that were not accompanied by a corresponding change in
protein expression. These included the up-regulation of ERK1 (1.34-fold ±0.02; p<0.0001),
GSK3-beta (1.81-fold ±0.01; p<0.0001), HSP27 (2.01-fold ±0.27; p=0.0062) and RSK1
(1.03-fold ±0.01; p<0.018) and the down-regulation of GSK3-alpha (0.67-fold ±0.06;
p=0.0419), JNK2 (0.54-fold ±0.04; p=0062) and p38 delta (0.66-fold ±0.01; p=0.0033).
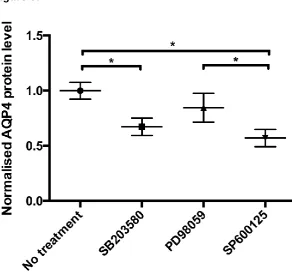
Effect of p38, ERK1/2 and JNK inhibitors on AQP4 protein expression in primary
human cortical astrocytes using sandwich ELISA.
Data are presented as fold-change compared to untreated astrocytes (n=4). Figure 6 shows
that treating astrocytes with the p38 inhibitor caused a significant reduction in AQP4 protein
expression (0.67-fold ± 0.01; p=0.014). A similar trend in reduction of AQP4 protein
expression was seen after treating the cells with a JNK inhibitor (0.57-fold ± 0.009; p=0.007).
There was no change in AQP4 protein expression in astrocytes following ERK1/2 inhibitor
treatment (p value=0.27).
Discussion
This study has demonstrated a differential expression of AQPs 1, 4 and 9 transcripts, and
revealed changes in AQP4 protein expression in human TLE-HS along with twelve key
regulatory elements of the MAPK pathway by DAVID/KEGG analysis. Our results together
with evidence of TLE-impaired water homeostasis (Bronen et al., 1991; Lee et al., 2004;
Heuser et al., 2010; Dawe et al., 2014) may implicate these elements in the pathophysiology
of TLE directly or indirectly through their effect on AQP expression.
Regulation of water transport is increasingly being suggested as a mechanism in the
aetiology of TLE (Bronen et al., 1991; Lee et al., 2004; Heuser et al., 2010; Dawe et al.,
2014). A rapid increase in brain water-content can result in seizures (Andrew, 1991).
13
the size of the extracellular space (Janigro & Walker, 2014). This can result in an increase in
the extracellular K+ concentration, which has a significant effect in increasing seizure
susceptibility (Dietzel et al., 1980; Dudek & Rogawski, 2005). Experiments in AQP4 -/- mice
suggested a direct role for AQP4 in controlling neurotransmission via modulating dopamine
metabolism (Fan et al., 2005; Ding et al., 2007) and glutamate uptake (Li et al., 2012; Yan et
al., 2013). Since elevated extracellular potassium and glutamate concentrations are
well-known drivers of epilepsy (Cho, 2013) and AQP4 appears to positively regulate the uptake of
both of these molecules into astrocytes, it may be that the upregulation of AQP4 is a
homeostatic response to high concentrations of these molecules. However, because AQP4
is mislocalized in the astrocytes of the sclerotic hippocampus (Eid et al., 2005; Alvestad et
al., 2013), this homeostatic response is insufficient for preventing seizures.
In the present study, the whole-genome transcriptional profile was determined using
microarray and the gene network analysing software DAVID and KEGG. Differentially
expressed putative target genes, biomarkers and pathways that may play a role in TLE have
been identified. This study reports that the transcript expression of AQPs 1 and 4 are
significantly increased, while the transcript expression of AQP9 is significantly reduced in
TLE-HS compared to TLE-NC. This was accompanied by a significant upregulation of the
transcripts of the astrocytic biomarker, glial fibrillary acidic protein (GFAP) in TLE-HS
compared to TLE-NC, which reflects a state of gliosis in TLE-HS (Lee et al., 2004). The
transcripts of the neuronal biomarker, neuronal nuclear antigen (NeuN), was significantly
decreased in TLE-HS compared to TLE-NC which could refer to neuronal loss in sclerotic
tissue samples (supplementary material Figure 1).
Of the investigated cerebral AQP genes, transcriptome analysis indicated only a significant
differential expression of AQP1, AQP4 and AQP9 transcripts. The ELISA data in this study
showed a significant increase in AQP4 protein expression in sclerotic tissue samples
compared to the non-sclerotic samples from the same set of patients that followed the same
14
the findings of Das et al. (2012) who reported a ~1.8-fold increase in AQP4 protein
expression in six sclerotic samples compared to three non-matched post-mortem controls.
Similarly, Lee et al (2004) reported a 1.6-fold increase in AQP4 transcript by microarray and
a 2.6-fold increase by qPCR in sclerotic hippocampi from four mesial TLE patients (MTLE)
compared to three non-matched TLE patients. This is qualitatively consistent with our
observation of a 3.4-fold increase in AQP4 transcript by microarray in seven sclerotic
hippocampi from TLE patients compared to matchednon-sclerotic tissue. A study by Eid et
al. reported a 3.6-fold increase in AQP4 protein in six MTLE patient hippocampi compared to
six non-MTLE controls, and a simultaneous loss of perivascular AQP4 localization attributed
to loss of dystrophin localization. Bebek et al. claimed that there was no change in AQP4
protein expression in five MTLE patients compared to five non-MTLE using
immunofluorescence. However, the number of AQP4-positive cells per field was the reported
measure for AQP4 expression, but there was no attempt to measure changes in intensity of
AQP4 staining in those positive cells. In addition, the authors reported that AQP4 transcript
was unchanged in 23 MTLE samples compared to seven post-mortem controls. However,
their control samples spanned a 1 million-fold range (normalised expression from 10-7 to
10-1; (see Bebek et al., Figure 1B), compared to a 4-fold range in our data (Rn values from
5,000 to 20,000 (Figure 1). This large difference in sample-to-sample variability might
explain why the data from some studies (Eid et al., 2005; Lee et al., 2004) and our data
showed a significant difference in AQP4 expression whereas Bebek et al., (2013) did not.
Changes in differential AQP4 expression could be implicated in the pathophysiology of
sclerosis via water-mediated changes in neuronal activity through AQP4-mediated water
efflux at the end-feet (Amiry-Moghaddam & Ottersen, 2003).
Our microarray data have revealed a significant upregulation of AQP1 at the mRNA level.
This result is in agreement with the findings reported through the transcriptomics analysis
work by Jamali et al., (2006).Normally in the hippocampus, AQP1 is only observed in
astrocytes or cerebrovascular endothelial cells under stress conditions. However, in a
15
following SE at 4 weeks, and was up-regulated at 6 weeks when a significant up-regulation
was reported in epileptic hippocampi compared to control (Kim et al., 2009). In addition,
AQP1 expression in cerebrovascular endothelial cells is only highly expressed in conditions
where the blood brain barrier (BBB) is disrupted such as in malignant brain tumours
(Papadopoulos & Verkman, 2013). There is transient opening of the BBB during SE, which
shows epileptogenic effects and also induces inflammation (Kovács et al., 2012; Gorter et
al., 2015). Therefore, in drug resistant TLE hippocampi, AQP1 expression could be induced
in endothelial cells, which could facilitate water movement across the BBB but this needs to
be confirmed and validated using immunohistochemical studies. However, the AQP1 ELISA
data reveal that there was no significant difference in AQP1 protein levels between TLE-HS
and TLE-NC samples which could be due to various translational regulation mechanisms.
It is well known that regulatory mechanisms underlying AQP gene and protein expression
are complex and could be influenced by various physiological, pathological or regulatory
stimuli, including hormones (Gu et al., 2003), cytokines (Yang et al., 1995) and/or stress
activated signals (Arima et al., 2003). For example, hypertonic stress upregulated AQP1
expression in rodent renal medullary cells by inducing an extracellular signal-regulated
kinase including p38 and JNK, which regulate a hypertonicity-responsive element present in
the AQP1 promoter (Umenishi & Schrier, 2003). It has been shown that some pathological
conditions including multiple sclerosis could result in simultaneous upregulation of AQP1 and
AQP4 (Satoh et al., 2007). However this is not always the case, as suggested by the data
from our study, which is supported by comparable findings (Mao et al., 2006) showing that
inducing severe hydrocephalus stimulated AQP4, but not AQP1, protein expression in
perivascular astrocytes.
Restoration of the ion gradients, after seizures, requires energy and an enhanced oxygen
and glucose consumption; in fact, it was found that during epileptic activity there is a
16
(Folbergrová et al., 2000). In order for the neurons to meet this enormous metabolic demand
they use glycerol and lactate as a source of energy (Magistretti et al., 1999; Badaut et al.,
2014). The aquaglyceroporin, AQP9, is expressed in both astrocytes and neurons in the
brain. AQP9 is able to transport both glycerol and lactate, therefore, it may play a vital role in
the changes in astrocyte and neuronal energy metabolism that occurs in response to seizure
activity (Amiry-Moghaddam & Ottersen, 2003; Badaut & Regli, 2004). In the present study,
the total AQP9 transcript level is reduced in TLE-HS compared to TLE-NC indicating that it
might be contributing to the pathophysiology of TLE-HS; however, these results need to be
confirmed at the protein level in future studies.
DAVID and KEGG analysis of the microarray data identified that 50 of the 3,333 differentially
regulated genes were most commonly associated with the MAPK pathway in TLE-HS
compared to TLE-NC, as indicated in Figure 4. Interestingly, it has been shown that the p38
MAPK-dependent pathway is possibly the primary mechanism in controlling the altered
expression of a number of major AQPs including AQP4 and AQP9 (Fujita et al., 2003) as
well as AQPs 3, 5 and 8 (Yang et al., 2013b). This study has identified changes in AQP4
protein expression in human TLE-HS and key regulatory elements of the MAPK pathway by
DAVID/KEGG analysis. Our results (Figure 6) reveals that the activity of p38 and JNK
MAPKs, but not ERK1/2, contributes to the differential expression of AQP4 protein and
hence the astrocytic response to changes in water homeostasis. These results are in
agreement with previous reports using cultured astrocytes and in animal models ( Rao et al.,
2010; 2011). Our results together with evidence of TLE-impaired water homeostasis (Bronen
et al., 1991; Lee et al., 2004; Heuser et al., 2010; Dawe et al., 2014) may implicate these
elements in the pathophysiology of TLE directly or indirectly through their effect on AQP
expression, therefore revealing possible new therapeutic targets. Further studies
investigating the effects of p38 and JNK inhibitors on animal models of epilepsy will be
17
The up-regulation of ERK2 at the genetic and protein levels could be linked to the
mechanism underlying the pathophysiology of sclerotic TLE. ERK activation has been
reported to induce epilepsy in mouse models by stimulating the N-methyl-D-aspartate
(NMDA) receptor. The ERK signalling cascade may contribute to the aetiology underlying
some other epileptic types in humans (Nateri et al., 2007). The present study also reveals a
significant increase in p53 protein in the sclerotic hippocampi of TLE patients. This is
consistent with immunohistochemical data that showed up-regulation of p53 in the
hippocampi of TLE patients (Xu et al., 2007) along with a correlation between
seizure-activated neuronal death in rat hippocampi and p53 responses (Sakhi et al., 1994; Araki et
al., 2004). However, neuropathological studies reveal that seizure-mediated cellular death in
TLE happens in a very limited manner (Bernasconi et al., 2002; Mathern et al., 2002; Liu et
al., 2003; Engel et al., 2007). This might suggest a pro-apoptotic effect of p53; this study
suggested induced activities for several anti-apoptotic and cytoprotective signalling
cascades including AKT and RSK. AKT is the key modulator of the AKT-mTOR signalling
pathway that is involved in neurogenesis, dendrite development and synapse formation. This
result is consistent with the recently published study by Griffin and colleagues (Griffin et al.,
2016) . RSK modulates mTOR signalling and is involved in cell survival and proliferation in
addition to its role in inhibiting the pro-apoptotic function of Death-associated protein kinase
1 (DAPK1) and Bcl-2-associated death promoter (BAD). Furthermore, these cytoprotective
and anti-apoptotic properties could also be mediated by inhibition of JNK2 since JNK2 is
known to stabilise p53 activity by blocking its ubiquitination (Fuchs et al., 1998; Bode &
Dong, 2007); and additionally the inhibition of p38 delta (Zarubin & Jiahuai, 2005).
Differential changes in apoptosis-related signalling cascades are largely found in TLE tissue.
In humans, these findings could indicate that seizure-mediated stress could result in
alterations in gene expression between adaptive responses that inhibit the neuronal loss and
18
Seizures are usually associated with a high energetic demand due to abnormal
simultaneous firing of a large number of neurons. As the seizure progresses, the increased
level of lactic acid decreases the tissue pH and causes metabolic-acidosis, which terminates
the seizure (Yang et al., 2013a). During seizures, there is a remarkable increase in
glycolysis due to inhibited aerobic metabolism; lactic acid is utilised as one of the major
sources of energy (Williamson et al., 2005). Previous clinical studies suggest that
carbohydrate metabolism and glycolysis could induce susceptibility to epileptic attacks and
inhibiting glycolysis could have antiepileptic effects (Huttenlocher, 1976). The results from
this study show significant differential expression of a number of essential elements involved
in cerebral energy metabolism including the upregulation of the beta isoform of glycogen
synthase kinase-3 (GSK3β), but not the alpha isoform. GSK3β is known to act as a negative
regulator in the hormonal control of glucose homeostasis and an inactivating agent of
glycogen synthase (Cho, 2011). The dual specificity mitogen-activated protein kinase kinase
3 (MKK3) is also upregulated. MKK3 is activated by mitogenic and environmental stress and
also by insulin and it is necessary for the expression of the glucose transporter (mainly
through its effect on GLUT1 and GLUT4) (Fujishiro et al., 2001; Zarubin & Jiahuai, 2005).
Further understanding of the specific role of energy metabolism and homeostasis in TLE
could shed light on TLE pathophysiology, and may help in identifying novel therapeutic
strategies.
In conclusion, the mechanisms involved in TLE aetiology are complex and currently no
single factor that could explain the underlying pathophysiology has been identified.
Understanding the signalling networks is essential for discovery and validation of new
potential therapeutic targets and we have identified a number in this study using a global
transcriptomics approach. Despite the essential role of AQPs in the pathophysiology of many
diseases, including cerebral oedema, diabetes insipidus, cancer, TLE and many more, there
are still no clinically-available drugs that target AQPs specifically (Verkman, et al., 2014).
Therefore, understanding the molecular mechanisms involved in their regulation could
19
Targeting moleculesof the MAPK signalling pathway involved in the regulation of AQP4
expression could be one important area for future studies.
Funding Sources
This work was supported by BMRC Sheffield Hallam University (APP), RIHS University of
Wolverhampton (MC), the HCED grant number GD-13-3 (MMS), LMHESR 5368M (MAS).
Acknowledgements
We are grateful to Prof Francesco Falciani at Institute of Integrative Biology, University of
Liverpool, and Dr. Paul Heath at SiTraN, University of Sheffield, for providing support for the
microarrays analysis. Prof Paul Ince and the neuropathology team at Royal Hallamshire
Hospital Sheffield for confirming the HS diagnosis.
Competing Interest
The authors do not have any competing interest.
Author Contributions
MMS, MAS, MTC, and APP designed all experiments. MMS performed and analysed
experiments shown in figures 2, 5 and 6. MAS performed the microarray and subsequent
analysis shown in figures 1, 3 and 4. MMS performed all the statistics. MMS and MAS
equally drafted the manuscript. DB, PK, ACM, RMB, MNW, MTC and APP critically read and
revised the manuscript. All authors approved the final version of the manuscript.
Data Accessibility
All relevant data are within the paper and its Supporting Information files were made publicly
available at: DOI 10.6084/m9.figshare.5100394.
20
Anti-epileptic drugs (AEDs)Aquaporins (AQPs)
BBB: Blood Brain Barrier
Bcl-2-associated death promoter (BAD)
Central nervous system (CNS)
Cornu Ammonis (CA)
Database for Annotation, Visualization, and Integrated Discovery (DAVID)
Death-associated protein kinase 1 (DAPK1)
Differentially regulated genes (DEGs)
Dentate gyrus (DG)
Electroencephalogram (EEG)
Fold change (FC)
Glial fibrillary acidic protein (GFAP)
Glycogen synthase kinase-3 (GSK3β)
Gene Ontology (GO)
Hippocampal sclerosis (HS)
Kyoto Encyclopedia of Genes and Genomes (KEGG)
Mesial temporal lobe epilepsy (MTLE)
Microarray (MA)
Mitogen-activated Protein Kinase-dependent (MAPK)
21
Phosphate Buffered Saline and 0.05% Tween 20 (PBS-T)
RT-PCR (Real-Time Polymerase Chain Reaction)
Sandwich enzyme-linked immunosorbent assay (ELISA)
Sclerotic hippocampi (TLE-HS)
Temporal lobe epilepsy (TLE)
TLE-neocortex (TLE-NC)
References
Alonso-Nanclares, L. & DeFelipe, J. (2014) Alterations of the microvascular network in the sclerotic hippocampus of patients with temporal lobe epilepsy. Epilepsy & Behavior,
38, 48-52.
Alvestad, S., Hammer, J., Hoddevik, E.H., Skare, Ø., Sonnewald, U., Amiry-Moghaddam, M. & Ottersen, O.P. (2013) Mislocalization of AQP4 precedes chronic seizures in the kainate model of temporal lobe epilepsy. Epilepsy research, 105, 30-41.
Amiry-Moghaddam, M. & Ottersen, O.P. (2003) The molecular basis of water transport in the brain. Nature Reviews Neuroscience, 4, 991-1001.
Andrew, R.D. (1991) Seizure and acute osmotic change: clinical and neurophysiological aspects. Journal of the neurological sciences, 101, 7-18.
Araki, T., Shinoda, S., Schindler, C.K., Quan‐Lan, J., Meller, R., Taki, W., Simon, R.P. & Henshall, D.C. (2004) Expression, interaction, and proteolysis of death‐associated protein kinase and p53 within vulnerable and resistant hippocampal subfields following seizures. Hippocampus, 14, 326-336.
Arima, H., Yamamoto, N., Sobue, K., Umenishi, F., Tada, T., Katsuya, H. & Asai, K. (2003) Hyperosmolar mannitol stimulates expression of aquaporins 4 and 9 through a p38 mitogen-activated protein kinase-dependent pathway in rat astrocytes. Journal of Biological Chemistry, 278, 44525-44534.
Badaut, J., Fukuda, A.M., Jullienne, A. & Petry, K.G. (2014) Aquaporin and brain diseases. Biochimica et Biophysica Acta (BBA)-General Subjects, 1840, 1554-1565.
Badaut, J., Petit, J.-M., Brunet, J.-F., Magistretti, P., Charriaut-Marlangue, C. & Regli, L. (2004) Distribution of Aquaporin 9 in the adult rat brain: preferential expression in catecholaminergic neurons and in glial cells. Neuroscience, 128, 27-38.
22
Bebek, N., Özdemir, Ö., Sayitoglu, M., Hatırnaz, Ö., Baykan, B., Gürses, C., Sencer, A., Karasu, A., Tüzün, E. & Üzün, I. (2013) Expression analysis and clinical correlation of aquaporin 1 and 4 genes in human hippocampal sclerosis. Journal of Clinical
Neuroscience, 20, 1564-1570.
Bernasconi, A., Tasch, E., Cendes, F., Li, L. & Arnold, D. (2002) Proton magnetic resonance spectroscopic imaging suggests progressive neuronal damage in human temporal lobe epilepsy. Progress in brain research, 135, 297-304.
Binder, D.K., Nagelhus, E.A. & Ottersen, O.P. (2012) Aquaporin‐4 and epilepsy. Glia, 60, 1203-1214.
Binder, D.K., Yao, X., Zador, Z., Sick, T.J., Verkman, A.S. & Manley, G.T. (2006) Increased seizure duration and slowed potassium kinetics in mice lacking aquaporin‐4 water channels. Glia, 53, 631-636.
Blümcke, I., Coras, R., Miyata, H. & Özkara, C. (2012) Defining clinico‐neuropathological subtypes of mesial temporal lobe epilepsy with hippocampal sclerosis. Brain Pathology, 22, 402-411.
Bode, A.M. & Dong, Z. (2007) The functional contrariety of JNK. Molecular carcinogenesis,
46, 591-598.
Bordey, A. & Sontheimer, H. (1998) Properties of human glial cells associated with epileptic seizure foci. Epilepsy research, 32, 286-303.
Breitling, R., Armengaud, P., Amtmann, A. & Herzyk, P. (2004) Rank products: a simple, yet powerful, new method to detect differentially regulated genes in replicated microarray experiments. FEBS letters, 573, 83-92.
Bronen, R.A., Cheung, G., Charles, J.T., Kim, J.H., Spencer, D., Spencer, S.S., Sze, G. & McCarthy, G. (1991) Imaging findings in hippocampal sclerosis: correlation with pathology. American Journal of Neuroradiology, 12, 933-940.
Cho, C.-H. (2011) Frontier of epilepsy research-mTOR signaling pathway. Experimental & molecular medicine, 43, 231-274.
Cho, C.-H. (2013) New mechanism for glutamate hypothesis in epilepsy. Frontiers in cellular neuroscience, 7.
Das, A., Wallace, G., Holmes, C., McDowell, M.L., Smith, J.A., Marshall, J.D., Bonilha, L., Edwards, J.C., Glazier, S.S. & Ray, S.K. (2012) Hippocampal tissue of patients with refractory temporal lobe epilepsy is associated with astrocyte activation,
inflammation, and altered expression of channels and receptors. Neuroscience, 220, 237-246.
Dawe, R.J., Bennett, D.A., Schneider, J.A., Leurgans, S.E., Kotrotsou, A., Boyle, P.A. & Arfanakis, K. (2014) Ex vivo T 2 relaxation: associations with age-related
neuropathology and cognition. Neurobiology of aging, 35, 1549-1561.
23
Dietzel, I., Heinemann, U., Hofmeier, G. & Lux, H. (1980) Transient changes in the size of the extracellular space in the sensorimotor cortex of cats in relation to stimulus-induced changes in potassium concentration. Experimental Brain Research, 40, 432-439.
Ding, J.-H., Sha, L.-L., Chang, J., Zhou, X.-Q., Fan, Y. & Hu, G. (2007) Alterations of striatal neurotransmitter release in aquaporin-4 deficient mice: An in vivo microdialysis study. Neuroscience letters, 422, 175-180.
Dudek, F.E. & Rogawski, M.A. (2005) Regulation of brain water: is there a role for aquaporins in epilepsy? Epilepsy currents, 5, 104-106.
Eid, T., Lee, T.-S.W., Thomas, M.J., Amiry-Moghaddam, M., Bjørnsen, L.P., Spencer, D.D., Agre, P., Ottersen, O.P. & de Lanerolle, N.C. (2005) Loss of perivascular aquaporin 4 may underlie deficient water and K+ homeostasis in the human epileptogenic
hippocampus. Proceedings of the National Academy of Sciences of the United States of America, 102, 1193-1198.
Engel, T., Murphy, B.M., Schindler, C.K. & Henshall, D.C. (2007) Elevated p53 and lower MDM2 expression in hippocampus from patients with intractable temporal lobe epilepsy. Epilepsy research, 77, 151-156.
Fan, Y., Zhang, J., Sun, X.L., Gao, L., Zeng, X.N., Ding, J.H., Cao, C., Niu, L. & Hu, G. (2005) Sex‐and region‐specific alterations of basal amino acid and monoamine metabolism in the brain of aquaporin‐4 knockout mice. Journal of neuroscience research, 82, 458-464.
Folbergrová, J., Haugvicová, R. & Mareš, P. (2000) Behavioral and metabolic changes in immature rats during seizures induced by homocysteic acid: the protective effect of NMDA and non-NMDA receptor antagonists. Experimental neurology, 161, 336-345.
Fuchs, S.Y., Adler, V., Buschmann, T., Yin, Z., Wu, X., Jones, S.N. & Ronai, Z.e. (1998) JNK targets p53 ubiquitination and degradation in nonstressed cells. Genes &
development, 12, 2658-2663.
Fujishiro, M., Gotoh, Y., Katagiri, H., Sakoda, H., Ogihara, T., Anai, M., Onishi, Y., Ono, H., Funaki, M. & Inukai, K. (2001) MKK6/3 and p38 MAPK pathway activation is not necessary for insulin-induced glucose uptake but regulates glucose transporter expression. Journal of Biological Chemistry, 276, 19800-19806.
Fujita, Y., Yamamoto, N., Sobue, K., Inagaki, M., Ito, H., Arima, H., Morishima, T., Takeuchi, A., Tsuda, T., Katsuya, H. & Asai, K. (2003) Effect of mild hypothermia on the
expression of aquaporin family in cultured rat astrocytes under hypoxic condition. Neurosci Res, 47, 437-444.
Gleiser, C., Wagner, A., Fallier-Becker, P., Wolburg, H., Hirt, B. & Mack, A.F. (2016)
Aquaporin-4 in Astroglial Cells in the CNS and Supporting Cells of Sensory Organs— A Comparative Perspective. International Journal of Molecular Sciences, 17, 1411.
Gorelick, D.A., Praetorius, J., Tsunenari, T., Nielsen, S. & Agre, P. (2006) Aquaporin-11: a channel protein lacking apparent transport function expressed in brain. BMC biochemistry, 7, 14.
24
Griffin, N.G., Wang, Y., Hulette, C.M., Halvorsen, M., Cronin, K.D., Walley, N.M., Haglund, M.M., Radtke, R.A., Skene, J. & Sinha, S.R. (2016) Differential gene expression in dentate granule cells in mesial temporal lobe epilepsy with and without hippocampal sclerosis. Epilepsia.
Gu, F., Hata, R., Toku, K., Yang, L., Ma, Y.J., Maeda, N., Sakanaka, M. & Tanaka, J. (2003) Testosterone up‐regulates aquaporin‐4 expression in cultured astrocytes. Journal of neuroscience research, 72, 709-715.
Heuser, K., Eid, T., Lauritzen, F., Thoren, A.E., Vindedal, G.F., Taubøll, E., Gjerstad, L., Spencer, D.D., Ottersen, O.P. & Nagelhus, E.A. (2012) Loss of perivascular Kir4. 1 potassium channels in the sclerotic hippocampus of patients with mesial temporal lobe epilepsy. Journal of Neuropathology & Experimental Neurology, 71, 814-825.
Heuser, K., Nagelhus, E.A., Taubøll, E., Indahl, U., Berg, P.R., Lien, S., Nakken, S.,
Gjerstad, L. & Ottersen, O.P. (2010) Variants of the genes encoding AQP4 and Kir4. 1 are associated with subgroups of patients with temporal lobe epilepsy. Epilepsy research, 88, 55-64.
Hua, L.L., Zhao, M.-L., Cosenza, M., Kim, M.-O., Huang, H., Tanowitz, H.B., Brosnan, C.F. & Lee, S.C. (2002) Role of mitogen-activated protein kinases in inducible nitric oxide synthase and TNFα expression in human fetal astrocytes. Journal of
neuroimmunology, 126, 180-189.
Huang, D.W., Sherman, B.T. & Lempicki, R.A. (2009a) Bioinformatics enrichment tools: paths toward the comprehensive functional analysis of large gene lists. Nucleic acids research, 37, 1-13.
Huang, D.W., Sherman, B.T. & Lempicki, R.A. (2009b) Systematic and integrative analysis of large gene lists using DAVID bioinformatics resources. Nature protocols, 4, 44-57.
Huttenlocher, P.R. (1976) Ketonemia and seizures: metabolic and anticonvulsant effects of two ketogenic diets in childhood epilepsy. Pediatric Research, 10, 536-540.
Jamali, S., Bartolomei, F., Robaglia-Schlupp, A., Massacrier, A., Peragut, J.-C., Régis, J., Dufour, H., Ravid, R., Roll, P. & Pereira, S. (2006) Large-scale expression study of human mesial temporal lobe epilepsy: evidence for dysregulation of the
neurotransmission and complement systems in the entorhinal cortex. Brain, 129, 625-641.
Janigro, D. & Walker, M.C. (2014) What non-neuronal mechanisms should be studied to understand epileptic seizures? Issues in Clinical Epileptology: A View from the Bench. Springer, pp. 253-264.
Kim, J.-E., Ryu, H., Yeo, S.-I., Seo, C., Lee, B., Choi, I.-G., Kim, D.-S. & Kang, T.-C. (2009) Differential expressions of aquaporin subtypes in astroglia in the hippocampus of chronic epileptic rats. Neuroscience, 163, 781-789.
Kovács, R., Heinemann, U. & Steinhäuser, C. (2012) Mechanisms underlying blood–brain barrier dysfunction in brain pathology and epileptogenesis: role of astroglia.
Epilepsia, 53, 53-59.
25
Landmark, C.J. (2006) Targets for antiepileptic drugs in the synapse. Medical science monitor, 13, RA1-RA7.
Lee, D.J., Hsu, M.S., Seldin, M.M., Arellano, J.L. & Binder, D.K. (2012) Decreased
expression of the glial water channel aquaporin-4 in the intrahippocampal kainic acid model of epileptogenesis. Experimental neurology, 235, 246-255.
Lee, T.S., Eid, T., Mane, S., Kim, J.H., Spencer, D.D., Ottersen, O.P. & De Lanerolle, N.C. (2004) Aquaporin-4 is increased in the sclerotic hippocampus in human temporal lobe epilepsy. Acta neuropathologica, 108, 493-502.
Li, Y.-K., Wang, F., Wang, W., Luo, Y., Wu, P.-F., Xiao, J.-L., Hu, Z.-L., Jin, Y., Hu, G. & Chen, J.-G. (2012) Aquaporin-4 deficiency impairs synaptic plasticity and associative fear memory in the lateral amygdala: involvement of downregulation of glutamate transporter-1 expression. Neuropsychopharmacology, 37, 1867-1878.
Liu, R.S., Lemieux, L., Bell, G.S., Hammers, A., Sisodiya, S.M., Bartlett, P.A., Shorvon, S.D., Sander, J.W. & Duncan, J.S. (2003) Progressive neocortical damage in epilepsy. Annals of neurology, 53, 312-324.
Löscher, W. (2011) Critical review of current animal models of seizures and epilepsy used in the discovery and development of new antiepileptic drugs. Seizure, 20, 359-368.
Löscher, W., Klitgaard, H., Twyman, R.E. & Schmidt, D. (2013) New avenues for anti-epileptic drug discovery and development. Nature reviews drug discovery, 12, 757-776.
Magistretti, P.J., Pellerin, L., Rothman, D.L. & Shulman, R.G. (1999) Energy on demand. Science, 283, 496-497.
Mao, X., Enno, T.L. & Del Bigio, M.R. (2006) Aquaporin 4 changes in rat brain with severe hydrocephalus. European Journal of Neuroscience, 23, 2929-2936.
Mathern, G.W., Adelson, P.D., Cahan, L.D. & Leite, J.P. (2002) Hippocampal neuron
damage in human epilepsy: Meyer's hypothesis revisited. Progress in brain research,
135, 237-251.
Moshé, S.L., Perucca, E., Ryvlin, P. & Tomson, T. (2015) Epilepsy: new advances. The Lancet, 385, 884-898.
Nateri, A.S., Raivich, G., Gebhardt, C., Da Costa, C., Naumann, H., Vreugdenhil, M., Makwana, M., Brandner, S., Adams, R.H. & Jefferys, J.G. (2007) ERK activation causes epilepsy by stimulating NMDA receptor activity. The EMBO journal, 26, 4891-4901.
Ngugi, A.K., Bottomley, C., Kleinschmidt, I., Sander, J.W. & Newton, C.R. (2010) Estimation of the burden of active and life‐time epilepsy: a meta‐analytic approach. Epilepsia,
51, 883-890.
Nielsen, S., Nagelhus, E.A., Amiry-Moghaddam, M., Bourque, C., Agre, P. & Ottersen, O.P. (1997) Specialized membrane domains for water transport in glial cells:
26
Oshio, K., Watanabe, H., Song, Y., Verkman, A. & Manley, G.T. (2005) Reduced cerebrospinal fluid production and intracranial pressure in mice lacking choroid plexus water channel Aquaporin-1. The FASEB journal, 19, 76-78.
Padmawar, P., Yao, X., Bloch, O., Manley, G.T. & Verkman, A. (2005) K+ waves in brain cortex visualized using a long-wavelength K+-sensing fluorescent indicator. Nature Methods, 2, 825-827.
Papadopoulos, M.C. & Verkman, A.S. (2013) Aquaporin water channels in the nervous system. Nature reviews. Neuroscience, 14, 265-277.
Pernice, H.F., Schieweck, R., Kiebler, M.A. & Popper, B. (2016) mTOR and MAPK: from localized translation control to epilepsy. BMC neuroscience, 17, 73.
Rao, K.V., Jayakumar, A.R., Reddy, P.V., Tong, X., Curtis, K.M. & Norenberg, M.D. (2010) Aquaporin‐4 in manganese‐treated cultured astrocytes. Glia, 58, 1490-1499.
Rao, K.V., Reddy, P.V., Curtis, K.M. & Norenberg, M.D. (2011) Aquaporin-4 expression in cultured astrocytes after fluid percussion injury. Journal of neurotrauma, 28, 371-381.
Rogawski, M.A. & Löscher, W. (2004) The neurobiology of antiepileptic drugs. Nature Reviews Neuroscience, 5, 553-564.
Saeed, A., Sharov, V., White, J., Li, J., Liang, W., Bhagabati, N., Braisted, J., Klapa, M., Currier, T. & Thiagarajan, M. (2003) TM4: a free, open-source system for microarray data management and analysis. Biotechniques, 34, 374.
Sakhi, S., Bruce, A., Sun, N., Tocco, G., Baudry, M. & Schreiber, S.S. (1994) p53 induction is associated with neuronal damage in the central nervous system. Proceedings of the National Academy of Sciences, 91, 7525-7529.
Satoh, J.i., Tabunoki, H., Yamamura, T., Arima, K. & Konno, H. (2007) Human astrocytes express aquaporin‐1 and aquaporin‐4 in vitro and in vivo. Neuropathology, 27, 245-256.
Schwartzkroin, P.A., Baraban, S.C. & Hochman, D.W. (1998) Osmolarity, ionic flux, and changes in brain excitability. Epilepsy research, 32, 275-285.
Simard, M. & Nedergaard, M. (2004) The neurobiology of glia in the context of water and ion homeostasis. Neuroscience, 129, 877-896.
Umenishi, F. & Schrier, R.W. (2003) Hypertonicity-induced aquaporin-1 (AQP1) expression is mediated by the activation of MAPK pathways and hypertonicity-responsive element in the AQP1 gene. J Biol Chem, 278, 15765-15770.
Wallace, B.K., Jelks, K.A. & O'Donnell, M.E. (2012) Ischemia-induced stimulation of cerebral microvascular endothelial cell Na-K-Cl cotransport involves p38 and JNK MAP kinases. American Journal of Physiology-Cell Physiology, 302, C505-C517.
Wang, J.H., Zhou, Y.J., He, P., Chen, B.Y. (2007) Roles of mitogen-activated protein kinase pathways during Escherichia coli-induced apoptosis in U937 cells.
Wieshmann, U.C., Chris, A., Symms, M.R., Barker, G.J., Birnie, K.D. & Shorvon, S.D. (1999) Water diffusion in the human hippocampus in epilepsy. Magnetic resonance imaging,
27
Williamson, A., Patrylo, P.R., Pan, J., Spencer, D.D. & Hetherington, H. (2005) Correlations between granule cell physiology and bioenergetics in human temporal lobe epilepsy. Brain, 128, 1199-1208.
Xu, S., Pang, Q., Liu, Y., Shang, W., Zhai, G. & Ge, M. (2007) Neuronal apoptosis in the resected sclerotic hippocampus in patients with mesial temporal lobe epilepsy. Journal of Clinical Neuroscience, 14, 835-840.
Yan, H.T., Wu, N., Lu, X.Q., Su, R.B., Zheng, J.Q. & Li, J. (2013) Aquaporin‐4 Deficiency Attenuates Opioid Dependence through Suppressing Glutamate Transporter‐1 Down‐regulation and Maintaining Glutamate Homeostasis. CNS neuroscience & therapeutics, 19, 12-19.
Yang, B., Ma, T. & Verkman, A. (1995) cDNA Cloning, Gene Organization, and Chromosomal Localization of a Human Mercurial Insensitive Water Channel EVIDENCE FOR DISTINCT TRANSCRIPTIONAL UNITS. Journal of Biological Chemistry, 270, 22907-22913.
Yang, H., Wu, J., Guo, R., Peng, Y., Zheng, W., Liu, D. & Song, Z. (2013a) Glycolysis in energy metabolism during seizures. Neural regeneration research, 8, 1316.
Yang, M., Gao, F., Liu, H., Yu, W.H. & Sun, S.Q. (2009) Temporal changes in expression of aquaporin3,-4,-5 and-8 in rat brains after permanent focal cerebral ischemia. Brain research, 1290, 121-132.
Yang, M., Gao, F., Liu, H., Yu, W.H., Zhuo, F., Qiu, G.P., Ran, J.H. & Sun, S.Q. (2013b) Hyperosmotic induction of aquaporin expression in rat astrocytes through a different MAPK pathway. Journal of cellular biochemistry, 114, 111-119.
Zarubin, T. & Jiahuai, H. (2005) Activation and signaling of the p38 MAP kinase pathway. Cell research, 15, 11-18.
29
[image:30.595.66.531.114.536.2]Tables:
Table 1. Patient clinical data:
Sex Age at surgery (years) Epilepsy duration (years)
Samples Side Current AEDs Previous AEDs
01 F 34 33.5
TLE-HS
TLE-NC R LMT,LEV
PB, PHT, CBZ, VPA
02 F 32 13 TLE-HS
TLE-NC R
LMT, CBZ,
GBP LEV
03 M 48 47 TLE-HS
TLE-NC R PER,CBZ
PHT, LEV,LMT, GBP,TPM,PGB,
ZNS
04 F 51 40 TLE-HS TLE-NC L LCS, LEV CBZ, LMT, VPA
05 F 54 53 TLE-HS TLE-NC L LMT,PGB
GBP,VPA,PHT, CBZ,PB,LEV,
CNP,LCS
06 M 41 29 TLE-HS
TLE-NC L CBZ , LMT LEV, ZNS, PGB
07 F 22 13 TLE-HS TLE-NC R LCS, LMT, TPM, PB VPA
08 F 25 6 TLE-HS
TLE-NC L LEV, PB,LCS PHT, LMT, CBZ
09 M 42 8 TLE-HS
TLE-NC L LCS
PER, LEV, CBZ, PHT
10 M 33 24 TLE-HS L None CBZ,VPA, LEV
AEDs: Antiepileptic drugs. CBZ: Carbamazepine. CLB: Clobazam. CNP: Clonazepam.
GBP: Gabapentin. LCS: Lacosamide. LEV: Levetiracetam. LMT: Lamotrigine. NA: not available. OXC: Oxcabazepine. PB: Phenobarbital. PER: Perampanel. PGB: Pregabalin.
30
Table 2: Fold change (FC) expression of MAPK target genes and corresponding proteins.
MAPK Targets
MAPK Gene Fold-Change (TLE-HS/TLE-NC)
Phosphorylated MAPK Protein Fold-Change
(TLE-HS/TLE-NC)
AKT Pan - 3.78*
ERK1 1.34**** ns
ERK 2 2.75**** 2.33*
GSK3 alpha 0.67* -
GSK-3 beta 1.81**** ns
HSP27 2.01** ns
JNK 2 0.54** ns
MKK3 1.15**** 2.26*
p38 delta 0.66** ns
p53 ns 2.89*
RSK 1 1.03** ns
RSK 2 ns 1.75*
Table 2: Fold change (FC) was obtained by dividing the mean of the expression level in TLE-HS by the mean of its corresponding TLE-NC expression level. The data represent a comparative analysis for selected MAPK genes (normalized to array signal) and proteins (normalized to array control) in TLE-NC and TLE-HS. The results are presented as mean ± Standard Error of the Mean (S.E.M) for (n=7) for both TLE-NC and TLE-HS in microarray analysis; and (n=3) for both of TLE-NC and TLE-HS in proteome profiler analysis, using patient matched samples. Kruskal-Wallis with Conover-Inman post hoc analysis was used to identify significant differences between samples (*P < 0.05, ** P < 0.01, ***P < 0.001 and ****P < 0.0001, ns = not significant). MA: microarray analysis. TLE: Temporal lobe epilepsy.
31
Figure captions:
Figure 1: The mRNA expression profile of cerebral AQPs in TLE-HS and TLE-NC specimens investigated using microarray analysis.
Histograms represent a comparative analysis for the cerebral AQP mRNA expression profile in TLE-HS and TLE-NC. Kruskall-Wallis with Conover-Inman post hoc analysis tests were used to identify significant differences between samples (*P < 0.05, ** P < 0.01 and ***P < 0.001).Data presented as Mean ± S.E.M. Number of samples: TLE-HS (n=7); TLE-NC (n=7). MA: microarray analysis. TLE: Temporal lobe epilepsy. TLE-HS: spiking TLE sclerotic hippocampus. TLE-NC: non-spiking TLE superior temporal gyrus. MA KCNJ10: potassium voltage-gated channel subfamily J member.
Figure 2: The translational profile of (A) AQP4 and (B) AQP1 in TLE-NC and TLE-HS specimens investigated by sandwich ELISA.
The AQP4 protein level was significantly up-regulated in TLE-HS. The protein level of AQP1 was increased in TLE-HS, though was not statistically significant. Kruskall-Wallis with Conover-Inman post hoc analysis tests were used to identify significant differences between samples (**** P < 0.0001). Number of samples: TLE-NC (n = 3); TLE-HS (n = 3) paired samples. All data presented as Mean ± S.E.M. TLE: Temporal lobe epilepsy. TLE-HS:
spiking TLE sclerotic hippocampus. TLE-NC: non-spiking TLE superior temporal gyrus.
Figure 3:KEGG Pathway Enrichment Analysis for differentially-expressed genes in TLE-HS vs TLE-NC
Data represent KEGG Pathway Enrichment Analysis for differentially-expressed genes (DEGs) in TLE-HS vs TLE-NC. The Enrichment Score value for each KEGG Pathway is reported on the side of each bar and the number of genes identified in each pathway is reported as a number inside each bar.
Figure 4: The distribution of the differentially-expressed genes within the detected MAPK signalling pathway in TLE-HS (adapted from KEGG website:
www.genome.jp/kegg)
The significant up- and down-regulated MAPK related genes, indicated with red and yellow stars respectively, were identified using DAVID/KEGG enrichment analysis of microarray data. The pathway enrichment score was 6.1 and the total number of enriched genes was 50 (27 genes were significantly down-regulated while 23 genes were significantly up-regulated). Number of samples: TLE-HS (n=7); TLE-NC (n=7).
Figure 5: MAPK signalling profile in TLE-NC and TLE-HS samples (A) microarray analysis for mRNA expression and B) proteome profiling analysis.
Histograms represent a comparative analysis for selected MAPK genes and proteins in TLE-NC and TLE-HS. Kruskal-Wallis with Conover-Inman post hoc analysis tests were used to identify significant differences between samples (*P < 0.05, ** P < 0.01, ***P < 0.001 and ****P < 0.0001). Data presented as Mean ± S.E.M. Number of samples: MA (n=7); proteome profiler analysis (n=3). MA: microarray analysis. Rn: Normalized fluorescence intensity. TLE: Temporal lobe epilepsy. TLE-HS: spiking TLE sclerotic hippocampus. TLE-NC: non-spiking TLE superior temporal gyrus.
Figure 6.The correlation between p38, ERK1/2 or JNK inhibition and AQP4 protein expression in primary human astrocytes. Data are mean fold-changes in expression (± S.E.M) (n=4). The p38 inhibitor is 10 µM SB203580; the ERK1/2 inhibitor is 10 µM PD98059; and the JNK inhibitor is 40 µM SP600125. FC: fold-change. Each bar represents the
32
Figures:
33
34
35
36
Figure 5: (A)
37
38
Supplementary material:
Supplementary Figure 1:
Supplementary Figure 1: The mRNA expression profile of NeuN and GFAP in TLE-HS and TLE-NC specimens investigated using microarray analysis.
39
Supplementary Table 1:Supplementary Table 1: Functional annotation clustering of differentially expressed genes
(DEGs): Cluster1-3
Annotation Cluster 1 Enrichment Score: 6.72
Category Term Count P Value
SP_PIR_KEYWORDS signal 97 4.44E-09
SP_PIR_KEYWORDS disulphide bond 90 4.90E-09
UP_SEQ_FEATURE signal peptide 97 6.18E-09
UP_SEQ_FEATURE disulphide bond 87 1.20E-08
UP_SEQ_FEATURE glycosylation site: N-linked (GlcNAc...) 98 1.72E-04
SP_PIR_KEYWORDS glycoprotein 101 1.76E-04
Annotation Cluster 2 Enrichment Score: 5.96
Category Term Count P Value
SP_PIR_KEYWORDS signal 97 4.44E-09
UP_SEQ_FEATURE signal peptide 97 6.18E-09
SP_PIR_KEYWORDS Secreted 55 2.51E-06
GOTERM_CC_FAT GO:0044421~extracellular region part 39 3.49E-06
GOTERM_CC_FAT GO:0005576~extracellular region 64 4.44E-06
GOTERM_MF_FAT GO:0005125~cytokine activity 15 1.02E-05
SP_PIR_KEYWORDS cytokine 14 1.15E-05
GOTERM_CC_FAT GO:0005615~extracellular space 30 1.67E-05
Annotation Cluster 3 Enrichment Score: 5.51
Category Term Count P Value
GOTERM_BP_FAT GO:0006954~inflammatory response 22 8.58E-07
GOTERM_BP_FAT GO:0006952~defense response 31 1.59E-06
GOTERM_BP_FAT GO:0009611~response to wounding 26 2.18E-05
BP: Biological Processes. CC: Cellular Components. GO: Gene ontology. GOTERM: Gene ontology term. INTERPRO: protein sequence analysis & classification resource. MF:
Molecular Functions. PIR: Protein Information Resource annotation. SMART: Simple Modular Architecture Research Tool. SP: SwissProt Protein Knowledgebase.