metal-organic papers
m1016
Xieet al. K+C7H6NO5S doi:10.1107/S1600536806012475 Acta Cryst.(2006). E62, m1016–m1017
Acta Crystallographica Section E Structure Reports Online
ISSN 1600-5368
Potassium 2-methyl-5-nitrobenzenesulfonate
Yong-Rong Xie,* Gui-Rong Lui and Xiao-Yong Yuan
Department of Chemistry and Life Sciences, Gannan Normal University, Ganzhou 341000, People’s Republic of China
Correspondence e-mail: yongrongxie@yahoo.com.cn
Key indicators
Single-crystal X-ray study
T= 292 K
Mean(C–C) = 0.002 A˚
Rfactor = 0.027
wRfactor = 0.090
Data-to-parameter ratio = 14.6
For details of how these key indicators were automatically derived from the article, see http://journals.iucr.org/e.
Received 20 March 2006 Accepted 5 April 2006
#2006 International Union of Crystallography
All rights reserved
The title compound, K+C7H6NO5S
, consists of a
two-dimensional framework of K+ ions coordinated to
2-methyl-5-nitrobenzenesulfonate anions. The K+ion is typically
eight-coordinate, surrounded by eight O atoms from six 2-methyl-5-nitrobenzenesulfonate anions.
Comment
The title compound, (I), consists of a two-dimensional
framework of K+ ions coordinated to
2-methyl-5-nitro-benzenesulfonate anions. As shown in Fig. 1, the K+ ion is
coordinated by eight O atoms from six 2-methyl-5-nitro-benzenesulfonate anions, forming a distorted square-anti-prismatic coordination geometry, in which the K—O bond
distances range from 2.7751 (14) to 3.0427 (15) A˚ , with an
average bond distance of 2.893 A˚ . In (I), the K+ion is typically eight-coordinate, e.g. K(OH2)
+
in CaKAsO48H2O (Dickens
& Brown, 1972). In the 2-methyl-5-nitrobenzenesulfonate anions, the sulfonate groups exhibit a chelating–bridging heptadentate coordination, the O1/O2 atoms and O1/O3
atoms chelate one K+ion, and each O atom bridges to another
K+ion. Only one O atom (O4) of the nitro group coordinates
to the K+ion, but the N1—O4 and N1—O5 bond distances are
almost equivalent [1.219 (2) A˚ ]. The KO8polyhedra are each
surrounded by five KO8polyhedra and condensed to {KO4}n
layers parallel to the (100) plane. The arene rings of the 2-methyl-5-nitrobenzenesulfonate anions are arranged above and below the layers.
Experimental
Hydrothermal treatment of KMnO4(1.0 mmol, 0.158 g),
Crystal data
K+C7H6NO5S
Mr= 255.29 Monoclinic,P21=c a= 14.139 (4) A˚
b= 9.367 (3) A˚
c= 7.124 (2) A˚
= 98.652 (4) V= 932.8 (5) A˚3
Z= 4
Dx= 1.818 Mg m3 MoKradiation
= 0.79 mm1 T= 292 (2) K Needle, colorless 0.230.080.06 mm
Data collection
Bruker SMART APEX-II CCD area-detector diffractometer
’and!scans
Absorption correction: multi-scan (SADABS; Sheldrick, 1996)
Tmin= 0.931,Tmax= 0.947
5275 measured reflections 2019 independent reflections 1714 reflections withI> 2(I)
Rint= 0.016
max= 27.2
Refinement
Refinement onF2 R[F2> 2(F2)] = 0.027
wR(F2) = 0.090 S= 1.03 2019 reflections 138 parameters
H-atom parameters constrained
w= 1/[2(F
o2) + (0.0661P)2] whereP= (Fo
2 + 2Fc
2 )/3 (/)max= 0.009
max= 0.37 e A˚3
min=0.27 e A˚3
Extinction correction:SHELXL97
Extinction coefficient: 0.0011 (3)
Table 1
Selected bond lengths (A˚ ).
K—O1 2.9583 (14)
K—O1i
3.0427 (15)
K—O1ii 2.7751 (14)
K—O2 2.8228 (16)
K—O2iii
2.9113 (13) K—O3iv
2.8255 (13)
K—O3i 2.8862 (15)
K—O4v
2.9188 (16)
Symmetry codes: (i)xþ1;yþ1 2;zþ
1
2; (ii)xþ1;y;z; (iii)x;yþ 1 2;z
1 2; (iv) xþ1;y;zþ1; (v)xþ1;y1
2;zþ 1 2.
H atoms were included at calculated positions and refined as riding, with C—H distances of 0.93–0.96A˚ andUiso(H) = 1.2Ueq(C)].
Data collection:SMART(Bruker, 2004); cell refinement:SAINT (Bruker, 2004); data reduction: SAINT; program(s) used to solve structure: SHELXS97(Sheldrick, 1997); program(s) used to refine
structure: SHELXL97 (Sheldrick, 1997); molecular graphics: SHELXTL (Bruker, 2004); software used to prepare material for publication:SHELXTL.
The authors thank the Jiangxi Provincial Educational Foundation of the People’s Republic of China (Nos. 20040729 and 20060237), the Natural Science Foundation of Jiangxi Province of the People’s Republic of China (No. 20060243), and the Gannan Normal University Foundation (No. 200409).
References
Bruker (2004).SMART(Version 6.0),SAINT(Version 6.0) andSHELXTL
(Version 5.1). Bruker AXS Inc., Madison, Wisconsin, USA. Dickens, B. & Brown, W. E. (1972).Acta Cryst.B28, 3056–3065. Sheldrick, G. M. (1996).SADABS. University of Go¨ttingen, Germany. Sheldrick, G. M. (1997). SHELXS97 and SHELXL97. University of
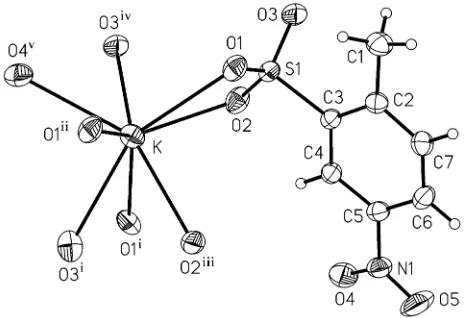
[image:2.610.320.555.79.238.2]Go¨ttingen, Germany. Figure 1
The coordination environment of the K+ion, with the atom-numbering
scheme, showing displacement ellipsoids drawn at the 50% probability
level. [Symmetry codes: (i) 1x,y+1
2, 1
2z; (ii) 1x,y,z; (iii)x, 1
2y,z 1
2; (iv) 1x,y, 1z; (v) 1x,y
1 2,
supporting information
sup-1 Acta Cryst. (2006). E62, m1016–m1017
supporting information
Acta Cryst. (2006). E62, m1016–m1017 [https://doi.org/10.1107/S1600536806012475]
Potassium 2-methyl-5-nitrobenzenesulfonate
Yong-Rong Xie, Gui-Rong Lui and Xiao-Yong Yuan
Potassium 2-methyl-5-nitrobenzenesulfonate
Crystal data K+·C
7H6NO5S−
Mr = 255.29
Monoclinic, P21/c
Hall symbol: -P 2ybc a = 14.139 (4) Å b = 9.367 (3) Å c = 7.124 (2) Å β = 98.652 (4)° V = 932.8 (5) Å3
Z = 4
F(000) = 520 Dx = 1.818 Mg m−3
Mo Kα radiation, λ = 0.71073 Å Cell parameters from 553 reflections θ = 1.9–27.4°
µ = 0.79 mm−1
T = 292 K Needle, colorless 0.23 × 0.08 × 0.06 mm
Data collection
Bruker SMART APEX-II CCD area-detector diffractometer
Radiation source: fine-focus sealed tube Graphite monochromator
φ and ω scans
Absorption correction: multi-scan (SADABS; Sheldrick, 1996) Tmin = 0.931, Tmax = 0.947
5275 measured reflections 2019 independent reflections 1714 reflections with I > 2σ(I) Rint = 0.016
θmax = 27.2°, θmin = 1.5°
h = −18→14 k = −12→10 l = −9→9
Refinement Refinement on F2
Least-squares matrix: full R[F2 > 2σ(F2)] = 0.027
wR(F2) = 0.090
S = 1.03 2019 reflections 138 parameters 0 restraints
Primary atom site location: structure-invariant direct methods
Secondary atom site location: difference Fourier map
Hydrogen site location: inferred from neighbouring sites
H-atom parameters constrained w = 1/[σ2(F
o2) + (0.0661P)2]
where P = (Fo2 + 2Fc2)/3
(Δ/σ)max = 0.009
Δρmax = 0.37 e Å−3
Δρmin = −0.27 e Å−3
Extinction correction: SHELXL97, Fc*=kFc[1+0.001xFc2λ3/sin(2θ)]-1/4
Special details
Geometry. All e.s.d.'s (except the e.s.d. in the dihedral angle between two l.s. planes) are estimated using the full covariance matrix. The cell e.s.d.'s are taken into account individually in the estimation of e.s.d.'s in distances, angles and torsion angles; correlations between e.s.d.'s in cell parameters are only used when they are defined by crystal symmetry. An approximate (isotropic) treatment of cell e.s.d.'s is used for estimating e.s.d.'s involving l.s. planes.
Refinement. Refinement of F2 against ALL reflections. The weighted R-factor wR and goodness of fit S are based on F2,
conventional R-factors R are based on F, with F set to zero for negative F2. The threshold expression of F2 > σ(F2) is used
only for calculating R-factors(gt) etc. and is not relevant to the choice of reflections for refinement. R-factors based on F2
are statistically about twice as large as those based on F, and R- factors based on ALL data will be even larger.
Fractional atomic coordinates and isotropic or equivalent isotropic displacement parameters (Å2)
x y z Uiso*/Ueq
K 0.43178 (3) 0.16967 (4) 0.12011 (5) 0.03399 (15) C1 0.82304 (14) −0.1245 (2) 0.3711 (3) 0.0393 (4)
H1A 0.8158 −0.1593 0.4949 0.059*
H1B 0.8831 −0.1565 0.3389 0.059*
H1C 0.7717 −0.1601 0.2794 0.059*
C2 0.82070 (12) 0.03601 (17) 0.3714 (2) 0.0285 (4) C3 0.73878 (11) 0.11618 (17) 0.3906 (2) 0.0244 (3) C4 0.74137 (12) 0.26380 (17) 0.3957 (2) 0.0262 (3)
H4 0.6869 0.3162 0.4090 0.031*
C5 0.82688 (12) 0.33199 (16) 0.3805 (2) 0.0284 (4) C6 0.90883 (12) 0.25777 (19) 0.3593 (2) 0.0335 (4)
H6 0.9654 0.3054 0.3484 0.040*
C7 0.90432 (12) 0.1110 (2) 0.3548 (3) 0.0336 (4)
H7 0.9591 0.0599 0.3402 0.040*
S1 0.62651 (3) 0.03419 (4) 0.41185 (5) 0.02614 (15) O1 0.59231 (9) −0.03100 (13) 0.22806 (17) 0.0362 (3) O2 0.56581 (8) 0.15045 (13) 0.4554 (2) 0.0375 (3) O3 0.64622 (9) −0.07146 (14) 0.56083 (18) 0.0405 (3) N1 0.82974 (11) 0.48761 (16) 0.3926 (2) 0.0348 (4) O4 0.76100 (10) 0.54994 (13) 0.4381 (2) 0.0441 (3) O5 0.90175 (12) 0.54864 (16) 0.3605 (3) 0.0619 (5)
Atomic displacement parameters (Å2)
U11 U22 U33 U12 U13 U23
supporting information
sup-3 Acta Cryst. (2006). E62, m1016–m1017
O3 0.0380 (7) 0.0443 (7) 0.0391 (7) −0.0081 (6) 0.0051 (6) 0.0154 (6) N1 0.0412 (9) 0.0266 (8) 0.0351 (8) −0.0069 (6) 0.0012 (7) 0.0019 (6) O4 0.0490 (8) 0.0278 (6) 0.0554 (9) 0.0036 (6) 0.0077 (7) −0.0019 (6) O5 0.0550 (10) 0.0346 (8) 0.1002 (14) −0.0182 (7) 0.0253 (10) −0.0007 (8)
Geometric parameters (Å, º)
K—O1 2.9583 (14) C3—C4 1.384 (2)
K—O1i 3.0427 (15) C3—S1 1.7902 (16)
K—O1ii 2.7751 (14) C4—C5 1.386 (2)
K—O2 2.8228 (16) C4—H4 0.9300
K—O2iii 2.9113 (13) C5—C6 1.379 (2)
K—O3iv 2.8255 (13) C5—N1 1.460 (2)
K—O3i 2.8862 (15) C6—C7 1.376 (3)
K—O4v 2.9188 (16) C6—H6 0.9300
K—Kvi 3.8669 (10) C7—H7 0.9300
C1—C2 1.504 (3) S1—O3 1.4473 (13)
C1—H1A 0.9600 S1—O2 1.4489 (13)
C1—H1B 0.9600 S1—O1 1.4597 (12)
C1—H1C 0.9600 N1—O4 1.2189 (19)
C2—C7 1.395 (2) N1—O5 1.219 (2)
C2—C3 1.404 (2)
O1ii—K—O2 134.67 (4) O3i—K—S1i 23.65 (3)
O1ii—K—O3iv 123.80 (4) O2iii—K—S1i 64.65 (3)
O2—K—O3iv 65.92 (4) O4v—K—S1i 99.17 (3)
O1ii—K—O3i 90.39 (4) O1—K—S1i 142.94 (3)
O2—K—O3i 126.47 (4) O1i—K—S1i 24.41 (2)
O3iv—K—O3i 117.62 (5) C2—C1—H1A 109.5
O1ii—K—O2iii 84.87 (4) C2—C1—H1B 109.5
O2—K—O2iii 89.03 (4) H1A—C1—H1B 109.5
O3iv—K—O2iii 150.36 (4) C2—C1—H1C 109.5
O3i—K—O2iii 64.02 (4) H1A—C1—H1C 109.5
O1ii—K—O4v 72.94 (4) H1B—C1—H1C 109.5
O2—K—O4v 126.12 (4) C7—C2—C3 117.43 (15)
O3iv—K—O4v 61.32 (4) C7—C2—C1 118.96 (15)
O3i—K—O4v 88.47 (4) C3—C2—C1 123.60 (15)
O2iii—K—O4v 144.66 (4) C4—C3—C2 121.20 (14)
O1ii—K—O1 85.48 (4) C4—C3—S1 116.54 (11)
O2—K—O1 49.33 (3) C2—C3—S1 122.26 (13)
O3iv—K—O1 87.77 (4) C3—C4—C5 118.59 (15)
O3i—K—O1 151.24 (4) C3—C4—H4 120.7
O2iii—K—O1 87.25 (4) C5—C4—H4 120.7
O4v—K—O1 117.16 (4) C6—C5—C4 122.24 (16)
O1ii—K—O1i 138.06 (4) C6—C5—N1 119.57 (15)
O2—K—O1i 81.65 (4) C4—C5—N1 118.18 (15)
O3iv—K—O1i 86.33 (4) C7—C6—C5 118.00 (16)
O2iii—K—O1i 74.00 (4) C5—C6—H6 121.0
O4v—K—O1i 104.63 (4) C6—C7—C2 122.54 (15)
O1—K—O1i 128.00 (2) C6—C7—H7 118.7
O1ii—K—S1 110.33 (3) C2—C7—H7 118.7
O2—K—S1 24.36 (3) O3—S1—O2 114.32 (8)
O3iv—K—S1 76.54 (4) O3—S1—O1 111.90 (8)
O3i—K—S1 143.00 (3) O2—S1—O1 112.31 (8)
O2iii—K—S1 86.93 (3) O3—S1—C3 106.26 (8)
O4v—K—S1 126.21 (3) O2—S1—C3 104.90 (7)
O1—K—S1 25.01 (2) O1—S1—C3 106.38 (7)
O1i—K—S1 104.35 (3) O4—N1—O5 123.18 (16)
O1ii—K—S1i 113.65 (3) O4—N1—C5 118.53 (14)
O2—K—S1i 103.77 (3) O5—N1—C5 118.27 (16)
O3iv—K—S1i 104.63 (3)